Applied Mathematics
Vol. 3 No. 5 (2012) , Article ID: 19059 , 6 pages DOI:10.4236/am.2012.35070
Breakdown Mechanic Location Problem
1Laboratory of Information Processing, ESP, Cheikh Anta Diop University, Dakar, Senegal
2Laboratory of Mathematics of Decision and Numerical Analysis, Cheikh Anta Diop University, Dakar, Senegal
3Unité Mixte Internationale, UMMISCO, Institut de Recherche pour le Développement, Bondy, France
Email: cdjiba83@yahoo.fr, mbalde111@ucad.sn, {roger.faye, babacarm.ndiaye, diaraf.seck}@ucad.edu.sn
Received March 2, 2012; revised March 28, 2012; accepted April 5, 2012
Keywords: Optimization; Location; Assignment; Urban Transportation Network
ABSTRACT
This paper studies the problem of locating breakdown mechanic. We consider a public transport network in which it can provide buses failure. The objective is, taking into account the statistics of breakdowns registered on the network, to locate optimally breakdown mechanics so as to minimize the response time (to ensure the network coverage of breakdown mechanics). In this work, we present a binary linear programming model for this location problem which provides assignments-locations of areas served. Once the location made, we discuss dynamic assignment of breakdown mechanics depending on their position in the network at a given time t. Numerical simulation results are presented based on real data of urban transportation society of Dakar Dem Dikk.
1. Introduction
Dakar Dem Dikk (3D) is the main public urban transportation company in Dakar city. This company manages a fleet of buses which, depending on road conditions compels some of them to flow in one part of the network [1,2]. Some of the buses can operate only in certain roads in the city center and the others can access in all over the network. Buses are parked overnight at Ouakam and Thiaroye depots (see Figure 1). Starting points of routes (or terminals) are different from depots. Buses must completed their provided timetable, in addition to breakdowns that can occur in the traffic. Thus, 3D sent a breakdown mechanic to the demand point so as to minimize the response time and ensure coverage in the network in breakdown mechanic. Breakdown mechanic system can be defined by the sequence of evens that begins with the dispatcher’s notification of 3D managers. Response time is an important performance criterion for breakdown mechanic systems.
The main objective is to reduce the arrival time because delay may cause congestion in the network. In a real-time context, 3D managers are faced with two main problems: an allocation problem and a redeployment problem. The allocation problem consists of determining which breakdown mechanics must be sent to answer a call. The redeployment problem consists of relocating available breakdown mechanics to the potential location sites when calls are received. Basically, the redeployment problem can be viewed as a breakdown mechanic location problem wherein breakdown mechanics are assigned to potential sites to provide adequate coverage.
In their previous studies, the 3D company has addressed questions of how many units to use, what is demand at the areas and where to locate them, in a deterministic manner. However, all breakdown mechanics are placed in Ouakam Depot. That is, most previous optimization problem of 3D have ignored that the breakdown mechanics might have a distribution in demand. This paper extends one of the deterministic models used to address this question to account for the demand uncertainty. A real data set of 3D is used to outline breakdown mechanic system design.
The result suggests that the deterministic model significantly underestimates the demand uncertainty. Briefly, the location-allocation problem consists on placing one or more points in the space to optimize a criterion. This problem involves four components:
1) customers, who are presumed to be already located at points or on routes2) facilities that will be located3) a space in which customers and facilities are located, and 4) a metric that indicates distances or times between customers and facilities.
This type of problem is well known in the literature and has several applications: locating telephone switching centers, hub location, school districting, hospital locations etc.
Location-allocation problems deal with decisions of finding the best (or optimal) configuration for the installation of one or more facilities in order to attend the demand of a population [3]. Pizzolato et al. [4] studied the problem of locating elementary schools based on two countries of the metropolitan area of Rio de Janeiro (Brazil). Nooradelena and Noraida [5] used the p-median problem to determine the best location to place a limited number of emergency medical services taking into account the uncertainty in the demand for the emergency services. The p-median problem is a location-allocation problem that has been extensively studied. The reason for the interest in the p-median problem is that it has practical applications in a wide variety of planning problems: locating telephone switching centers [6,7], school districting [8], and bank location [9]. Chardaire and Lutton [10] extended the p-median problem to account for different types of located facilities that interact such as telecommunication terminals that are connected to concentrators, which are connected to each other. Densham and Rushton [11] worked on a p-median problem where every facility needs a minimum workload.
This paper is organized as follows: In Section 2, we present the model of the breakdown mechanic location problem. Section 3 is devoted to the numerical simulation results. In Section 4, we discuss the dynamic allocation of demand points to locations. Finally, summary and conclusions are presented in Section 5.
2. Formulation of the Breakdown Mechanic Location Problem
In this section, we present the p-median model proposed to solve the breakdown mechanic location problem. For the formulation, we use the following notations:
 set of demand points.
 set of facility locations.
 : shortest distance between demand point
  and facility location
 .
.
 : number of facilities to be established.
 : breakdowns at demand point
 .
.
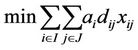
The objective function that minimizes the total weighted distance of assignment:
 (1)
(1)
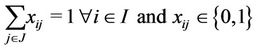
subject to
 (2)
(2)
 (3)
(3)
 (4)
(4)
 (5)
(5)
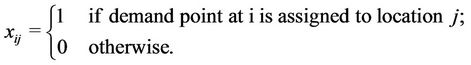
The objective function (1) minimizes the total weighted distance of assignment . When demand point
  is assigned to a facility located at
 , then
  and the associated weighted distance
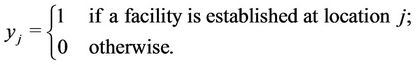
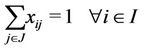
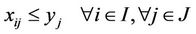
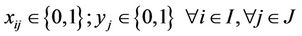
  is included in the weighted distance sum. Constraint (2) ensures that each demand point must be assigned to at least one facility site. Constraint (3) restricts the placement or allocation of facilities to exactly p, where p is the number of facilities to be established. Constraint (4) maintains that any such assignment must be made to only those sites that have been selected for a facility. Constraint (5) represents the domain of variables.
3. Numerical Experiments for the Allocation Problem
Every configuration that has exactly  facilities is a solution for the p-median problem. The optimal solution is a configuration that has the minimal distance. Every p-median problem has at least one optimal solution but there can be more if more than one configuration with the minimal distance exists. In addition to these three major datasets, a positive integer number p must be chosen to specify how many facilities are to be located.
The input data to solve the problem are:
1) the finite number of demand points with demand values to specify the location and amount of demand that needs to be satisfied;
2) the finite number of facility locations (the only positions where facilities can be established). All demand points are facility locations;
3) distances between demand points and facility locations.
All distances are calculated from the 3D’s network. Recall that, the determination in choosing which demand points served by the breakdown mechanics at these facility locations depends on the distance between demand points and facility locations.
Demands points are represented in Figure 2, and we have 32 points. This map of Dakar city showing the 32 nodes is obtained by using the software EMME [12]. Indeed, in the 3D network often occurs failures bus. Once declared a failure, the team on the bus initiates a warning to a troubleshooting team that moves with a breakdown mechanic to the alert location to ensure reparation.
We have thirty two (32) points of demand and thirty two (32) points for potential locations. Table 1 shows the demand points/facility locations and zone weights
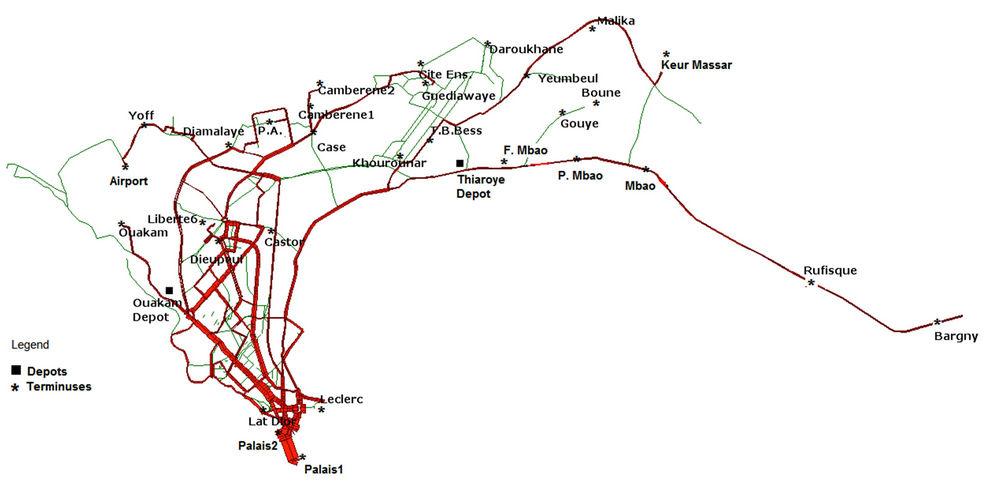
Figure 1. 3D transportation network.
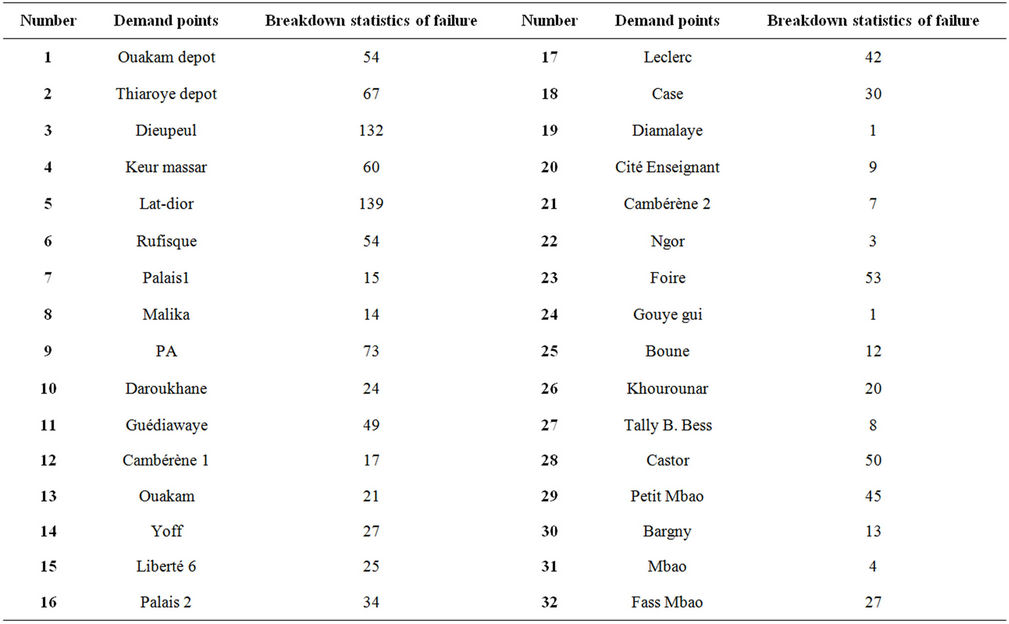
Table 1. 3D breakdown statistics.
(breakdown statistics) for the scenario. Thus, the input data are the following:
· number of demand points: ;
;
· number of facilities: ;
;
· number of breakdown mechanics to be located: ;
;
· matrix of distances between demand points and potential locations.
For this scenario, there is any restriction placed on facility locations because all the 32 facility locations are demand points. The numerical tests were performed by using the commercial MILP solver, namely IBM-CPLEX [13], with a total number of 1056 variables and 1057 constraints. The numerical experiments were executed on a computer: 2Intel(R) Core(TM)2 Duo CPU 2.00GHz, 4.0Gb of RAM, under UNIX system. With the given 3 breakdown mechanics and from 32 facility locations, the optimal locations are location 3 (Dieupeul), location 5 (Lat-Dior) and location 29 (Petit Mbao) (see Table 2).
Breakdown mechanic from Dieupeul responds to demand points of 1, 9, 12, 13, 14, 15, 18, 19, 21, 22, 23, 28 and itself. Breakdown mechanic from Lat Dior responds to demand points of 2, 4, 6, 8, 10, 11, 20, 24, 25, 26, 27, 30, 31, 32 and itself. Breakdown mechanic from Petit Mbao responds to demand points of 7, 16, 17 and itself.
The results are illustrated in Figure 2. Dakar city is divided into three zones to be covered by the breakdown mechanics.
4. Dynamic Assignment of Breakdown Mechanics
In Section 3, we provided an assignment of the three 3D breakdown mechanics into three delimited sectors that cover the entire network. Now, we examine the case where a breakdown mechanic has done a repairing and there is a new breakdown that happens near its position. Thus two situations are possible:
1) this breakdown takes place in the same sector to which the breakdown is assigned2) the breakdown happens in a different sector.
In the former case, naturally the breakdown mechanic has to do that repairing. In the latter case, according to the solution given in Section 3, it is forbidden to that mechanic to do the repairing even though the breakdown point is the nearer possible.
Our proposed dynamic approach for the p-median problem in the 3D case study involve additional fees to be supported by this company: GPS materials, rapid information transfer from demand points to processing centre and instantaneous response for covering repairing demands. Nevertheless, another problem which arises is a congestion related to great number of simultaneous repairing demand. In this case, a primary work should be made to categorize demands according to criteria such as: the seriousness of the repairing, the importance of losses generated by buses failure. Boffey et al. [14] proposed a review of congestion models in location.
Their discussion was concentrated largely on treating capacity/congestion via capacity constraints since this is often the appropriate way, particularly for public facilities. They affirmed that capacity/congestion effects may alternatively be treated by incorporating an appropriate

Table 2. Assignment of demand points to locations.
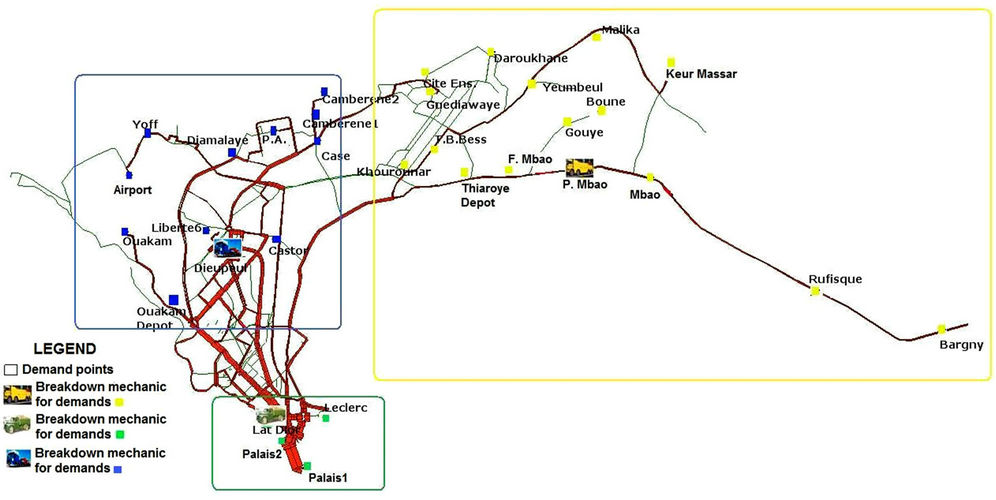
Figure 2. Breakdown mechanics location assignment of demand points.
term in the objective. This might be the best way if the relevant constraints are nonlinear and are not easily linearisable.
In our study, we give a solution to this dilemma in two steps. First, we assume that breakdown trucks (mechanics) do not return to their initial location: they stay at the site where the repairing has just been done. Second, we make an assignment of the three breakdown mechanics.
The assignment model is derived from the p-median problem presented in Section 2.
Indeed, it can be proved that the p-median problem is equivalent to two sub-problems: a strategic problem that consists on determining the locations of breakdown mechanics and a tactical problem of assigning the demand points to the location.
These two kind problems are presented below respectively as LP (Location Problem) and AP (Assignment Problem).
The formulation of the LP is:
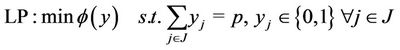 (6)
(6)
and, for the AP, it is:
 (7)
(7)
s.t.
 (8)
(8)
From this dispatching, we consider that the solution of the LP problem is already given by the solution of the simulations in Section 3 or by the positions occupied by the breakdown mechanics at a given instant (after a repairing or not). Now, we show how the assignment is done by the use of a scenario. The numerical tests are always performed by using the IBM-CPLEX’s MILP solver [13].
Scenario: Initially all the three breakdown mechanics ,
,  and
and  are in there reserved positions:
  at Dieuppeul,
  at Lat dior and
  at Petit Mbao (see Figure 2). Let assume that the breakdown mechanic
  moves to Cambérène 2 for a repairing and just after that, happens an incident somewhere else in the network. Then by applying the simulations, with the AP model, we obtain in Table 3 the new assignment of all the breakdown mechanics at that moment
 .
.
Demands points of 1, 7, 13, 16, 17 are assigned to the breakdown mechanic from Lat-Dior. Demand points of 3, 9, 11, 12, 14, 15, 18, 19, 20, 22, 23, 26, 27 and 28 are
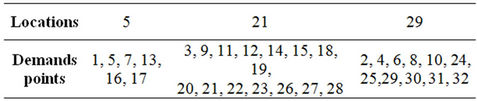
Table 3. Dynamic assignment of breakdowns.
assigned to the breakdown mechanic from Cambérène 2; while demand points of 2, 4, 6, 8, 10, 24, 25, 30, 31 and 32 are assigned to the breakdown mechanic from Cité Enseignant.
For the applicability of this method, breakdown mechanics positions must be known at any time and a permanent connection to the main depot have to be made.
Given a dynamic assignment of breakdown mechanics, the advantage of this method is that it avoids to the company to have a breakdown mechanic immobilized at a point, whereas there is a repairing to make in the network.
5. Conclusion and Remarks
In this paper, we describe how the p-median model can be used to compute an optimal solution for the demand at Dakar city and where to locate breakdowns, in a deterministic manner. We have described a computational study to solve the related model to optimality. The results give the new assignment of different demand points and divide Dakar in three zones to be covered by breakdown mechanics. Compare to the actual management of breakdown mechanics, we show that there are big savings that 3D could make while using not only static solution but also the dynamic one.
6. Acknowledgements
We would like to thank all DSI’s members of 3D for their time and efforts in providing us with significant improvements of this paper.
REFERENCES
- C. B. Djiba, “Optimal Assignment of Routes to a Terminal for an Urban Transport Network,” Master of Research Engineering Sciences, Polytechnique Graduate School of Dakar, Cheikh Anta Diop University, 2008.
- Full Traffic of Dakar Dem Dikk (2008-2009). File InputOutput. http://www.demdikk.com
- M. Dakin, “Network and Discrete Location: Models, Algorithms and Applications,” Wiley Interscience, New York, 1995. doi:10.1002/9781118032343
- N. D. Pizzolato, B. Hamilton and D. S. Fraga, “The Location of Public Schools: Evaluation of Practical Experiences,” International Transactions in Operational Research, Vol. 4, No. 1, 1997, pp. 13-22.
- M. R. Nooradelena and A. G. Noraida, “An Application of the p-Median Problem with Uncertainty in demand in Emergency Medical Services,” Proceedings of the 2nd IMT-GT Regional Conference on Mathematics, Statistics and Applications, Universiti Sains Malaysia, Penang, 13- 15 June 2006.
- S. L. Hakimi, “Optimum Distribution of Switching Centers in a Communication Network and Some Related Graph Theoretic Problems,” Operations Research, Vol. 13, No. 3, 1965, pp. 462-475. doi:10.1287/opre.13.3.462
- S. L. Hakimi, “Optimization Locations of Switching Centers and the Absolute Centers and Medians of a Graph,” Operations Research, Vol. 12, No. 3, 1964, pp. 450-459. doi:10.1287/opre.12.3.450
- R. Honey, G. Rushton, P. Lononis, B. Dalziel, M. Armstrong and S. D. P. Densham, “Stages in the Adoption of a Spatial Decision Support System for Reorganizing Service Delivery Regions,” Environment and Planning C: Government and Policy, Vol. 9, No. 1, 1991, pp. 51-63. doi:10.1068/c090051
- D. Willer, “A Spatial Decision Support System for Bank Location: A Case Study,” NCGIA Technical Report 90-9, 1990.
- P. Chardaire and J. L. Lutton, “Using Simulated Annealing to Solve Concentrator Location Problems in Telecommunication Networks, Applied Simulated Annealing,” Springer, Berlin, 1993, pp. 175-199.
- P. Densham and G. Rushton, “A More Efficient Heuristic for Solving Large p-Median Problems,” Papers in Regional Science, Vol. 71, 1996, pp. 307-329.
- INRO Consultants Inc., EMME User’s Manual, 2007.
- IBM ILOG CPLEX Optimization Studio V12.3, “Using the CPLEXR Callable Library and CPLEX Barrier and Mixed Integer Solver Options,” 2011. http://www-01.ibm.com/software/integration/optimization/cplex-optimization-studio
- B. Boffey, R. Galva and L. Espejo, “A Review of Congestion Models in the Location of Facilities with Immobile Servers,” European Journal of Operational Research, Vol. 178, No. 3, 2007, pp. 643-662. doi:10.1016/j.ejor.2006.04.044