Advances in Bioscience and Biotechnology
Vol. 4 No. 12 (2013) , Article ID: 41285 , 7 pages DOI:10.4236/abb.2013.412144
Optimization of medium components using response surface methodology (RSM) for mycelium biomass and exopolysaccharide production by Lentinus squarrosulus
![]()
1School of Bioscience and Biotechnology, Faculty Science and Technology, National University of Malaysia, Bangi, Selangor, Malaysia 2Department of Applied Microbiology, Faculty of Applied Sciences, Taiz University, Taiz, Yemen
Email: *fauzid@ukm.my
Copyright © 2013 Rahayu Ahmad et al. This is an open access article distributed under the Creative Commons Attribution License, which permits unrestricted use, distribution, and reproduction in any medium, provided the original work is properly cited.
Received 8 October 2013; revised 11 November 2013; accepted 29 November 2013
Keywords: Lentinus squarrosulus; Response Surface Methodology (RSM); Exopolysaccharide; Submerged Culture; Central Composite Design (CCD)
ABSTRACT
The interaction between sucrose, yeast extract and initial pH was investigated to optimize critical medium components for mycelium biomass and production of exopolysaccharide (EPS) of Lentinus squarrosulus using Response Surface Methodology (RSM). A central composite design (CCD) was applied and a polynomial regression model with quadratic term was used to analyse the experimental data using analysis of variance (ANOVA). ANOVA analysis showed that the model was very significant (p < 0.0001) for both mycelium biomass and EPS production. The yeast extract concentrations and initial pH showed the strongest effect (p < 0.001) meanwhile sucrose concentrations showed significant value at p < 0.005 for mycelium biomass. For EPS production, only sucrose and yeast extract concentrations gave significant value with p < 0.001 and p < 0.005 respectively. The model was validated by applying the optimized conditions and 25.8 ± 0.9 g/L of mycelium biomass, and 5.7 ± 0.4 mg/mL EPS concentration was obtained. The estimated optimum conditions of the variables for the production of mycelium biomass and EPS production by Lentinus squarrosulus are as follows: sucrose concentration 114.61 g/L, yeast extract 1.62 g/L and initial pH of 5.81; sucrose concentration 115.8 g/L, yeast extract of 3.39 g/L and initial pH of 6.44 respectively.
1. INTRODUCTION
Lentinus squarrosulus is an edible mushroom commonly found in the wild which has recently shown potential medicinal and pharmaceutical properties. There have been several reports on the isolation of bioactive compound from the fruiting bodies, mycelium and culture broth of Lentinus squarrosulus culture. Sudirman and coworkers [1], conducted the isolation of bioactive compound from culture broth, resulted in isolation of two antibiotics compounds. A water-soluble polysaccharide was also isolated from the hot water and alkaline extract of Lentinus squarrosulus fruiting bodies [2,3].
The cultivation of mushroom fruiting bodies usually takes several months for the first fruiting body to be appeared. Due to the long cultivation time of the conventional mushroom cultivation, submerged fermentation is viewed as a promising alternative cultivation method for the efficient growth of mycelium biomass and production of EPS. Submerged fermentation provides a faster production of mycelia biomass and polysaccharides in a shorter period of time within a reduced space and lesser chances of contamination. However, only minor attention has been paid to the optimization of media components for the growth of mycelium biomass and polysaccharides production in submerged fermentation.
Response surface methodology (RSM) is one of the most useful statistical optimization tools in biological and chemical process [4]. RSM has been increasingly used for various phases of an optimization process in fermentation [5,6]. RSM is a collection of statistical and mathematical techniques useful for designing experiments, developing models and evaluating the effects of variables in which a response of interest is influenced by several variables and the objective is to optimize this response [7]. Basically, RSM consists of central composite design (CCD), Box-Behnken design, one factor design, D-optimal design, user-defined design and the historical data design. The most used statistical methods are CCD and Box-Behnken design. For one numeric variable, CCD has 5 levels (−α, −1, 0, +1, +α) whereas the BoxBehnken design only has 3 levels (−1, 0, +1) [8]. RSM also provides an experimental model that predicts the correlation and interaction between a set of experimental variables and observed results, and subsequently provides optimized conditions [9].
In our preliminary experiments, the one-factor-at-atime method was adopted to investigate the effect of medium components (i.e. carbon, nitrogen) and environmental factors (i.e. initial pH) on mycelial growth and EPS production. The one-factor-at-a-time results indicated that the critical medium components affecting the performance of culture in terms of mycelium biomass and EPS production were the concentration of sucrose, yeast extract and the initial pH of the culture medium (unpublished). To best of our knowledge, there is no data published on the optimization of medium components for mycelium biomass and EPS production by Lentinus squarrosulus. Thus, in this study, response surface methodology (RSM) was used to determine the optimum medium components for mycelium biomass and EPS production by Lentinus squarrosulus and to better understand the interaction between the medium components (sucrose, yeast extract and initial pH), mycelium biomass and EPS production.
2. MATERIAL AND METHODS
2.1. Mushroom Mycelium
Stock cultures were maintained in 50% glycerol stock, stored at −20˚C for a long-term used. The mycelium from stock culture was placed in the centre of PDA agar an incubated for 7 days. A 5 mm plug of Lentinus squarrosulus mycelium was removed with a cork borer from 7 day-old-culture. The mycelial cut (10 plugs) was transferred into liquid medium, incubated for 7 days for mycelial growth and EPS production.
2.2. Optimization of Medium Components Using RSM
The preliminary study indicated that sucrose, yeast extract and initial pH were significant variables for mycelium biomass and EPS production (data not shown). The concentration of KH2PO4 (1 g/L) and MgSO4∙7H2O (0.5 g/L) was kept constant throughout the investigation because they had no significant effect on mycelium biomass and EPS production.
A CCD was used in the optimization of mycelium biomass and EPS production. It is nonlinear model and used to establish the regression model equations and operating conditions from the suitable experiments [10]. Only minimum numbers of experiments are required for modelling to fit a second-order model by using CCD [11]. The CCD consists of a 2n factorial runs (coded to the usual ± notation) with 2n axial runs (±α, 0, 0,  , 0), (0, ±α, 0, 0,
  , 0),
, 0),  , (0, 0,
  , ±α) and n centre runs (six replicates, 0, 0, 0,
  , 0). The range and the levels of the variables investigated in this study are given in Table 1. The lowest and the highest levels of variables were: sucrose, 60 and 130 g/L; yeast extract, 1 and 4 g/L; initial pH 5 and 9.
Based on the second-order quadratic model for biomass and EPS production, an empirical model was developed in order to analyse the impact of factors interactions as shown by Eq.1:
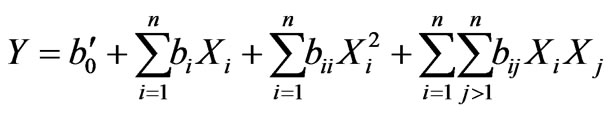 (1)
(1)
where Y is the predicted response,  is the constant coefficient
  is the linear coefficient,
  is the interaction coefficient,
  is the quadratic coefficient, and
  are the coded values.
2.3. Analytical Methods
The precipitation of EPS was conducted as followed the methodology of [12]. The supernatant was mixed with 4 times (4:1 v/v) the volume of absolute ethanol, stirred vigorously and kept overnight at 4˚C. The precipitated extracts were centrifuged at 10,000 rpm for 20 min discarding the supernatants. The insoluble component was suspended in 1 mL distilled water and was assayed by phenol-sulfuric acid method [13] using D-glucose as a standard. The dry weight of mycelium was measured after repeated washing of the mycelial pellet with distilled water and drying at 70˚C to a constant weight.
3. RESULTS AND DISCUSSION
3.1. Optimization of Mycelium Biomass Growth
The effect of medium components on the mycelium biomass and EPS production was investigated. As far as it is concern, this was the first time that the medium components have been optimized for mycelium biomass and EPS production by Lentinus squarrosulus. Table 2 shows the CCD design and the levels of each variables, mycelium biomass and EPS production as the responses. A CCD gave a total of 20 experiments which are required to evaluate the coefficients of each model using linear regression analysis. Quadratic regression analysis using
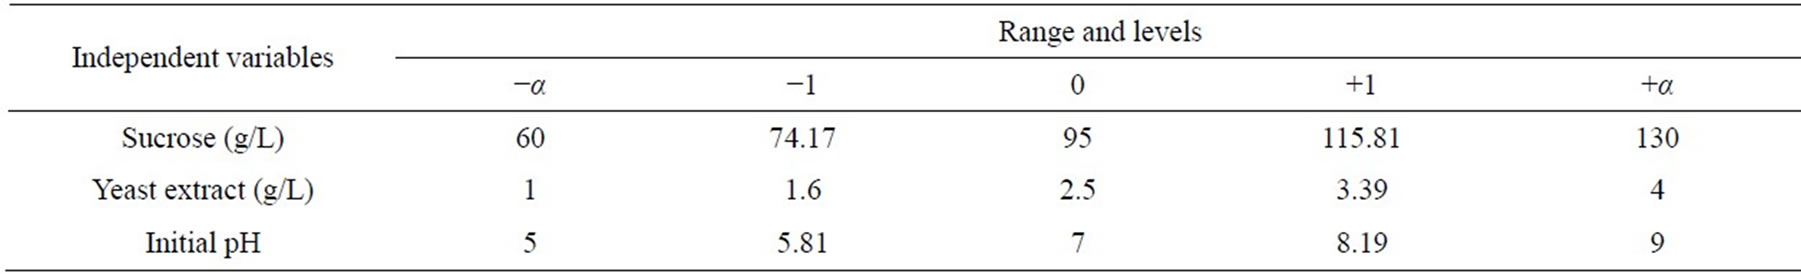
Table 1. Experimental range and levels of the independent variables.
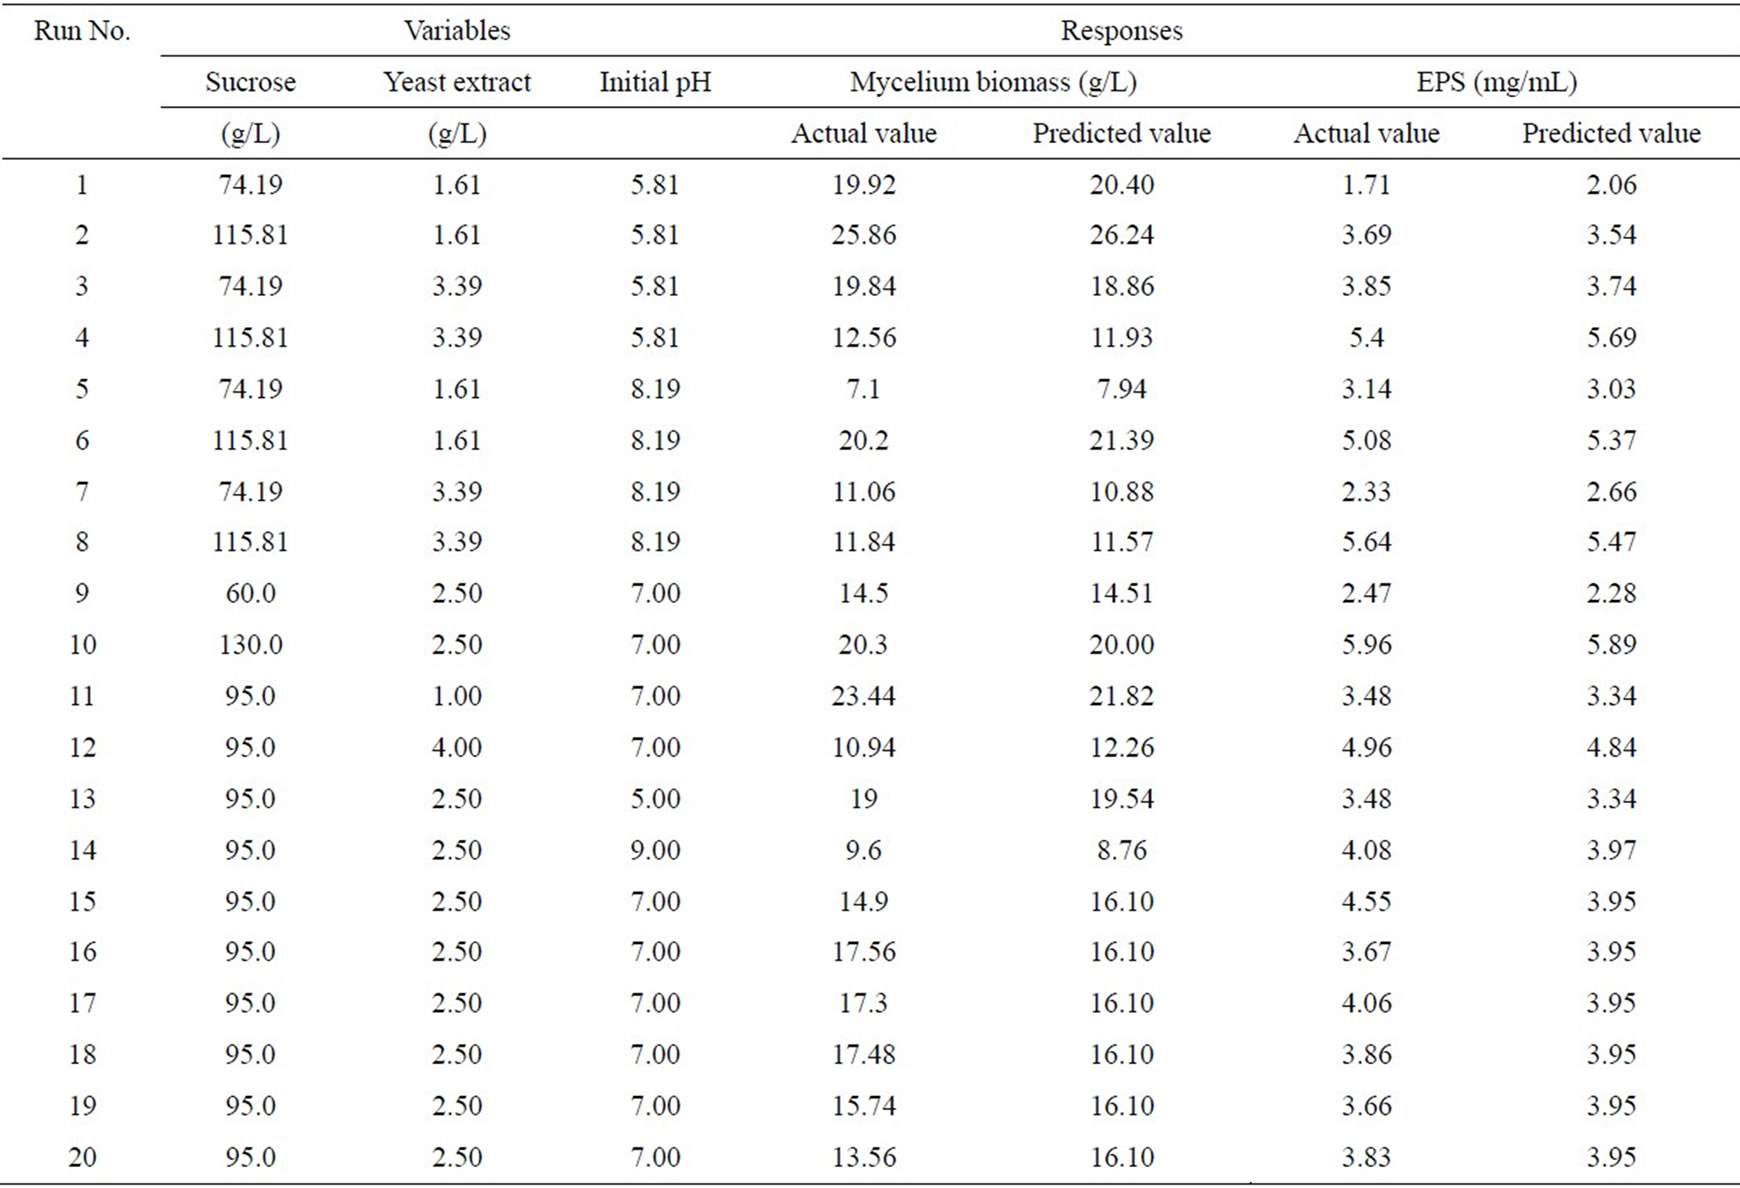
Table 2. Experimental design matrix using RSM with CCD and responses for mycelium biomass and EPS production.
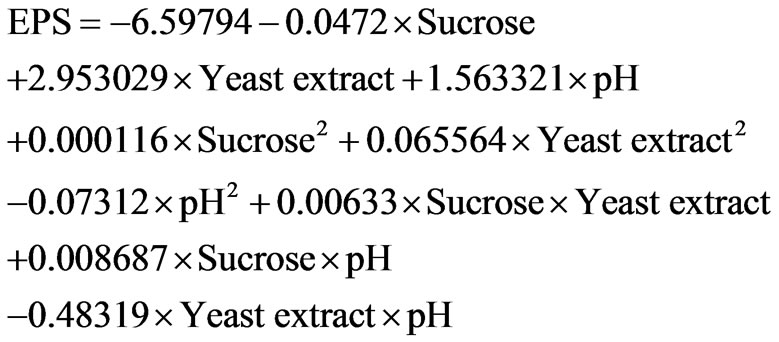
ANOVA was used to estimate the significance of model coefficients and the p values indicated the significance of each coefficient, which also showed the interaction strength between each independent variable. The model in terms of actual variables of mycelium dry weight was regressed by mainly considering the significant terms and was expressed by Eq.2.
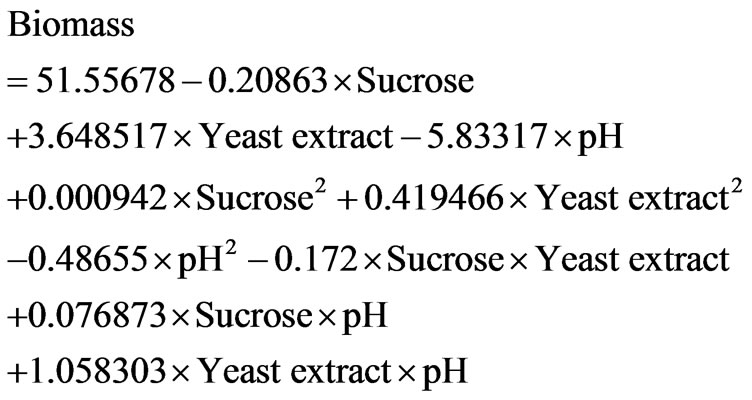 (2)
(2)
Table 3 shows the analysis of variance (ANOVA) for the experiment. The model was highly significant (p < 0.001) and the coefficient determination (R2) was shown as 0.9482, indicating that 94.82% of the variability in the response could be explained by the model and only less than 6% of the total variations were not explained by the model. The adjusted determination coefficient value (Adj. R2 = 0.90) was within reasonable agreement with the predicted R2 of 0.9482 and it also implied the significance of the model.
The model reveals that yeast extract (B) and initial pH (C) showed the strongest effect (p < 0.001) on mycelium biomass meanwhile sucrose concentrations shows significance effect at p < 0.005. Quadratic terms of sucrose concentration and yeast extract concentration (AB) also had a significance effect p < 0.001 on the yield of myce-
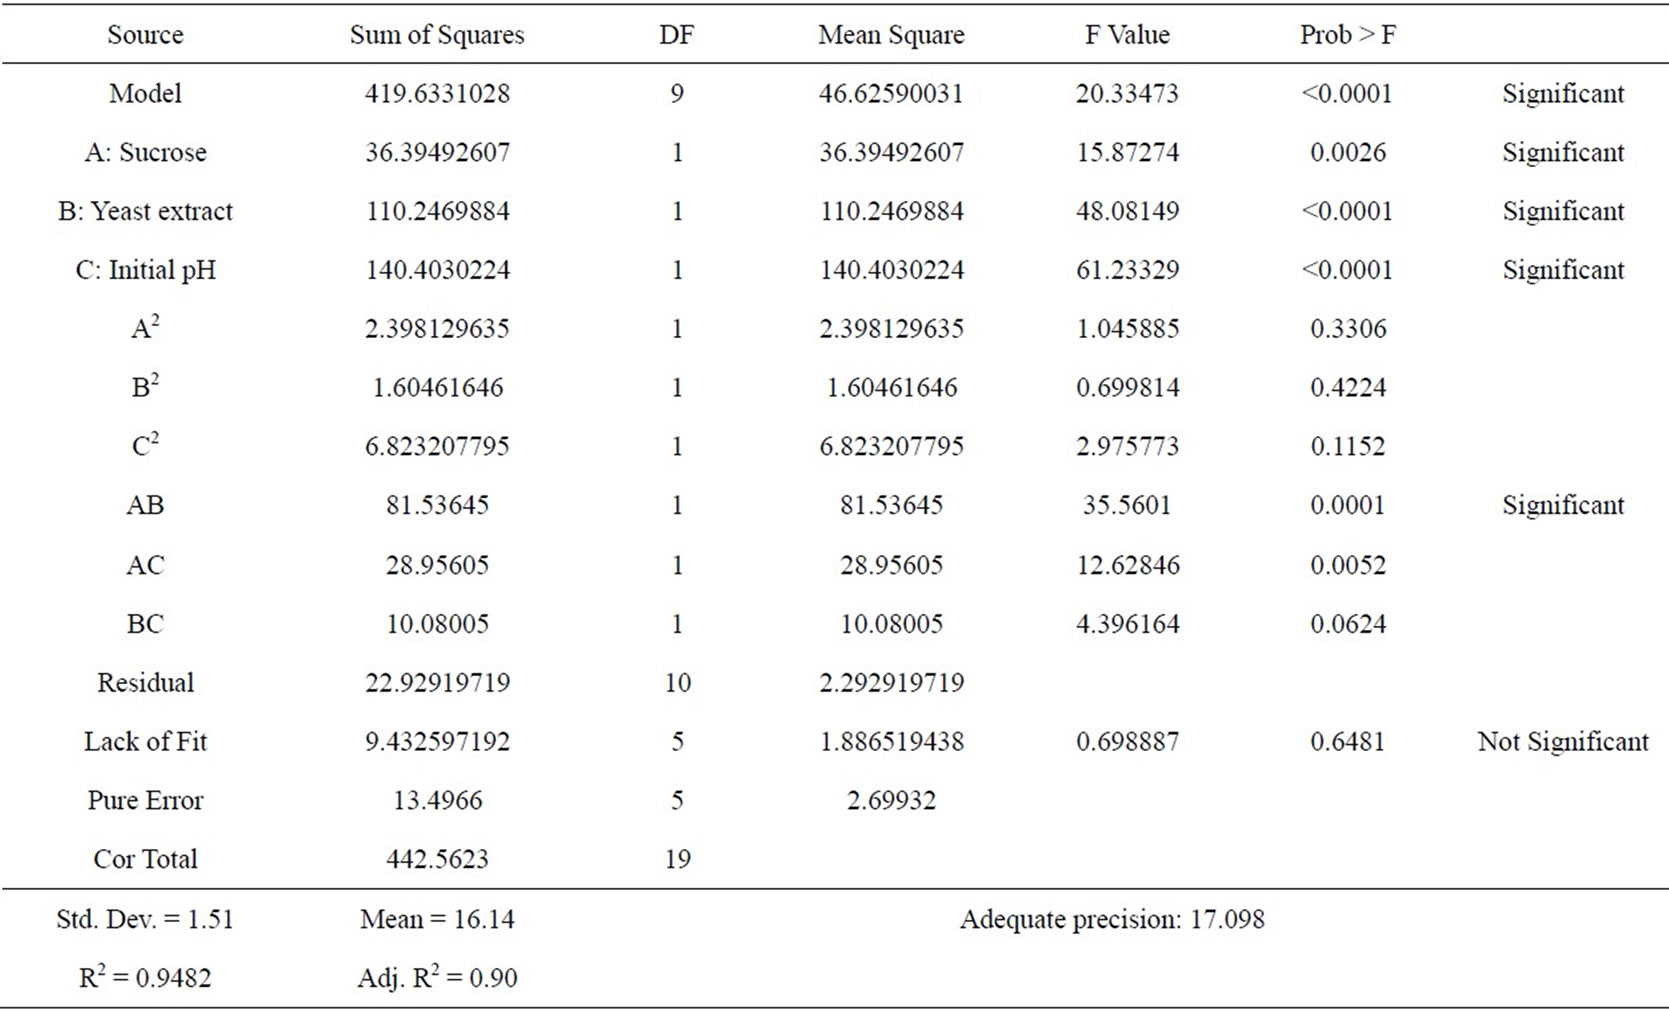
Table 3. Analysis of variance (ANOVA) for the experimental results of the CCD quadratic model for mycelium biomass.
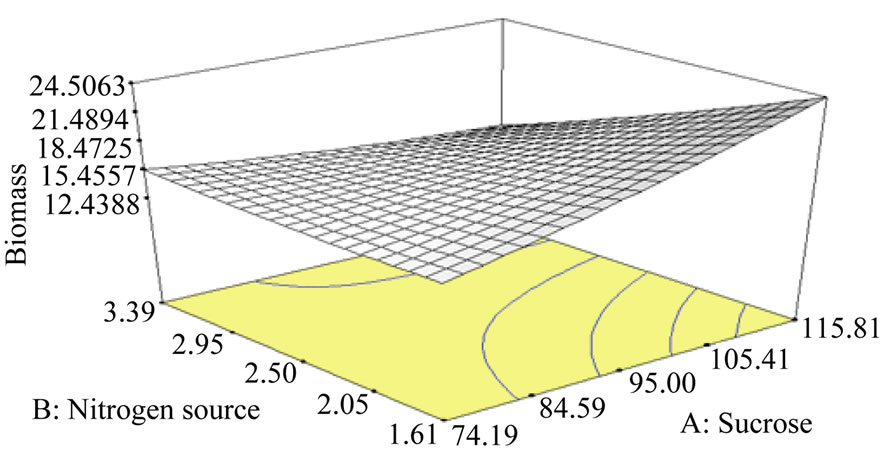
lium biomass. However, quadratic terms (A2, B2, C2, AC and BC) had negative effects. Figure 1 describes the three dimensional plots (3D) of the combined effect of sucrose concentration, yeast extract concentration and initial pH on the mycelium biomass production. In these plots, one factor is constant at the optimum level whereas the other two factors are varying within their experimental range. Figure 1(a) showed the effect of varying the sucrose and yeast extract concentration on mycelium biomass. It was obvious that increasing the sucrose and yeast extract concentration leads to increase of mycelium biomass. The maximum mycelium biomass obtained was at sucrose concentration of 115.81 g/L and yeast extract concentration of 1.61 g/L. Figures 1(b) and (c) showed the interaction between sucrose (A), yeast extract (B) concentration and pH (C) and these 3D plot showed no significant interaction between sucrose concentration with pH (AC) and yeast extract concentration with pH (BC).
3.2. Optimization of EPS Production
Table 4 shows the analysis of variance (ANOVA) of response surface quadratic model for EPS production. The model was also highly significant (p < 0.001) and the coefficient determination (R2) was shown as 0.9504, indicating that 95% of the variability in the response could be explained by the model and only less than 5% of the total variations were not explained by the model. The adjusted determination coefficient value (Adj. R2 = 0.91) was within reasonable agreement with the predicted R2 of 0.9504 and it also implied the significance of the model. The model in terms of actual variables and mycelium biomass as the predicted response was based on following equation:
 (3)
(3)
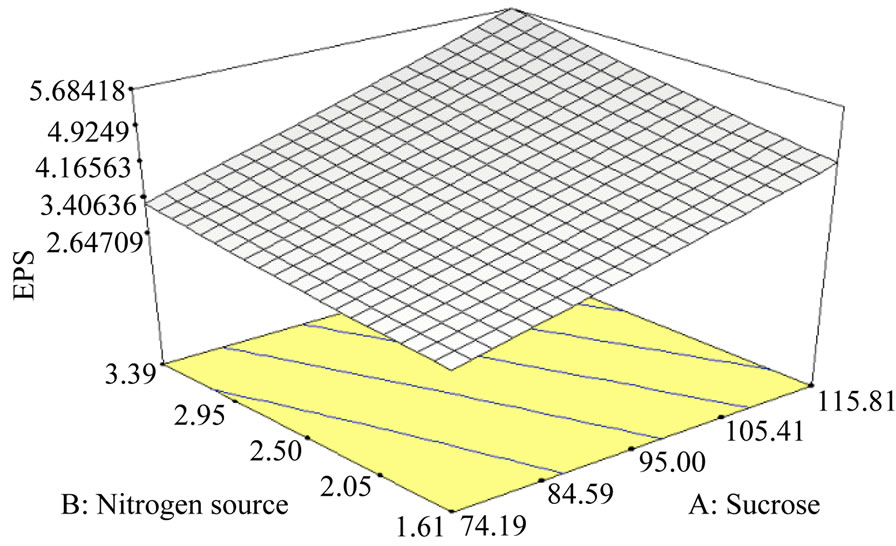
The models exhibited that sucrose (A) and yeast extract (B) concentration had a significant effect (p < 0.001) on EPS concentration (mg/mL). Positive coefficient of A and B indicated a linear effect to increase the production of EPS but initial pH showed negative effect. Results indicated that increasing the sucrose and yeast extract concentration resulted in the increased of EPS production while initial pH did not have significant effect on EPS production. However, all quadratic terms A2, B2, C2, AB, AC, BC have negative effects that decreases the YEPS. Figure 2 represents the three dimensional plots (3D) of the combined effect of sucrose concentration, yeast ex-
 (a)
(a)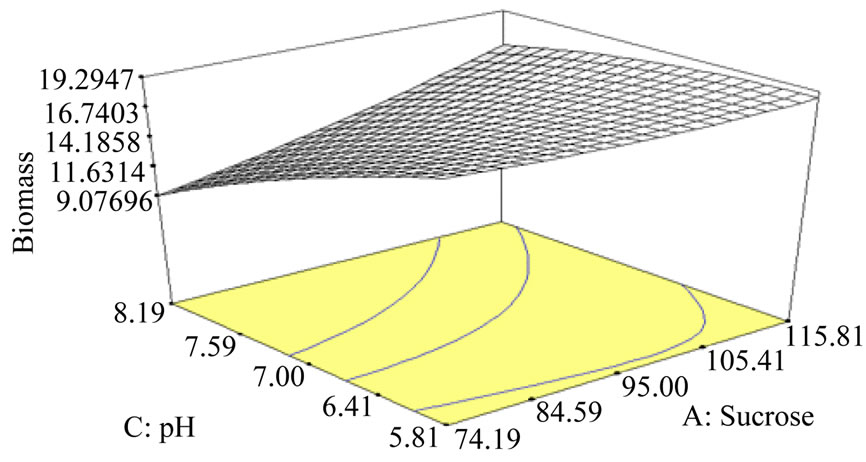 (b)
(b)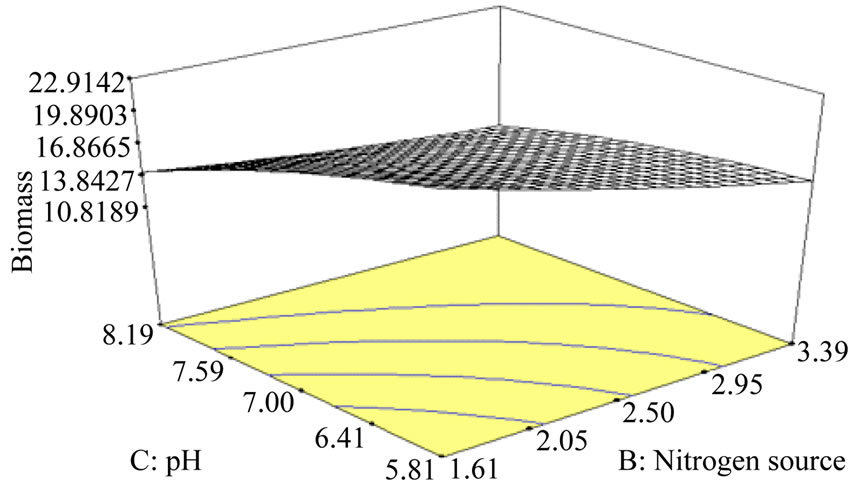 (c)
(c)
Figure 1. Response surface curve (3D plot) of mycelium biomass from Lentinus squarrosulus showing the interaction between (a) Sucrose and yeast extract concentration, (b) Sucrose concentration and pH, (c) Yeast extract concentration and pH.
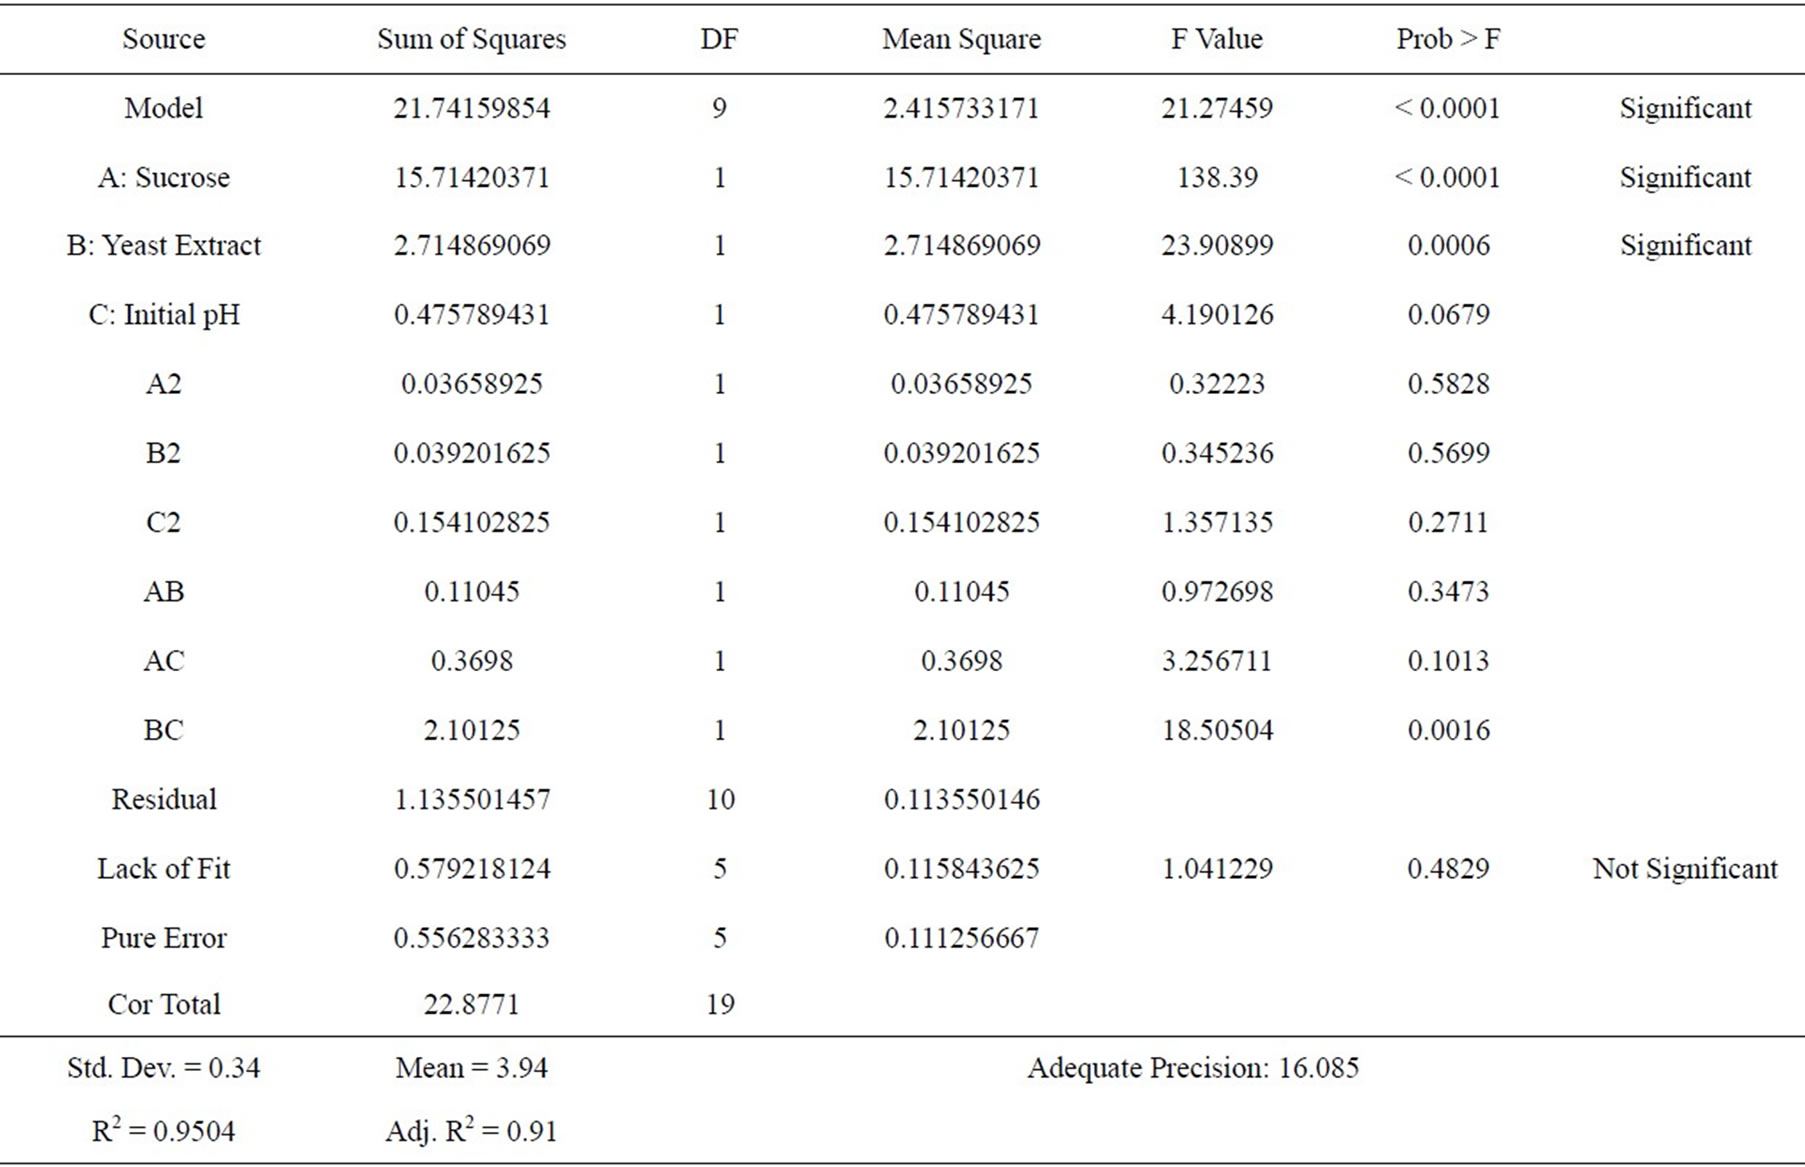
Table 4. Analysis of variance (ANOVA) for the experimental results of the CCD quadratic model for EPS production.
 (a)
(a)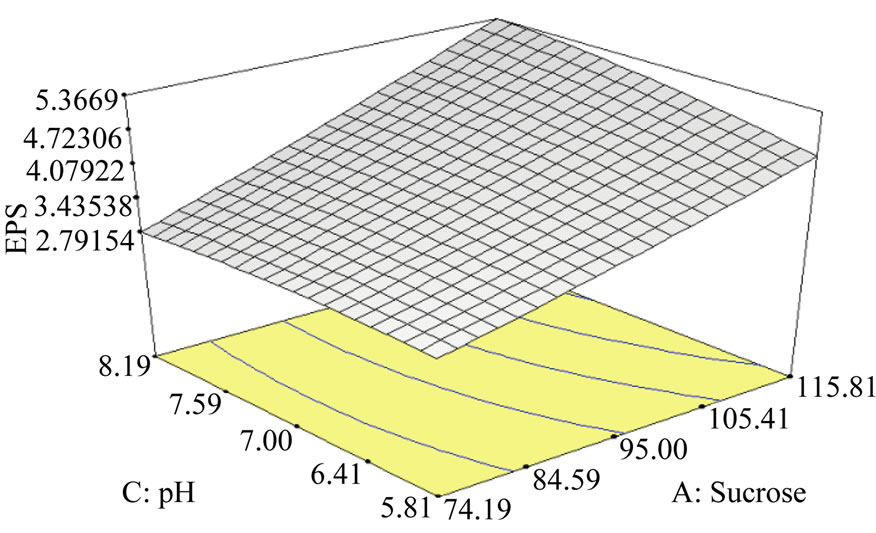 (b)
(b)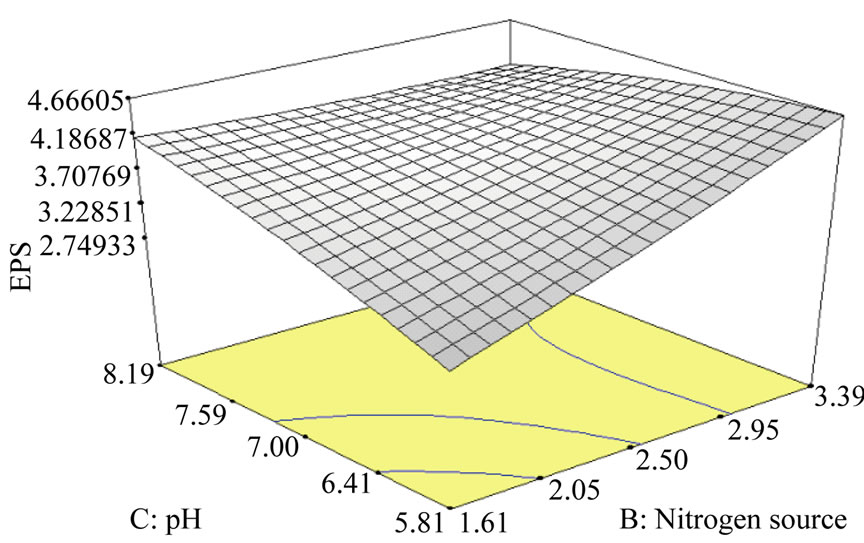 (c)
(c)
Figure 2. Response surface curve (3D plot) of EPS production from Lentinus squarrosulus showing the interaction between (a) Sucrose and yeast extract concentration, (b) Sucrose concentration and pH, (c) Yeast extract concentration and pH.
tract concentration and initial pH on the EPS production. The 3D plots revealed that no significant interaction between A, B and C and only independent variables of A and B increase the EPS production. Maximum EPS production (5.96 mg/mL) was obtained when 130 g/L of sucrose concentration, 2.5 g/L of yeast extract were applied as shown in Table 2.
3.3. Verification of the Optimized Conditions
The statistical model was verified on mycelium biomass and EPS production by applying the optimized components as shown in Table 5. The highest mycelium biomass obtained was 25.8 g/L. The excellent correlation between predicted (25.96 g/L) and measured values justifies the validity of the response model (Eq.2) and the existence of the optimum point for mycelium biomass. Experiments were also carried out to verify the validity and accuracy of the model (Eq.3). EPS production under the optimized condition was 5.7 mg/mL, which was in agreement with the predicted value (5.63 mg/mL) suggesting that the model (Eq.2) was also valid for EPS production. The mycelium biomass and EPS production was 8.24 g/L and 3.56 mg/mL respectively from nonoptimized medium. Under optimized medium, the mycelium biomass had increased up to 25.8 g/L whereas EPS increased to 5.7 mg/mL. Kumari and coworkers [14] reported the maximum production of schizophyllan produced under optimized condition was 8.03 g/L, which in close agreement with the predicted value of 8.06 g/L. Previous research also reported the production of biomass and EPS under optimized condition achieved highest level of biomass and EPS with 9.85 and 4.92 g/L respectively [15].
4. CONCLUSION
In conclusion, maximum growth of mycelium biomass (25.8 g/L) and EPS concentration (5.7 mg/mL) were obtained under optimized condition. The optimized condition for mycelial growth and EPS production was sucrose concentration 114.61 g/L, yeast extract 1.62 g/L and initial pH of 5.81; sucrose concentration 115.8 g/L, yeast extract of 3.39 g/L and initial pH of 6.44 respectively.
5. ACKNOWLEDGEMENTS
This work was performed with financial support from eScience fund
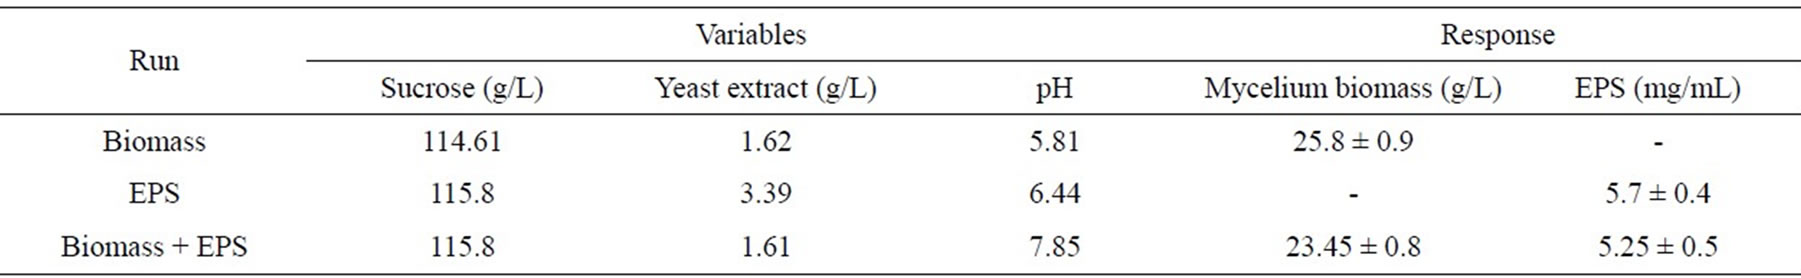
Table 5. Validation of the model with the optimized conditions.
grant (MOSTI), Project No: 02-01-02-SF0978.
REFERENCES
- Sudirman, L.I., Lefebvre, G., Kiffer, E. and Botton, B. (1994) Purification of antibiotics produced by Lentinus squarrosulus and preliminary characterization of a compound active against Rigidoporus lignosus. Current Microbiology, 29, 1-6. http://dx.doi.org/10.1007/BF01570183
- Bhunia, S.K., Dey, B., Maity, K.K., Patra, S., Mandal, S., Maity, S., Maity, T.K., Sikdar, S.R. and Islam, S.S. (2010) Structural characterization of an immunoenhancingheteroglycan isolated from an aqueous extract of an edible mushroom, Lentinus squarrosulus (Mont.) Singer. Carbohydrate Research, 345, 2542-2549. http://dx.doi.org/10.1016/j.carres.2010.09.015
- Bhunia, S.K., Dey, B., Maity, K.K., Patra, S., Mandal, S., Maiti, S., Maiti, T.P., Sikdar, S.R. and Islam, S.S. (2011) Isolation and characterization of an immunoenhancingglucan from alkaline extract of an edible mushroom, Lentinus squarrosulus (Mont.) Singer. Carbohydrate Research, 346, 2039-2044. http://dx.doi.org/10.1016/j.carres.2011.05.029
- Vishwanatha, K., Rao, A. and Singh, S. (2010) Acid protease production by solid-state fermentation using Aspergillusoryzae MTCC 5341: Optimization of process parameters. Journal of Industrial Microbiology and Biotechnology, 37, 129-138. http://dx.doi.org/10.1007/s10295-009-0654-4
- Prapulla, S.G., Jacob, S., Chand, N., Rajalakshmi, D. and Karanth, N.G. (1992) Maximization of lipid production by Rhodotorulagracilis CFR-1 using response surface methodology. Biotechnology and Bioengineering, 40, 965- 969. http://dx.doi.org/10.1002/bit.260400812
- Mao, X.B., Eksriwong, T., Chauvatcharin, S. and Zhong, J.J. (2005) Optimization of carbon source and carbon/nitrogen ratio for cordycepin production by submerged cultivation of medicinal mushroom Cordycepsmilitaris. Process Biochemistry, 40, 1667-1672. http://dx.doi.org/10.1016/j.procbio.2004.06.046
- Baş, D. and Boyaci, İ.H. (2007) Modeling and optimization I: Usability of response resurface methodology. Journal of Food Engineering, 78, 836-845. http://dx.doi.org/10.1016/j.jfoodeng.2005.11.024
- Bezerra, M.A., Santelli, R.E., Oliveira, E.P., Villar, L.S. and Escaleira, L.A. (2008) Response surface methodology (RSM) as a tool for optimization in analytical chemistry. Talanta, 76, 965-977. http://dx.doi.org/10.1016/j.talanta.2008.05.019
- Zheng, Z.M., Hu, Q.L., Hao, J., Xu, F., Guo, N.N., Sun, Y. and Liu, D.H. (2008) Statistical optimization of culture conditions for 1,3-propanediol by Klebsiella pneumonia AC15 via central composite design. Bioresource Technology, 99, 1052-1056. http://dx.doi.org/10.1016/j.biortech.2007.02.038
- Arulkumar, M., Sathishkumar, P. and Palvannan, T. (2001) Optimization of Orange G dye adsorption by activated carbon of Thespesiapopulnea pods using response methodology. Journal of Hazardous Materials, 186, 827- 834. http://dx.doi.org/10.1016/j.jhazmat.2010.11.067
- Tanyildizi, M.Ş. (2011) Modeling of adsorption isotherms and kinetics of reactive dye from aqueous solution by peanut hull. Chemical Engineering Journal, 168, 1234- 1240. http://dx.doi.org/10.1016/j.cej.2011.02.021
- Bae, J.T., Sinha, J., Park, J.P., Song, C.H. and Yun, J.W. (2000) Optimization of submerged culture conditions for exobopolymer production by Paecilomyces japonica. Journal of Microbiology and Biotechnology, 10, 482-487.
- Fournier, E. (2001) Colorimetric quantification of carbohydrates. In: Ronald, E.W., Terry, E.A., Eric, A.D., Michael, H.P., David, S.R., Steven, J.S., Charles, F.S., Denise, M.S. and Peter, S., Eds., Current Protocols in Food Analytical Chemistry, John Wiley & Sons, Inc., New York, E1.1.1-E1.1.8.
- Kumari, M., Survase, S.A. and Rekha, S.S. (2008) Production of schizophyllan using Schizophyllum commune NRCM. Bioresource Technology, 99, 1036-1043. http://dx.doi.org/10.1016/j.biortech.2007.02.029
- Kim, H.H., Na, J.G., Chang, Y.K., Chun, G.T., Lee, S.J. and Jeong, Y.H. (2004) Optimization of submerged culture conditions for mycelial growth and exopolysaccharides production by Agaricusblazei. Journal of Microbiology and Biotechnology, 14, 944-951.
NOTES
*Corresponding author.