Advances in Bioscience and Biotechnology
Vol.4 No.3A(2013), Article ID:29304,10 pages DOI:10.4236/abb.2013.43A063
Effect of cra gene mutation on the metabolism of Escherichia coli for a mixture of multiple carbon sources*
![]()
1Department of Bioscience and Bioinformatics, Kyushu Institute of Technology, Iizuka, Japan
2Institute of Advanced Bioscience, Keio University, Tsuruoka, Japan
Email: #shimi@bio.kyutech.ac.jp
Received 6 January 2013; revised 14 February 2013; accepted 26 February 2013
Keywords: Escherichia coli; cra Mutant; Catabolite Regulation
ABSTRACT
The major player for catabolite repression is the phosphotransferase systems (PTSs) and cAMP-Crp. Moreover, Cra controls the carbon flow in the metabolic network. In the present research, the effect of modulating cra gene (Δcra) on the consumption of multiple carbon sources such as glucose and fructose (as well as xylose) was investigated under both aerobic and anaerobic conditions. It was shown that glucose and fructose could be co-metabolized with fructose consumed faster than glucose in cra mutant under both aerobic and anaerobic conditions. It was also implied that cra mutant consumed higher amount of total carbon sources, which contributed to the highest metabolite production as compared to the wild type strain. Thus, cra mutant can be a good candidate for the efficient utilization of multiple carbon sources such as glucose and fructose, where xylose consumption was repressed by catabolite repression. The overall regulation mechanisms were clarified based on fermentation data and gene transcript analysis.
1. INTRODUCTION
It is quite important to understand how the culture environment affects the cell metabolism. Among the culture environments, carbon sources are by far important in practice. In particular, carbon catabolite regulation has been paid recent attention [1,2], where most bacteria selectively consume substrates from a mixture of different carbon sources, and exhibit diauxic growth.
Namely, most organisms consume glucose prior to consumption of other carbon sources. From the practical application point of view of utilizing lignocellulose or food waste etc. for the production of biochemicals and biofuels etc., it is strongly desirable to understand the catabolite regulation mechanism and modulate the specific genes for the efficient utilization of multiple carbon sources obtained by hydrolysis of such materials [3].
In the catabolite regulation, cAMP-Crp complex plays an important role. The center for this regulatory network is the phosphoenolpyruvate (PEP): carbohydrate phosphotransferase systems (PTSs). These systems are involved in both transport and phosphorylation of carbohydrates for the efficient assimilation of the available carbon sources. The PTS in E. coli consists of two cytoplasmic proteins such as EI (enzyme I) and HPr (histidine-containing protein), as well as carbohydrate-specific EII (enzyme II) complexes. When glucose is present, the phosphate of PEP is transferred via EI, HPr, and EIIAGlc each encoded by ptsI, ptsH, and crr, respectively, and then the phosphate of the phosphorylated EIIAGlc (EIIAGlc-P) is transferred to EIIBCGlc encoded by ptsG, and unphosphorylated EIIAGlc becomes dominant, where the unphosphorylated EIIAGlc inhibits the uptake of other non-PTS carbohydrates by the so-called inducer exclusion. Upon glucose depletion, the concentration of EIIAGlc-P increases, which in turn activates the adenylate cyclase (Cya), and leads to an increase in the intracellular cAMP level. Then cAMP combines with Crp forming cAMP-Crp complex, and activates the transport genes for other carbon sources than glucose together with the modulation of the metabolic pathway genes [4-7].
Several attempts have been made for the simultaneous consumption of multiple carbon sources by such catabolite repression mutants as ethanologenic ptsG mutant E. coli [8,9], lactate producing ptsG mutant E. coli [10], ethanol producing mgsA mutant E. coli [11], where all of these attempted to modulate carbon catabolite regulation by inhibiting or repressing PTS, thus increasing EIIAGlc-P concentration in the cytosol. Although simultaneous consumption of multiple carbon sources can be made by such strains, the glucose consumption rate becomes low due to low activity of EIIBCGlc, and utilization of other less efficient transporters such as MglBCA, GalP etc. followed by the phosphorylation of the intracellular glucose by glucokinase (Glk) using ATP to produce G6P. In order to increase the glucose consumption rate, it has been reported to enhance gal regulon and glk genes [12], but it is not straightforward since Glk requires ATP unlike PTS.
In addition to cAMP-Crp, another global regulator Cra (catabolite repressor/activator), initially characterized as the fructose repressor (FruR), controls the carbon flow in E. coli [13,14]. Its control mechanism is cAMP-independent [15,16], where Cra represses the expressions of such genes as ptsHI, pfkA, pykF, zwf, edd, eda, acnB, while it activates fbp, ppsA, pckA, aceA, icdA, and acnA [14, 17,18] (Appendix A). The set of such genes implies that Cra activates the gluconeogenic pathway genes and represses the glycolysis genes. With this in mind, we attempted to enhance the glucose consumption rate by cra gene knockout E. coli [19], where it was shown that acetate was more produced due to repression of TCA cycle and glyoxylate pathway. In the present investigation, we investigated the effect of cra gene knockout on the fermentation characteristics for the case of multiple carbon sources such as glucose and fructose (as well as xylose).
In this research, the main focus is to reveal the metabolic and gene regulatory mechanism of how cra mutant (Δcra) uptake multiple carbon sources of glucose, fructose (as well as xylose) under aerobic and anaerobic conditions, based on fermentation data, and gene transcript levels.
2. MATERIALS AND METHODS
2.1. Strains Used and Media Composition
The strains used were E. coli BW25113 (F− λ− rph−1 ΔaraBADAH33 lacIq ΔlacZWJ16 rrnBT14 ΔrhaBADLD78 hsdR514) and its single gene knockout mutant lacking cra (JW0078), which was obtained from Keio collection [20]. All the strains were first precultured in the Luria-Bertani (LB) medium. The second preculture and the main culture were carried out using M9 synthetic medium containing the following components (per liter): 6.81 g Na2HPO4, 2.99 g KH2PO4, 0.58 g NaCl and 5.94 g (NH4)2SO4. The carbon source was a mixture of glucose, fructose, and xylose each contained 5 g/l, or some of the combinations among them for the batch and continuous culture. The following components were filter sterilized and then added (per liter) with 1 ml of 1 M MgSO4·7H2O, 1 ml of 0.1 mM CaCl2·2H2O, 1 ml of 1 mg/L thiamine HCl and 10 ml of trace element solution containing (per liter): 0.55 g CaCl2·2H2O, 1.67 g FeCl3·6H2O, 0.1 g MnCl2·4H2O, 0.17 g ZnCl2·2H2O, 0.043 g CuCl2·2H2O, 0.06 g CoCl2·2H2O, and 0.06 g Na2MOO4·2H2O.
2.2. Culture Conditions
The first pre-cultivation was performed by transferring 0.1 ml glycerol stock to a 10 ml L tube. After 8 h cultivation, the second pre-cultivation was performed by transferring 1 ml of culture broth to a 100 ml T tube. Batch and continuous cultures were conducted in a 2-l fermentor (Venus 25, Biott Co.) with a working volume of 1 l. The pH was controlled at 7.0 ± 0.1 using 2 N HCl or 2 N NaOH, and the temperature was set at 37˚C. The air flow rate was 1 vvm (air volume/working volume/ min), and the agitation speed was 400 rpm to maintain the dissolved oxygen concentration to be at 35% - 40% (v/v) of air saturation for the case of aerobic cultivation [21]. In the case of anaerobic condition, aeration was stopped and the agitation speed was reduced to 100 rpm. The dilution rate in the continuous culture was 0.1 h−1. The triplicate samples were collected at the steady state which was confirmed by the constant cell density. It generally took 3 - 4 residence times to achieve the steady state.
2.3. Analytical Method
Bacterial growth was monitored by measuring the optical density of the culture broth at 600 nm (OD600) using a spectrophotometer (Ubet-30, Jasco, Tokyo, Japan). After fermentation, E. coli cells from 200 ml of culture were harvested by centrifugation and dried. After confirming that the weight of the dried material was constant, the dry cell weight per liter of culture was calculated from the measured weight. It was then converted to dry cell weight (DCW) based on the OD600-DCW relationship. Glucose, fructose, xylose, lactate, acetate, formate, and ethanol concentrations in the medium were measured using commercially available kits (Wako Co., Osaka, Japan for glucose, fructose and xylose; Roche, Molecular Biochemical, Mannheim, Germany for others).
2.4. RNA Preparation
Total RNA was isolated from E. coli cells by Qiagen RNeasy Mini Kit (QIAGEN K.K., Tokyo, Japan) according to the manufacture’s recommendation. The quantity and purity of RNA were determined by the optical density measurements at 260 and 280 nm and by 1% formaldehyde agarose gel electrophoresis. The primer sequences for respective genes used in this study were reported elsewhere [22]. Criteria for the design of the gene-specific primer pairs were followed according to Sambrook and Russel [23]. The primers used in this study were synthesized at Hokkaido System Science Co. (Sapporo, Japan). In all cases, the primer-supplied company confirmed the purity and absolute specificity of the primers.
2.5. cDNA Synthesis and PCR Amplification
RT-PCR reactions were carried out in a Takara PCR Thermal Cycler (Takara TP240, Japan) using Qiagen one-step RT-PCR Kit (QIAGEN K.K., Japan). The reaction mixture was incubated for 30 min at 50˚C for reverse transcription (cDNA synthesis) followed by 15 min incubation at 95˚C for initial PCR activation. Then, the process was subjected to 30 cycles of amplification which consisted of a denaturing step (94˚C for 1 min), an annealing step (approximately 5˚C below melting temperature of primers for 1 min) and an extension step (72˚C for 1 min), and finally the reaction mixture was incubated for 10 min at 72˚C for final extension. To check for nucleic acid contamination, one negative control was run in every round of RT-PCR. This control lacks the template RNA in order to detect possible contamination of the reaction components. 5 ml of amplified products were run on a 1% agarose gel. Gels were stained with 1 μg/ml of ethidium bromide, photographed using a Digital Image Stocker (DS-30, FAS III, Toyobo, Osaka, Japan) under UV light and analyzed using GelPro Analyzer 3.1 (Toyobo) software. Although the PCR products obtained for all the genes showed the predicted sizes on agarose gel, the identity of amplified fragments of some genes was demonstrated by DNA sequencing. In order to determine the optimal amount of input RNA, the two-fold diluted template RNA was amplified in RTPCR assays under identical reaction conditions to construct a standard curve for each gene product. When the optimal amount of input RNA was determined for each gene product, RT-PCR was carried out under identical reaction conditions to detect differential transcript levels of genes. The gene dnaA, which encodes DnaA, a replication initiation factor in E. coli and is not subjected to variable expression, i.e. abundant expression at relatively constant rate in most cells, was used as an internal control for the RT-PCR determinations. To calculate the standard deviation, RT-PCR was independently performed three times for each gene under identical reaction condition. To ensure that the observed changes were statistically significant, the measurements were made in triplicate, and the Student’s t-test was applied.
3. RESULTS
3.1. Batch Fermentation Characteristics under Aerobic Condition
Figure 1(a) shows the batch cultivation result of wild type E. coli under aerobic condition for the case of using a mixture of glucose and fructose as a carbon source, while Figure 1(b) shows the case of the wild type using a mixture of glucose and xylose as a carbon source. As can be seen from the figure, glucose was first consumed, while fructose or xylose was consumed after glucose was depleted. This is due to the catabolite repression caused by the low level of cAMP or cAMP-Crp when glucose was present.
Figure 1(c) shows the aerobic batch cultivation result of cra mutant for the case of using a mixture of glucose and fructose as a carbon source, where it indicates an interesting phenomenon that both glucose and fructose were consumed simultaneously with fructose to be consumed a little faster as compared to glucose. Figure 1(c) shows, however, that acetate was more produced and less consumed after glucose was depleted as compared to the wild type (Figure 1(a)). This may be due to the repressions of aceA and icdA gene expressions caused by cra gene knockout, while pfkA and pykF gene expressions were activated by cra gene knockout [19].
Figure 2 shows the batch aerobic cultivation result of the wild type (Figure 2(a)) and cra mutant (Figure 2(b)) for the case of using a mixture of glucose, fructose, and xylose as a carbon source. Figure 2(a) shows that fructose and xylose were both consumed after glucose was depleted due to catabolite repression in the wild type. Figure 2(b) indicates that fructose and glucose were consumed simultaneously with fructose to be consumed faster than glucose as also observed in Figure 1(c), whereas xylose was consumed after glucose was depleted, where the latter phenomenon may be considered to be due to the catabolite repression by the lower level of cAMP-Crp in cra mutant.
3.2. Batch Fermentation Characteristics under Anaerobic Condition
Figure 3 shows the batch anaerobic cultivation results of the wild type (Figure 3(a)), and cra mutant (Figure 3(b)) for the case of using a mixture of glucose, fructose, and x-ylose as a carbon source. Figure 3(a) shows that after glucose was depleted, fructose and xylose were consumed, and that xylose was little consumed, where the latter phenomenon is different from the case of aerobic condition (Figure 2(a)). The fermentation products were formed in the order of formate, acetate, ethanol, as well as a little lactate, where the biomass formation was mainly made during the period when glucose and fructose were used as carbon sources. In the case of cra mutant as shown in Figure 3(b), fructose and glucose were first consumed where fructose was consumed faster as compared to glucose, which was also observed under aerobic condition (Figure 2(b)), and xylose was little consumed as also observed above for the wild type. The metabolite formation patterns were nearly the same as the case of the wild type (Figure 3(a)).
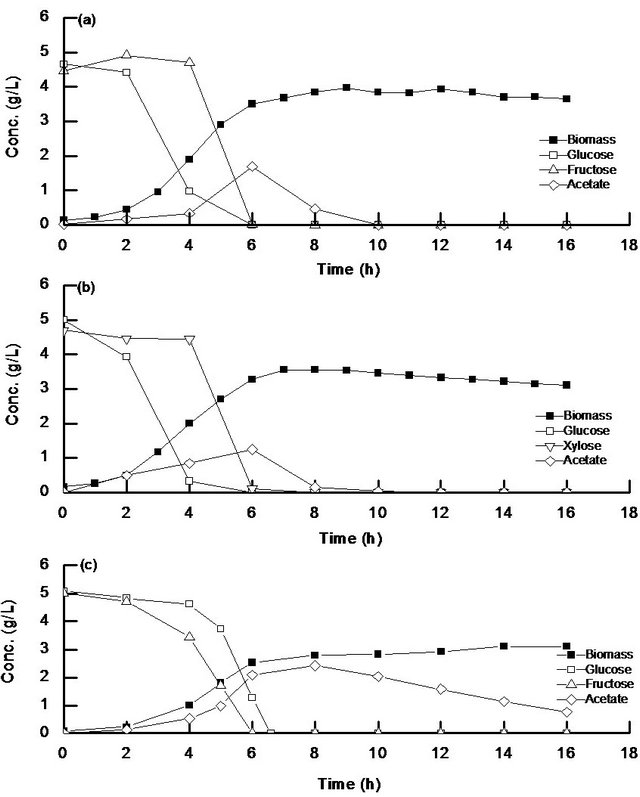
Figure 1. Batch aerobic cultivation result of (a) wild type using a mixture of glucose and fructose; (b) wild type using a mixture of glucose and xylose; (c) cra mutant using a mixture of glucose and fructose as a carbon source.
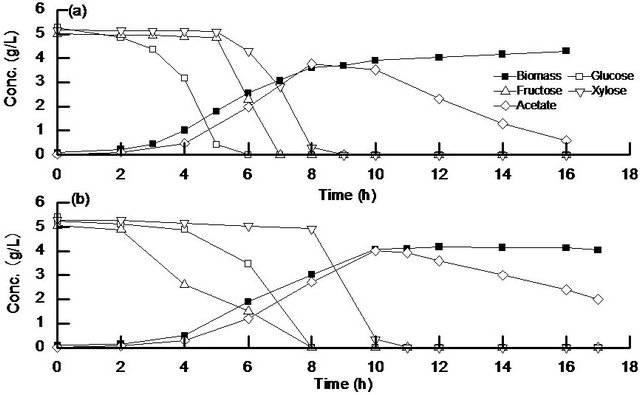
Figure 2. Batch aerobic cultivation result of (a) wild type; (b) cra mutant using a mixture of glucose, fructose, and xylose as a carbon source.
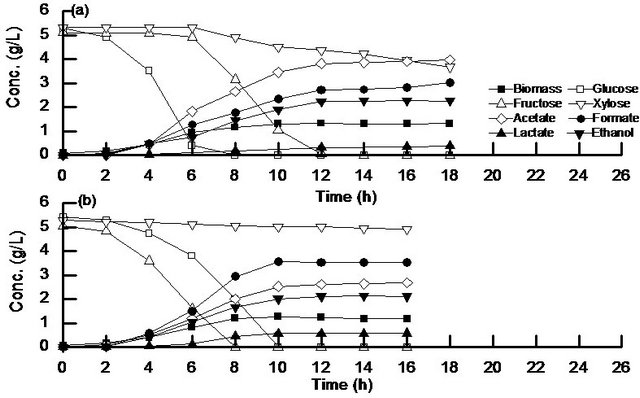
Figure 3. Batch anaerobic cultivation result of (a) wild type; (b) cra mutant using a mixture of glucose, fructose, and xylose as a carbon source.
3.3. Continuous Fermentation Characteristics under Anaerobic Condition
In order to investigate these phenomena in particular under anaerobic condition in more detail, the anaerobic continuous cultures of the wild type and cra mutant, were performed at the dilution rate of 0.1 h−1 using a mixture of glucose, fructose, and xylose as a carbon source (Table 1). Glucose concentration was below detectable level, and the fructose concentration was less than xylose concentration for the wild type, consistent with the batch cultivation result (Figure 3(a)). On the other hand, fructose concentration was below detectable level, while glucose concentration was lower as compared to xylose concentration for cra mutant, consistent with the batch cultivation result (Figure 3(b)).
Figure 4 shows the comparison of the specific total carbon source consumption rates together with specific metabolite production rates obtained based on Table 1. It may be of practical interest that total carbon source consumption rate was higher for cra mutant as compared to the wild type. This contributes to the increase in the total metabolite production rate (Figure 4), which is attractive from the efficient metabolites production point of view.
3.4. Gene Transcript Levels for Continuous Fermentation Characteristics
Figure 5 shows the comparison of gene transcript levels for the case of continuous cultures as shown in Table 1. Figure 5 indicates that fruBKA as well as manX and mtlA genes were up-regulated in cra mutant as compared to the wild type (P < 0.01 for all these genes). In accordance with the global regulator-metabolic pathway genes relationship (Appendix A), the transcript levels of glycolysis genes such as pfkA, pykF, PP pathway genes such as edd and eda, together with anaplerotic pathway gene ppc, were all up-regulated (P < 0.01, P < 0.05, P < 0.01, P < 0.01, P < 0.01, and P < 0.01, respectively), while gluconeogenic pathway genes such as pckA, ppsA, fbp, and glyxoyalte pathway gene aceA, as well as the TCA cycle gene icdA were all down-regulated (P < 0.01 for all genes) for the cra mutant as compared to the wild type. The down-regulation of ptsG transcript level (P < 0.01) may be due to down-regulation of crp (P < 0.01) (Appendix A). The down regulation of aceA transcript level (P < 0.01) is also consistent with up-regulation of iclR (P < 0.01). The down-regulation of crp gene transcript level may be due to higher glucose concentration for cra mutant as compared to the wild type (Table 1). The xylose assimilating pathway genes such as xylR, xylFGH, xylAB, and xylE were all down regulated (P < 0.01 for all genes). Moreover, in accordance with higher production rate of acetate (Table 1), pta and ackA genes were up-regulated (P < 0.01 for both genes), and in accordance with higher ethanol production rate, adhE gene transcript level was up-regulated (P < 0.01) for cra mutant as compared to the wild type. The pflA gene transcript level was increased (P < 0.01), which corresponds to the higher production rate of formate (Table 1). Note that rpoS transcript level was decreased (P < 0.01) for cra mutant as compared to the wild type, which might be due to higher glucose concentration, and this also corresponds to the down regulations of acnA and fumC, but not acnB gene transcript level [21] (Appendix A).
4. DISCUSSION
Figure 6 shows the interaction between glucose PTS and fructose PTS for the phosphate transfer, and the xy-lose metabolism. It has been known that fructose is transported by a fructose-specific PTS, and it has been shown that Adenylate cyclase is also regulated by fructose as well as EIIAGlc [24]. The fruBKA operon that contains
Table 1. Anaerobic continuous fermentation characteristics of E. coli BW25113 and its Δcra mutant for the case of using a mixture of glucose, fructose, and xylose as a carbon source at the dilution rate of 0.1 h−1. (a) Concentration; (b) The specific rates.
(a)
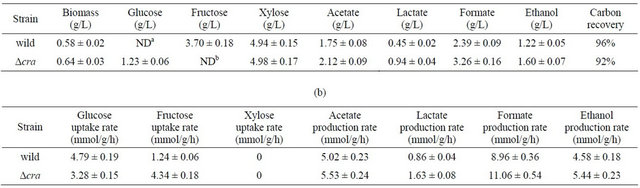
NDa: Not detectable, where glucose detectable limit was 0.038 g/l; NDb: Not detectable, where fructose detectable limit was 0.004 g/l.

Figure 4. The specific total carbon source consumption rates and specific metabolites production rates for the wild type and cra mutant for the continuous culture at the dilution rate of 0.1 h−1 for the case of using a mixture of glucose, fructose, and xylose as a carbon source, where the total carbon source consumption rates are shown as positive values, while the specific metabolite production rates are shown as negative values.
fruB encoding FruB (diphosphoryl transfer protein), fruK encoding fructose 1-phosphate kinase, and fruA encoding the fructose-specific enzyme EIIB’BC [25], is negatively controlled by Cra. Note also that other two fructose transporter genes manXYZ and mtlA are also negatively controlled by Cra [14,26,27]. Moreover, there exists a Crp binding site within the regulatory region of the fructose operon that has been shown to be positively regulated by the cAMP-Crp complex [26], and the fructose up-take is primary under control of cAMP-Crp.
Figure 7 shows the overall regulation mechanism for the case of cra mutant, where it shows how cra gene knockout affected the global regulators and metabolic pathway genes, and in turn fermentation characteristics under anaerobic condition based on the results of Table 1 and Figure 5, as well as the global regulator-metabolic pathway genes relationship as given in Appendix A.
As implied by the transcript level of cyaA in Figure 5, the cAMP level may be low, and the adenylate cyclase activity was also lower, while the expression levels of fruBKA were higher in cra mutant. This indicates that FruB may not substitute for EIIAGlc as an activator of adenylate cyclase [24]. It might be considered that cra mutant less phosphorylates EIIAGlc than the wild type [24] with higher gene expression level of fruB and lower level of crr. If this was the case, inducer exclusion should occur in cra mutant, and prevent xylose entry by interacting with xylose permease. The reason why EI-IAGlc-P is dephosphorylated in cra mutant grown on fructose may not be due to lower PEP level, but this may be due to competition between FPr and HPr for the phosphate of the phosphorylated EI [24], where FPr is encoded by fruB. EIIAFru is more phosphorylated in cra mutant, preventing EIIAGlc to be phosphorylated. Cra mediated adenylate cyclase activity indirectly by fru operon. Namely, when the cells are grown on fructose, the Cra activity decreases due to higher FBP concentration, and the transcription of fru operon as well as glycolysis genes are activated, but not PTS genes for glucose uptake. In cra mutant, this is more eminent, and the activated fru operon prevents the phosphorylation of EIIAGlc more effectively. It may be also considered that the fru operon and the lower levels of ptsG, H, and crr caused the glucose consumption rate to be decreased in cra mutant as compared to the wild type (Figure 5, Table 1). In summary, fructose and xylose transporters were under control of cAMP-Crp as implied by Figures 2(a) and 3(a), while fructose consumption was faster as compared to glucose for cra mutant as shown by Figures 2(b) and 3(b). This may be due to the fact that the glucose PTS genes were repressed, while the transcript levels of the glycolysis genes such as pfkA and pykF were up-regulated (Figure 5) as stated.
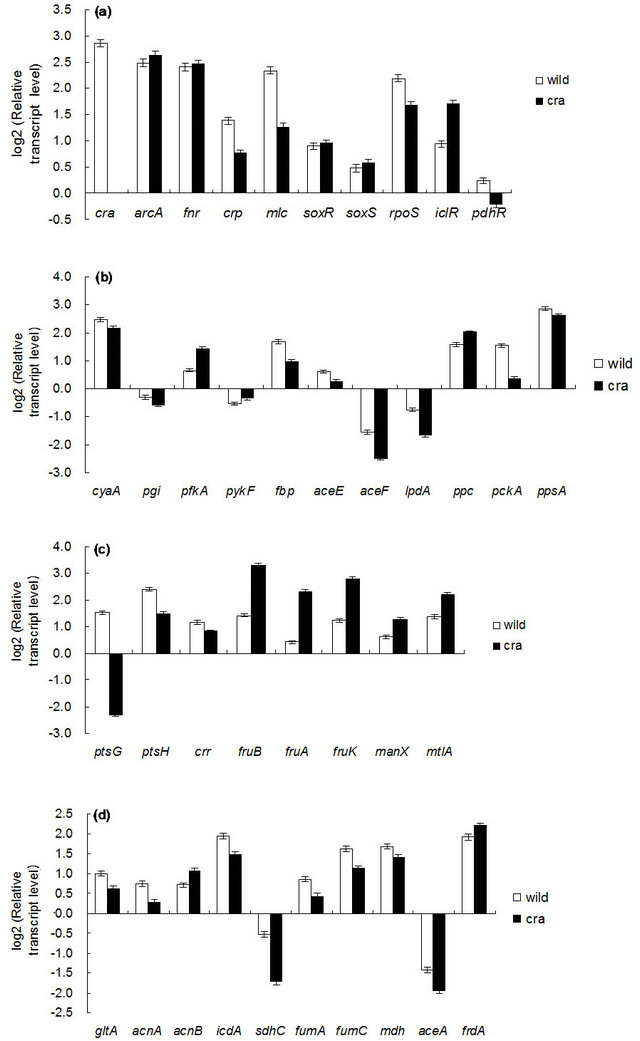
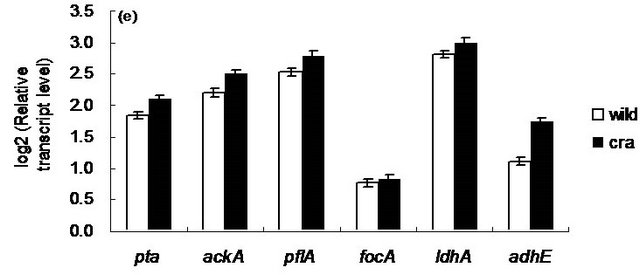
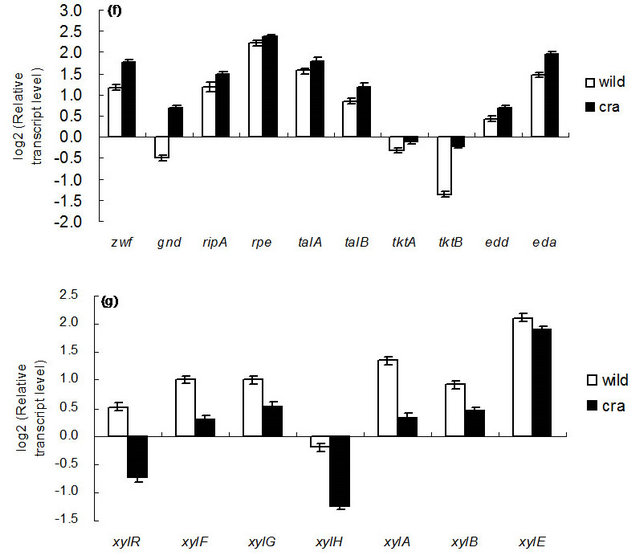
Figure 5. Gene transcript levels of wild type and cra mutant. (a) Global regulator genes; (b) cyaA, glycolysis, glucoenogenesis, anaplerotic pathway genes; (c) PTS genes; (d) TCA and glyoxylate pathway genes; (e) Fermentation pathway genes; f PP pathway genes; (g) Xylose operons.
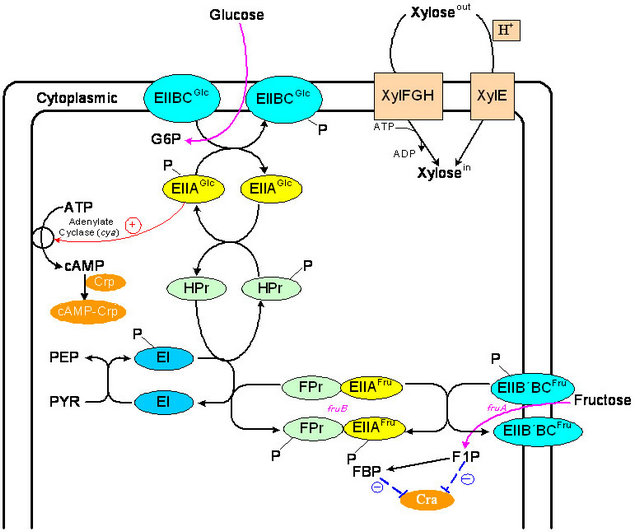
Figure 6. The interactions among glucose PTS, fructose PTS and xylose metabolism.
Note that Figure 5 shows manX and mtlA transcript levels were higher for cra mutant as compared to the wild type strain. As stated before, FPr competes with HPr for the phosphoate of phorylated EI, where the phosphorylated HPr not only transfers phosphoryl moiety to EIIAGlc but also EIIAMan and EIIAMtl, where the latter contributes to the fructose transport through mannose and mannitol PTSs [28]. This may be another possible reason why fructose consumption was faster as compared to glucose in cra mutant.
In summary, the cra knockout mutant co-cosumes glucose and fructose with fructose to be consumed faster
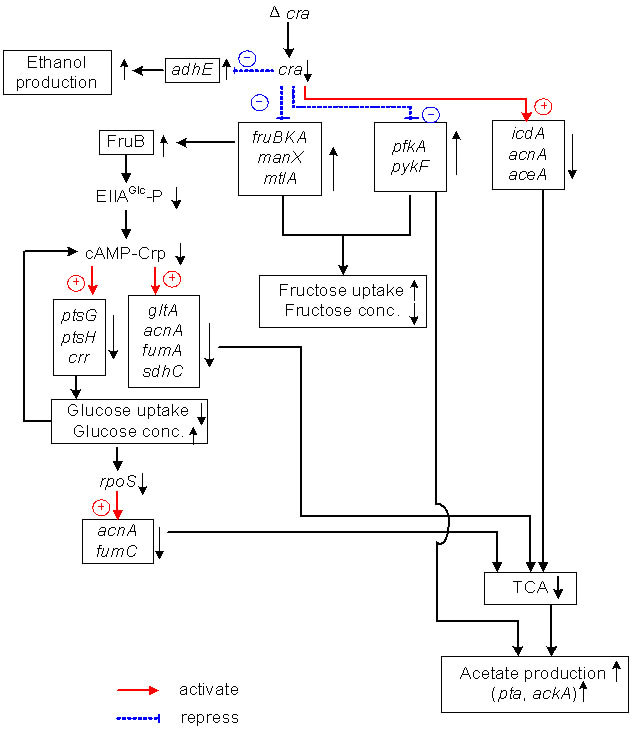
Figure 7. The overall regulation of cra mutant.
than glucose. The total carbon source consumption rate is higher for cra mutant as compared to the wild type. It is important to understand the metabolic regulation mechanism in the form of global regulators-metabolic pathway genes relationship for the proper analysis of the fermentation data.
5. ACKNOWLEDGEMENTS
This research was supported by Strategic International Cooperative Program, Japan Science and Technology Agency (JST). It is also acknowledged to Mr. Yoshitaro Heshiki who helped doing experiment on batch culture using a mixture of glucose and fructose.
REFERENCES
- Görke, B. and Stülke, J. (2008) Carbon catabolite repression in bacteria: Many ways to make the most out of nutrients. Nature Reviews Microbiology, 6, 613-624. doi:10.1038/nrmicro1932
- Kim, J.H., Block, D.E. and Mills, D.A. (2010) Simultaneous consumption of pentose and hexose sugars: An optimal microbial phenotype for efficient fermentation of lignocellulosic biomass. Applied Microbiology and Biotechnology, 88, 1077-1085. doi:10.1007/s00253-010-2839-1
- Zaldivar, J., Nielsen, J. and Olsson, J. (2011) Fuel ethanol production from lignocellulose: Challenge for metabolic engineering and process integration. Applied Microbiology and Biotechnology, 56, 17-34. doi:10.1007/s002530100624
- Bettenbrock, K., Fischer, S., Kremling, A., Jahreis, K. and Sauter, T. (2006) A quantitative approach to catabolite repression in Escherichia coli. The Journal of Bilogical Chemistry, 281, 2578-2584.
- Kremling, A. and Gilles, E.D. (2001) The organization of metabolic reaction networks: II. Signal processing in hierarchical structured functional units. Metabolic Engineering, 3, 138-150. doi:10.1006/mben.2000.0175
- Kremling, A., Fischer, S., Sauter, T., Bettenbrock, K. and Gilles, E.D. (2004) Time hierarchies in the Escherichia coli carbohydrate uptake and metabolism. Biosystems, 73, 57-71. doi:10.1016/j.biosystems.2003.09.001
- Nishio, Y., Usuda, Y., Matsui, K. and Kurata, H. (2008) Computer-aided rational design of the phosphotransferase system for enhanced glucose uptake in Escherichia coli. Molecular Systems Biology, 4, 160.
- Nichols, N.N., Dien, B.S. and Bothast, R.J. (2001) Use of catabolite repression mutants for fermentation of sugar mixtures to ethanol. Applied Microbiology and Biotechnology, 56, 120-125. doi:10.1007/s002530100628
- Hernández-Montalvo, V., Valle, F., Bolivar, F. and Gosset, G. (2001) Characterization of sugar mixtures utilization by an Escherichia coli mutant devoid of the phosphotransferase system. Applied Microbiology and Biotechnology, 57, 186-191. doi:10.1007/s002530100752
- Dien, B.S., Nichols, N.N. and Bothast R.J. (2002) Fermentation of sugar mixtures using Escherichia coli catabolite repression mutants engineered for production of L-lactic acid. Journal of Industrial Microbiology and Biotechnology, 29, 221-227. doi:10.1038/sj.jim.7000299
- Yamano, L.P., York, S.W., Shanmugam, K.T. and Ingram, L.O. (2009) Deletion of methylglyoxal synthase gene (mgsA) increased sugar co-metabolism in ethanolproducing Escherichia coli. Biotechnology Letters, 31, 1389- 1398. doi:10.1007/s10529-009-0011-8
- Flores, N., Flores, S., Escalante, A., de Anda, R., Leal, L., Malpica, R., Georgellis, D., Gosset, G. and Bolívar, F. (2005) Adaptation for fast growth on glucose by differential expression of central carbon metabolism and gal regulon genes in an Escherichia coli strain lacking the phosphoenolpyruvate: Carbohydrate phosphotransferase system. Metabolic Engineering, 7, 70-87. doi:10.1016/j.ymben.2004.10.002
- Moat, A.G., Foster, J.W. and Spector, M.P. (2002) Microbial physiology. 4th Edition, Cold John Wiley & Sons, New York. doi:10.1002/0471223867
- Saier Jr., M.H. and Ramseier, T.M. (1996) The catabolite repressor/activator (Cra) protein of enteric bacteria. Journal of Molecular Microbiology and Biotechnology, 178, 3411-3417.
- Dessein, A., Schwartz, M. and Ullmann, A. (1978) Catabolite repression in Escherichia coli mutants lacking cyclic AMP. Molecular Genomics and Genetics, 162, 83-87. doi:10.1007/BF00333853
- Guidi-Rotani, C., Danchin, A. and Ullmann, A. (1980) Catabolite repression in Escherichia coli mutants lacking cyclic AMP receptor protein. Proceedings of the National Academy of Sciences, 77, 5799-5801. doi:10.1073/pnas.77.10.5799
- Perrenoud, A. and Sauer, U. (2005) Impact of global transcriptional regulation by ArcA, ArcB, Cra, Crp, Cya, Fnr, and Mlc on glucose catabolism in Escherichia coli. Journal of Bacteriology, 187, 3171-3179. doi:10.1128/JB.187.9.3171-3179.2005
- Nachen, A., Schicker, A., Revelles, O. and Sauer, U. (2008) Cyclic AMP-dependent catabolite repression is the dominant control mechanism of metabolic fluxes under glucose limitation in Escherichia coli. Journal of Biotechnology, 190, 2323-2330. doi:10.1128/JB.01353-07
- Sarkar, D. and Shimizu, K. (2008) Effect of cra gene knockout together with other genes knockouts on the improvement of substrate consumption rate in Escherichia coli under microaerobic condition. Biochemical Engineering Journal, 42, 224-228. doi:10.1016/j.bej.2008.06.019
- Baba, T., Ara, T., Hasegawa, M., Takai, Y., Okumura, Y., Baba, M., Datsenko, K.A., Tomita, M., Wanner, B.L. and Mori, H. (2006) Construction of Escherichia coli K-12 inframe, single gene knockout mutants: The Keio collection. Molecular Systems Biology, 2, 2006-0008. doi:10.1038/msb4100050
- Rahman, M., Hassan, M.R. and Shimizu, K. (2008) Growth phase-dependent changes in the expression of global regulatory genes and associated metabolic pathways in Escherichia coli. Biotechnology Letters, 30, 853-860. doi:10.1007/s10529-007-9621-1
- Kabir, M.D. and Shimizu, K. (2003) Gene expression patterns for metabolic pathway in pgi knockout Escherichia coli with and without phb genes based on RT-PCR. Journal of Biotechnology, 105, 11-31. doi:10.1016/S0168-1656(03)00170-6
- Sambrook, J. and Russell, D.W. (2001) Molecular cloning: A laboratory manual. 3rd Edition, Cold Spring Harbor Laboratory Press, New York.
- Crasnier-Mednansky, M., Park, M.C., Studley, W.K. and Saier Jr., M.H. (1997) Cra-mediated regulation of Escherichia coli adenylate cyclase. Microbiology, 143, 785-792. doi:10.1099/00221287-143-3-785
- Reizer, J., Reizer, A., Kornberg, H.L. and Saier Jr., M.H. (1994) Sequence of the fruB gene of Escherichia coli encoding the diphosphoryl transfer protein (DTP) of the phosphoenolpyruvate: Sugar phosphotransferase system. FEMS Microbiology Letters, 118, 159-162. doi:10.1111/j.1574-6968.1994.tb06819.x
- Feldheim, D.A., Chin, A.M., Nierva, C.T., Feucht, B.U., Cao, Y.W., Xu, Y.F., Sutrina, S.L. and Saier Jr., M.H. (1990) Physiological consequences of the complete loss of phosphoryl-transfer proteins HPr and FPr of the phosphoenolpyruvate: Sugar phosphotransferase system and analysis of fructose (fru) operon expression in Sallmonella typhimurium. Journal of Bacteriology, 172, 5459-5469.
- Chin, A.M., Feldheim, D.A. and Saier Jr., M.H. (1989) Altered transcriptional patterns affecting several metabolic pathways in strains of Salmonella typhimurium which over-express the fructose regulon. Journal of Bacteriology, 171, 2424-2434.
- Kornberg, H.L. (2001) Routes for fructose utilization by Escherichia coli. Journal of Molecular Microbiology and Biotechnology, 3, 355-359.
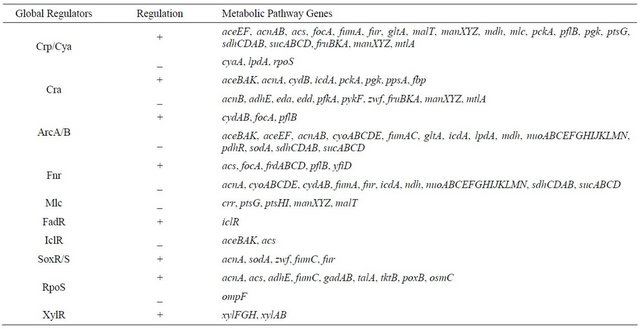
APPENDIX
A Global regulators and their regulated genes.
NOTES
*Special Issue on E. coli theories and Perspective.
#Corresponding author.