Modern Economy
Vol.06 No.06(2015), Article ID:57462,11 pages
10.4236/me.2015.66070
Research on Virtual Water in the Chinese International Grain Trade
Xiujuan Wang1,2, Jilian Hu1*
1School of Economics and Management, Shandong Agricultural University, Tai’an, China
2College of Foreign Languages, Shandong Agricultural University, Tai’an, China
Email: xjw9007@126.com, *jlhu@sdau.edu.cn
Copyright © 2015 by authors and Scientific Research Publishing Inc.
This work is licensed under the Creative Commons Attribution International License (CC BY).
http://creativecommons.org/licenses/by/4.0/


Received 20 May 2015; accepted 23 June 2015; published 26 June 2015
ABSTRACT
Focusing on virtual water in the international grain trade, this paper calculates the virtual water volume embodied in the international grain trade (mainly rice, wheat, corn and soybean) from 1990 to 2012 in China. By doing so, this paper tries to evaluate the contribution of virtual water in trade grains to the agricultural water use in China and its effect on global water resources. The results reveal that the Chinese grain trade and the virtual water trade have maintained a significant deficit over 23 years and that there is a significant negative correlation between the volumes of imported virtual water and water used for agriculture. Each unit of imported virtual water can reduce agriculture water use by 0.306 units; the water saving effect brought by the international crop trade and the grain trade gap are not synchronous. As a result, we present our proposals for enhancing efficient allocation of water resources and maintaining a sustainable ecological development of the environment.
Keywords:
Virtual Water, Grain Trade, Water Resources, Efficient Allocation

1. Introduction
Grain security and water resource security are major issues concerning people’s livelihood [1] . Having the world’s largest population and the second largest national economy, China’s water shortages could influence the global grain security and threaten global prosperity [1] - [4] . As the World Bank noted in 2020’s China, whether China can support itself not only affects the country itself, but also is critical on a global level. China is responsible for a large share of the global grain production and consumption, and a tiny change in trade volume caused by market fluctuations or price changes will affect the entire world. Water is one of the basic elements in agricultural production and the water shortage in recent years has become a major bottleneck restricting the sustainable development of our country. Water consumption directly affects the development of agriculture, industry and the social economy as a whole. As the main form of water resource consumption, grain production represents a large amount of virtual water. With the further development of economy and society, the total demand for water is increasing, causing the discrepancy between water resources supply and demand to become increasingly prominent.
The concept of “virtual water (VW)” was first put forward by Professor Tony Allan [5] [6] of London University. Virtual water refers to water embodied in goods and services traded between regions or countries, especially from water sufficient regions to poor regions [7] -[9] . It expands the solution to the problem of water shortage into the social and economic system, and the connection between population and grain trade is the main line of the virtual water strategy [10] [11] . In recent years, there have been extensive studies on virtual water. Significant work has been devoted to estimating the virtual water content of different crops in different countries [12] , to quantify VWT between nations and regions via international trade [13] [14] , and to investigate water savings realized through VWT [15] [16] . Additional research has focused on macro level analysis, such as national water footprints or virtual water flows. An example of this is a case study for Spain [17] .
To date, little analysis has been done in China with regard to calculating VWT of the main crops in international trade or with regard to investigating agricultural water saving realized by VW international trade. Focusing on virtual water in the international grain trade, this paper calculates the virtual water volume embodied in the international grain trade from 1990 to 2012 in China and compares the volume of the virtual water trade with the total agricultural water consumption, thus trying to evaluate the contribution of the virtual water trade in grains on the water resources in China and the world.
2. Estimation of the Virtual Water Volume in the Chinese Grain Trade
2.1. Data Sources
According to the planting area of grain crops, output data and trade data from “Chinese Statistical Yearbook 1990-2012” and “Chinese Rural Statistical Yearbook 1990-2012”, we selected four main varieties of crops (wheat, corn, soybean and rice) to calculate their water demand and then further calculate their virtual water content, respectively. The calculation of a crop’s virtual water content requires data in addition to just climate data, for example data related to the crop transpiration coefficient and the unit area production of the crops in the region of interest. The climate data used are from the FAO climate database and the Crop database, the crop transpiration coefficient is from the CropWat software, the crop yield per unit area is from the China Rural Statistical Yearbook and the water resources data are from the Chinese Water Resources Bulletin.
2.2. Calculation Method for Virtual Water Content of Agricultural Products
A crop’s virtual water content mainly depends on the type of crop, the growth of regional natural and geographical conditions, the used irrigation system and management mode etc. Meanwhile, the calculation of different crops’ virtual water content in different regions needs comprehensive investigation of crop water demand and crop yield data. The calculation of a specific crop’s virtual water content can be expressed as:

In the formula, SWDc(n, c) refers to the virtual water content per unit of crop C among n types of crops (m3/t), CWR is the unit area of crop water demand (m3/hm2), and CY is the crop yield per unit area (t/hm2). ETC is used to indicate CWR, i.e. the transpiration water consumption which means the cumulative crop evapotranspiration during the cultivation of C crops. It is equal to the product of the reference crop evapotranspiration (ETo), and the crop coefficient of water (KC), according to the formula ETC = ETo × KC. In the calculation of ETo, we ignore the effect of several factors such as crop types, crop development and management measures and we treat the climate as the only affecting factor. The final calculation is based on the following FAO formula (FAO recommended standard and modified penman: Penman-Monteith):

In the formula, ETo is the loss of reference crop evapotranspiration (mm/d), Rn is the net radiation of the surface of crops (MJ/m2・d), G is the soil heat flux (MJ/m2・d), T is the average temperature (˚C), U2 is the wind speed at 2 m high above the ground (m/s), ea is the saturated vapor pressure (kPa), ed is the water pressure error (kPa), ea − ed is the difference between the actual pressure and saturation pressure (kPa), Δ is the slope of the saturated water pressure and temperature curve (kPa/˚C) and γ is the dry humidity constant (kPa/˚C). This method is suitable for primary agricultural products, ETO and CWR can be calculated using the CropWat software. Using the above formula, we recalculated the virtual water content per unit for China’s four major grain crops from 1990 to 2012. The results are shown in Table 1.
2.3. Estimation of Virtual Water Trade
2.3.1. Overall Virtual Water Trade
As can be seen from Table 2, virtual water import in the grain trade has increased from 152.79 × 10⁸ m3 in 1990 to 2239.27 × 108 m3 in 2012. It fluctuated greatly, and the fluctuations can be categorized into three phases. During the first phase, from 1990 to 1994, the virtual water import reduced from 152.79 × 10⁸ m3 in 1990 to 91.87 × 10⁸ m3 in 1994 due to a fluctuation in wheat import. During the second phase, virtual water import reduced from 190.42 × 10⁸ m3 to 65.18 × 10⁸ m3 and rose to in 1993 due again mainly to fluctuations in wheat import. During the third phase, from 2000 to 2012, virtual water import rose quickly from 175.46 × 10⁸ m3 to 2239.27 × 108 m3 due mainly to a significant import of soybean. Compared to the import, virtual water export in the grain trade is much smaller and shows less fluctuation. Due to fluctuations in corn export, virtual water export reached 110.42 × 10⁸ m3 in 1993 and has been decreasing since then. It decreased to 65 × 108 m3 in 1999, experienced several fluctuations following the corn and rice export volume, reaching 17.92 × 10⁸ m3 in 2009 and 126.87 × 10⁸ m3 in 2001, the unprecedented maximum.

Table 1. Virtual water content per unit for four major crops from 1990-2012 (m3/t).
Note: CWR is calculated using software; CY is calculated from the planting area and the grain yield. *Source: FAO http://faostat.fao.org/.
Table 2. Overall virtual water trade from 1990 to 2012 (×108 m3).
*Source: Chinese Statistical Yearbook 1990-2012.
2.3.2. Virtual Water Trade in Rice Trade
Virtual water export in the rice trade from 1990 to 2012 added up to 235.99 × 10⁸ m3, accounting for 20% of the overall virtual water export in the grain trade and ranking second. Virtual water import in the rice trade added up to 139.54 × 10⁸ m3, accounting for 0.8% of the overall virtual water import and ranking third of four kinds of crops. The net import added up to −176.45 × 10⁸ m3 as can be seen in Table 3. This table indicates that the virtual water trade associated with the rice trade featured export during 1990 to 2012. The virtual water export in the rice trade shows three phases. The first phases witness frequent fluctuations from 1990 to 1997, with a maximum of 14.68 × 10⁸ m3 and a minimum of 0.46 × 10⁸ m3. The second phase saw a dramatic increase in export. Though it decreased from 60.04 × 10⁸ m3 in 1998 to 26.20 × 10⁸ m3 in 2003, export during this phase exceeded that of the previous phase. The third phase also featured frequent fluctuations with a general decreasing trend.
Compared with virtual water export, import is much smaller and can also be divided into three phases. The first phase, from 1990 to 1997, saw moderate fluctuations, with a maximum of 16.62 × 10⁸ m3 and a minimum of 0.63 × 10⁸ m3. Import in the second phases reached the peak of 24.74 × 10⁸ m3 each year. The third phase, from 1999 to 2012, had hardly any import except for 7.66 × 10⁸ m3 in 2004 (Figure 1).
Table 3. Import and export volume and virtual water trade for rice.
*Source: Chinese Statistical Yearbook 1990-2012.
2.3.3. Virtual Water Trade in Corn Trade
The virtual water import in the corn trade from 1990 to 2012 added up to 124.28 × 10⁸ m3, accounting for 0.77% of the overall virtual water import in the grain trade and ranking fourth. The virtual water export in the corn trade from 1990 to 2012 added up to 998.22 × 10⁸ m3, accounting for 63% of the overall virtual water export in the grain trade and ranking first, and the net import added up to −873.94 × 10⁸ m3. From Figure 2 it can be seen that in the 23 years from 1990 to 2012 export of the virtual water trade for corn takes priority, and falls into four phases: the first phase is from 1990 to 1996, during which period the export volume of virtual water in corn rapidly spirals down from 27.94 × 10⁸ m3 to 0.92 × 10⁸ m3. The second phase lasts from 1997 to 2003, when the export volume of virtual water in corn rapidly increased again, from 54.32 × 10⁸ m3 to 134.63 × 10⁸ m3, and reached the highest level in history. In the third phase, the export of virtual water in corn declined abruptly between 2004 and 2007 with its lowest value of 19.03 × 10⁸ m3 in 2004. In the fourth phase, which lasted from 2008 to 2012, almost no export occurred. Compared with the export volume, the import volume of corn is relatively low, and the annual average import volume is only 5.4 × 10⁸ m3 (Table 4).
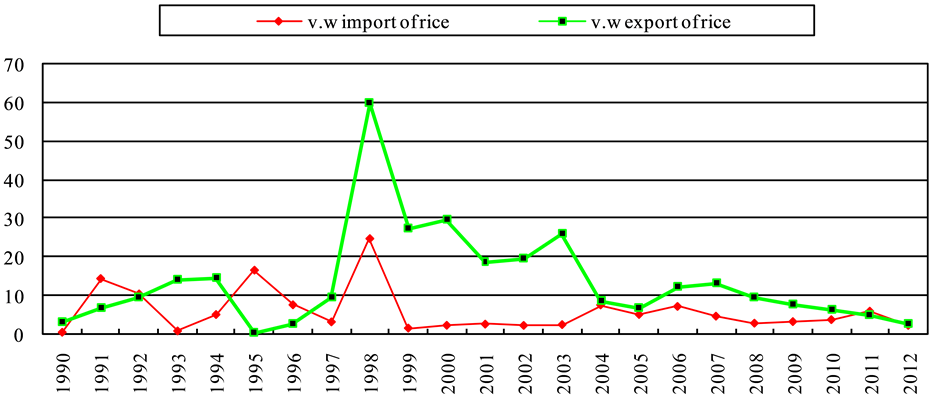
Figure 1. The tendency chart of virtual water trade of rice from 1990-2012. *Source: Chinese Statistical Yearbook 1990- 2012.
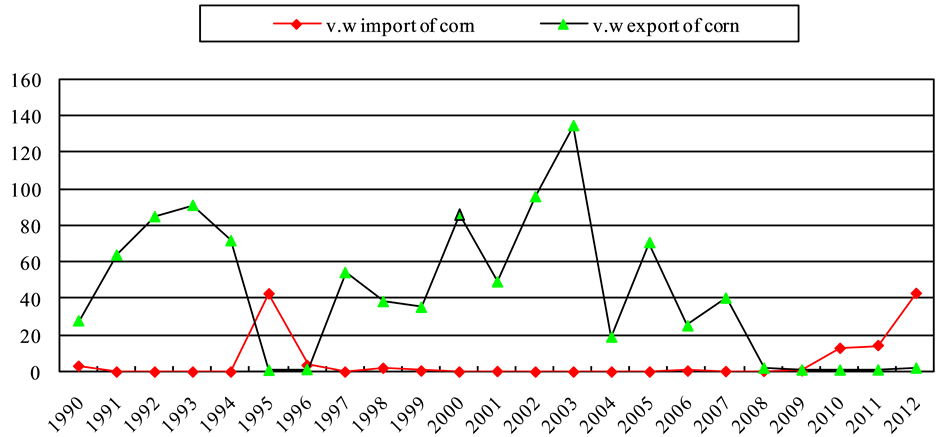
Figure 2. The tendency chart of virtual water trade of corn from 1990-2012. *Source: Chinese Statistical Yearbook 1990- 2012.
Table 4. Import and export volume and virtual water trade for corn.
*Source: Chinese Statistical Yearbook 1990-2012.
2.3.4. Virtual Water Trade for Soybean
During the 23 years from 1990 to 2012, the import volume of virtual water in the soybean trade of our country adds up to 14334.47 × 108 m3, which makes up 91% of the total import volume of virtual water in the grain trade, which constitutes the largest volume for the four types of grain in the study. Its export volume is 250.28 × 10⁸ m3 and accounts for 16% of the total export volume of the virtual water trade in grains, ranking second out of four kinds of grains. Therefore, its net import is 14074.21 × 108 m3. From Figure 3 it can be seen that in the 23 years from 1990 to 2012 the import of virtual water associated with the soybean trade takes priority. It shows two phases: the first phase lasted from 1990 to 1996, during which period the import volume of soybean virtual water is rather small, and the annual average import volume of virtual water is −1.33 × 10⁸ m3; the second phase lasts from 1997 to 2012, when the import volume of soybean virtual water soared, from 39.76 × 10⁸ m3 in 1997 to 2230.12 × 108 m3 in 2012, with an annual increase of 60.3%. Compared to the import volume, its export volume is relatively low, and there is no big variance. Its largest export amount occurred in 2012 at 49.66 × 10⁸ m3, and the annual amount is 10.88 × 10⁸ m3 (Table 5).
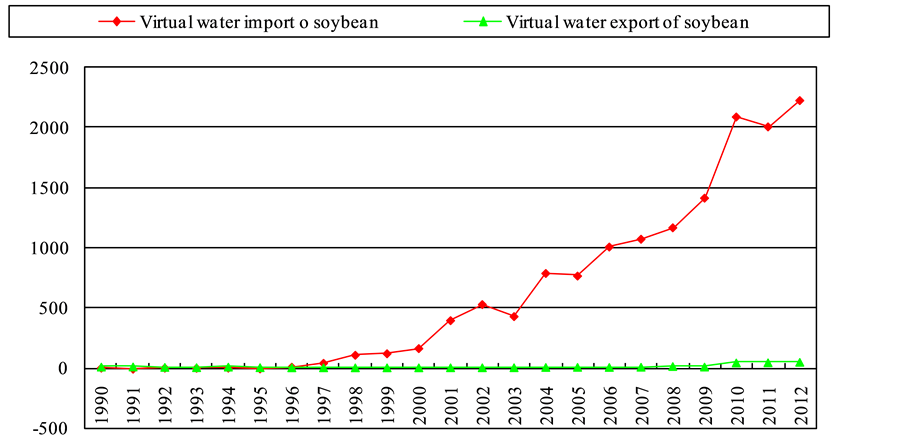
Figure 3. The tendency chart of virtual water trade of soybean from 1990-2012. *Source: Chinese Statistical Yearbook 1990- 2012.
Table 5. Import and export volume and virtual water trade for soybean.
*Source: Chinese Statistical Yearbook 1990-2012.
2.3.5. Virtual Water Trade for Wheat
From 1990 to 2012, the import volume of virtual water in the wheat trade amounts to 1117.01 × 108 m3, accounting for 7% of the total import volume of virtual water in grain in our country, being the third largest of the four types of grains in the study. Meanwhile, the exported amount adds up to 105.09 × 10⁸ m3, constituting a percentage of 6.7% of the gross export volume of virtual water in the grain trade, the third largest of the four types of grain crops in the study. Therefore, the net import volume of virtual water in the wheat trade is 1011.9 × 108 m3. From Figure 4 it can be seen that in the 23 years during 1990 to 2012, the import of virtual water in the wheat trade exceeded the export, with considerable fluctuations in its import volume, which decreased from 148.94 × 10⁸ m3 in 1990 to 76.38 × 10⁸ m3 in 1993, and then increased to 137.8 × 10⁸ m3 in 1995, after which it decreased again to 17.7 × 10⁸ m3 in 1997 (Table 6).
After 1997, the import volume keeps declining until 2009, after which it increases from 10.63 × 10⁸ m3 to 44 × 108 m3 in 2012. In the recent five years, as a result of the implementation of a policy which grants subsidies for wheat growing, the wheat yield has seen a soaring growth, while its import decreased accordingly, so as to cause a declining trend in the import volume of virtual water. In contrast with the import, its export volume as a whole is fairly small, with little variance. There is almost no export from 1990 to 2000, and the largest amount that occurred between 2000 and 2012 was 27.78 × 10⁸ m3 (the annual volume is only 4.5 × 10⁸ m3).
3. Contribution of Virtual Water in the Chinese International Grain Trade
3.1. Contribution of Virtual Water Trade to Chinese Agricultural Water Use
According to Table 1, the virtual water in the Chinese grain trade has maintained a larger trade deficit from 1990 to 2012. Most years’ virtual water trade volume showed a net import. Except for 1993, 1994 and 1997, each year saw an increase in import volume, from 112.78 × 10⁸ m3 to 2264.88 × 108 m3 in 1990 and 2012, respectively. In these 23 years, the total net virtual water volume reached 14044.98 × 108 m3, which is 3.27 times the total agricultural water usage and 1.53 times China’s total water supply in 2012. To reflect the contribution of China's virtual water trade to agricultural water use in China, we set up a linear regression model between agricultural water use and virtual water import in the grain trade. Through regression analysis we were able to calculate the effect of virtual water import on agricultural water use. The model is as follows:

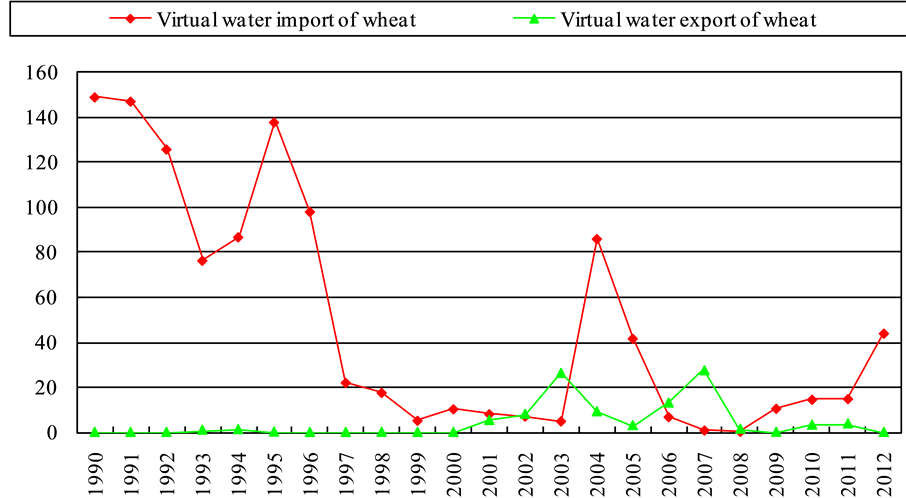
Figure 4. The tendency chart of virtual water trade of wheat from 1990-2012. *Source: Chinese Statistical Yearbook 1990- 2012.
Table 6. Import and export volume and virtual water trade for wheat.
*Source: Chinese Statistical Yearbook 1990-2012.
In the model, Yi represents the agricultural water use in year i, Xi represents the virtual water import of grain trade in year i, μ is the random error and β0β1 represents the variable coefficients. Taking the availability and the randomness of the data into consideration, we selected the years from 1996 to 2008, for which the data are as follows (Table 7).
After testing, the model shows that it can meet the classical assumption of least squares. We used the Eview 7.0 software to estimate the model parameters for the sample estimation equation. The substituted coefficients are as follows:


The sample estimation results show that the results are analyzed and passed by T-test, and there exists a negative correlation between the independent variable Xi (virtual water import in the grain trade) and the dependent variable Yi (agricultural water use). That is to say, when the virtual water import volume increases, the agricultural water use will decrease, and every import of 1 × 10⁸ m3 of virtual water will save 0.302 × 10⁸ m3 agricultural water use.
3.2. Contribution of Virtual Water Trade to Global Water Resources
The utilization efficiency of water resources embodied in different crops varies significantly across countries. Planting crops in countries with a higher water utilization efficiency and then exporting those to countries with a lower water utilization efficiency can save water resources on a global level. In order to reflect the contribution of the virtual water trade to global water resources, this paper used the method of calculating the average virtual water content of different crops by Hoekstra and Hung in 2003 to recalculate the virtual water trade volume in China from 1990 to 2012. The results revealed that the total water resources saved by the virtual water embodied in the international grain trade in China has reached a volume of 3353.47 × 108 m3 (Table 8).
4. Conclusions
This thesis employs a virtual resource approach to calculate the trade volume of virtual water in the Chinese international grain trade from 1990 to 2012, and the following conclusion could be reached:
Firstly, on the basis of the results of this thesis, the virtual water content in the four kinds of food crops we studied can be arranged from high to low as follows: soybean (3820 m3/t), wheat (1189 m3/t), rice (1014 m3/t) and corn (821 m3/t).
Table 7. Agricultural water use and virtual water import in grains from 1996 to 2008 (×108 m3).
*Source: Chinese Statistical Yearbook 1990-2008; Chinese Rural Statistical Yearbook 1990-2008; *Source: Chinese Water Resources Bulletin.
Table 8. Global water saved by the Chinese international grain trade from 1990 to 2012 (1 × 10⁸ m3).
*Source: Chinese Statistical Yearbook 1990-2012; Chinese Rural Statistical Yearbook 1990-2012; *Source: Chinese Water Resources Bulletin.
*Corresponding author.
Thirdly, based on the data for agricultural water consumption and the import of virtual water, by means of econometric modeling, the conclusion can be reached that there exists a significant negative correlation between agricultural water consumption and virtual water import volume. Every unit of virtual water causes a reduction of 0.306 unit in agricultural water consumption. Therefore, a virtual water strategy can offer us a new way of saving water, as well as the guarantee of domestic water resource safety and sustainable development.
Fourthly, the effects of water savings brought by the grain trade are not synchronous. In terms of the relation between the grain trade and water resources, an increase in net export volume of the former does not necessarily give rise to an increase in the net export volume of the latter, and conversely, an increase in the net import volume of the former does not necessarily cause an increase in the net import volume of the latter either. The key lies in the breed structure of grain trade imports and exports. This finding carries great significance for the development of policies: from the aspect of improving water resource efficiency of the grain trade, policies should aim to adjust the breed structure of imports and exports in accordance with the water contained in each agricultural product, rather than blindly pursuing the surplus or deficit of the trade volume.
Funding
This work is supported by The Project of National Social Science Fund of China (13BJY115).
References
- Chen, Z.-M. and Chen, G.Q. (2013) Virtual Water Accounting for the Globalized World Economy: National Water Footprint and International Virtual Water Trade. Ecological Indicators, 28, 142-149. http://dx.doi.org/10.1016/j.ecolind.2012.07.024
- Feng, K., Siu, Y.L., Guan, D. and Hubacek, K., (2012) Assessing Regional Virtual Water Flows and Water Footprints in the Yellow River Basin, China: A Consumption Based Approach. Applied Geography, 3, 691-701. http://dx.doi.org/10.1016/j.apgeog.2011.08.004
- Allan, J.A. (1993) Fortunately There Are Substitutes for Water Otherwise Our Hydropolitical Futures Would Be Impossible, Priorities for Water Resources Allocation and Management. Overseas Development Administration, London, 13-26.
- Dong, H., Geng, Y., Sarkis, J., Fujita, T., Okadera, T. and Xue, B. (2013) Regional Water Footprint Evaluation in China: A Case of Liaoning. Science of the Total Environment, 442, 215-224. http://dx.doi.org/10.1016/j.scitotenv.2012.10.049
- Allan, J.A. (2003) Virtual Water―The Water, Food, and Trade Nexus: Useful Concept or Misleading Metaphor? Water International, 28, 4-11. http://dx.doi.org/10.1080/02508060.2003.9724812
- Allan, J.A. (1998) Virtual Water: A Strategic Resource Global Solutions to Regional Deficits. Ground Water, 36, 545- 546. http://dx.doi.org/10.1111/j.1745-6584.1998.tb02825.x
- Hoekstra, A.Y. (2003) Virtual Water Trade. Proceedings of the International Expert Meeting on Virtual Water Trade, Value of Water Research Series, 12.
- Zhao, X., Chen, B. and Yang, Z.F. (2009) National Water Footprint in an Input-Output Framework―A Case Study of China 2002. Ecological Modelling, 220, 245-253. http://dx.doi.org/10.1016/j.ecolmodel.2008.09.016
- Zhao, X.U., Yang, H., Yang, Z., Chen, B. and Qin, Y. (2010) Applying the Input-Output Method to Account for Water Footprint and Virtual Water Trade in the Haihe River Basin in China. Environmental Science & Technology, 44, 9150- 9156. http://dx.doi.org/10.1021/es100886r
- Liu, J.J., Dong, S.C. and Li, Z.H. (2011) Comprehensive Evaluation of China’s Water Resources Carrying Capacity. Journal of Natural Product and Plant Resources, 26, 258-269.
- Ma, J. (2006) Application of the Virtual Water Trade to China’s Grain Security. Advance in Water Science, 17, 102- 107.
- Zhang, Z., Yang, H. and Shi, M. (2011) Analyses of Water Footprint of Beijing in an Inter-Regional Input-Output Framework. Ecological Economics, 70, 2494-2502. http://dx.doi.org/10.1016/j.ecolecon.2011.08.011
- Renault, D. (2003) Value of Virtual Water in Food: Principles and Virtues. UNESCOIHE, Delft, The Netherlands.
- Guan, D. and Hubacek, K., (2007) Assessment of Regional Trade and Virtual Water Flows in China. Ecological Economics, 61, 159-170. http://dx.doi.org/10.1016/j.ecolecon.2006.02.022
- Chapagain, A.K. and Hoekstra, A.Y. (2003) Virtual Water Flows between Nations in Relation to Trade in Livestock and Livestock Products. UNESCO-IHE, Delft, The Netherlands.
- Chapagain, A.K. and Hoekstra, A.Y. (2004) Water Footprints of Nations. In: Value of Water Research Report Series, Vol. 16. UNESCO-IHE, Delft, The Netherlands.
- Dumont, A., Salmoral, G. and Llamas, M.R. (2012) The Extended Water Foot Print of the Guadalquivir Basin. In: De Stefano, L. and Llamas, M.R., Eds., Water Agriculture and the Environment in Spain: Can We Square the Circle? CRC Press/Balkema, London, 105-113. http://dx.doi.org/10.1201/b13078-11
NOTES

*Corresponding author.