Journal of Signal and Information Processing
Vol.4 No.2(2013), Article ID:30998,4 pages DOI:10.4236/jsip.2013.42021
Study of Scanning Dose Optimization on Chest and Abdomen Enhanced CT Imaging
![]()
Department of Biomedical Engineering, Luzhou Medical College, Luzhou, China.
Email: hzwnet@126.com
Copyright © 2013 Zhiwei Huang et al. This is an open access article distributed under the Creative Commons Attribution License, which permits unrestricted use, distribution, and reproduction in any medium, provided the original work is properly cited.
Received March 18th, 2013; revised April 19th, 2013; accepted April 28th, 2013
Keywords: Enhanced CT Scan; Scanning Technology Parameters; Dose Monitoring; Radiation Dose
ABSTRACT
Objective: Investigate the correlation between radiation dose and radiation risk when patients are scanned by 64-slice spiral CT. Materials and Methods: Using SPSS 17.0 statistically analyze the patient’s scanning parameters, radiation dose of monitoring and examining the patients who are scanning of their abdomen, chest and pelvic in our affiliated hospital. Results: SPSS statistical analysis shows the factor related to radiation dose is scanning layer; the basic characteristics such as height and heart rate don’t directly affect the patient’s scan dose. Conclusion: Increasing the delay time after injection can reduce the scan numbers and monitoring layers of the machine, thus reduce the patient’s radiation dose and tube’s exposure time.
1. Introduction
How to use CT scan rightly and to reduce the radiation dose as much as possible have been the critical issues of concern in the field of clinical imaging technology. Rational use of low-dose (as low as reasonably achievable, ALARA) principle is proposed to meet the requirements under the premise of clinical diagnosis to minimize patient dose [1]. This principle not only promotes our software and hardware in the machine structure to improve its efforts to achieve lower patient dose, but also rationalizes scanning parameters and programs under the premise that the scan parameters’ optimization and scan process rationalization do not affect the diagnostic criteria [2]. In this paper, we statistically analyze the patients who had the abdomen, chest and pelvic enhanced CT imaging examination, we explore the correlation between radiation dose and radiation risk in the spiral CT examination for a patient, and we propose that rational use of the scanning parameters, optimization trigger delay time, as a result, the radiation dose of the patient will be reduced, and the tube loss of the CT machine will be reduced either.
2. Materials and Methods
2.1. Scanning Method
168 clinical patients cases were collected, in which breast examinations are 47 cases, thoracic and abdominal examinations are 33 cases, abdominal examinations are 72 cases, pelvic examinations are 10 cases; total examinations are 98 male cases and female 70 cases. The characteristics of the patients who received enhanced CT examinations in our affiliated hospital in March, 2011 are as following: ages are 4 to 88 years old, mean age is 56 years; heights are 115 - 177 cm, an average height is 162 cm; weights are 21 - 88 kg, an average weigh is 58.3 kg; heart rates are 48 to 128 beats/min, average heart rate is 90.9 beats/min; average blood pressure is 132.9/85.5 Pa [3].
The GE Light Speed 64-slice CT scanners, binoculars injector (Ulrich medizintechnik), 18 - 22 G needle. Scanning parameters are as following: tube voltage 100 - 120 kV, tube current 250 - 400 mA, tube rotation time 0.6s/circle, bed-speed 35 mm/s, slice thickness and spacing are 5 mm, detector width 64 × 0.625 mm, scan field 30 cm × 30 cm, pitch 0.984, data acquisition matrix of 512 × 512, display matrix of 1024 × 1024. Scanning range is as following: chest from the thoracic inlet to the diaphragm plane under the surface; the whole abdomen from the liver to the top level of the pubic symphysis; chest and abdomen from the thoracic inlet to the pubic symphysis was level. All scans are used supine position, the line enhanced CT scan. Contrast agents used nonionic contrast agent Ultravist (300 mgI/L), dose of 60 80 ml (1.2 - 1.5 ml/kg), by the right elbow before the intravenous bolus injection, flow rate 2.0 - 3.0 ml/s, followed by injection of normal saline 20 ml tube erosion. Scanning method is divided in two ways: empirical scanning and sub-bolus tracking (Bolus Tracking) trigger scanning; empirical scanning is that upon completing the bolus injection for the scanned area, arterial phase scanning is performed, bolus tracking (Bolus Tracking) trigger scanning is that the set threshold value of the selected region is scanned. In the group of cases, for the thoracic case, we choose the aortic plane as the region of interest (region of interest, ROI), for the whole abdominal cases, we choose abdominal aorta of the diaphragm muscle plane as the ROI, the ROI of the chest and abdomen cases is the same as the whole abdomen, case, for the pelvic case, we choose the main artery which is close to iliac artery. All the selected ROI size is about 50% of the aortic area, the trigger threshold value is set to 120 Hu, and we scanned the patients according to the set threshold value. For the whole abdomen scanning and the scanning which included the whole abdomen, we adopted dual-phase scan, the rest were single arterial phase scan, and we delay scanning according to the requirement, and obtain axial images [4].
2.2. Observation and Studying and Analyzing Methods
1) We use group comparison method, that is, we classify the clinical data of patients into groups for statistical analysis, because of the specificity of the body structure and scanning mechanism, the collected clinical data of 164 patients can be divided into four categories to be described, we did experiments on the enhanced CT imaging scan test, and finally drew the conclusions about the parameter setting, monitoring and detecting time setting, plus scanning parameters setting. In addition, we had the preliminary study about the optimization scheme for the enhanced CT scan imaging of the chest, abdomen, chest and abdomen and pelvic cavity.
2) We compare the images’ resolution under different scanning parameters; we obtained scan parameter setting for relatively low-dose, low-risk, and high diagnostic resolution.
3) Using SPSS analysis software, we analyzed the correlation between the patients’ height, heart rate, other basic characteristics and the radiation dose.
2.3. Analysis and Assessment Method
In the use of CT scan machine on the patient, the tube voltage, tube rotation time, bed-speed, slice thickness and spacing, probe width, scan field, pitch, data acquisition matrix, the display matrix and other major CT scan parameters are set to the fixed values, the tube current are chosen from scan parameters of 260 - 400 mA, we obtained the patients’ radiographic image, and we scored the effect of the images, the scoring criteria is as following: Outlining clearly visible blood vessels and clear edge sharpening effect was recorded as 3 points, blurred edge sharpening and visible outline was recorded as 2 points, intermittent or incomplete contour display was recorded as 1 point., that blood vessels does not appear was recorded as 0 point. Plus we assessed the radiation dose for the patient, assessing grades are divided into I - V levels, I level is that radiation doses less than 250 mGy; II level of radiation dose ranges 250 mGy - 500 mGy; III level of radiation dose ranges 500 mGy - 750 mGy; IV grade the radiation dose ranges 750 mGy - 1000 mGy; V level of radiation dose range is greater than 1000 mGy [5].
By using the statistical software SPSS 17.0, we analyzed the collected clinical data of the patients. We adopted independent sample t-test and scatter analysis for the affect of different gender on radiation dose; we had analysis of variance and scatter analysis on the radiation dose for different ages.
3. Radiation Dose and Risk Analysis
According to statistical theory, we used the statistical software SPSS 17.0, and statistically analyzed the experimental data of the respective group A, B, C and D, in addition we compared the software data of group A1, A2, B1, B2, C1, C2 and D1, D2, finally the analysis was concluded.
We analyzed the collected patients’ parameters according to the theory of dose calculation, plus by using the calculation theory of tissue and organ absorbed dose (D), we made the data of radiation dose of the patient micro-element. We minimized the effect of individual difference on the radiation dose, and exclude the impacts of height, weight and other factors. The analysis with of chest radiation dose was shown in Table 1, and the analysis without of chest radiation dose was shown in Table 2.
The above analysis tables show that:
1) The patients who received chest examination with monitoring layer are more likely to suffer more radiation dose than the patients who received chest examination without monitoring.
2) The patients who received chest examination with monitoring layer are more likely to have much lower risk than the patients who received chest examination again without monitoring.
The scanning parameters of the group A1, A2, B1, B2, C1, C2 and D1, D2 were set, and the images of these groups are listed and compared, and the relationship between the image clarity and the setting of the main scan-
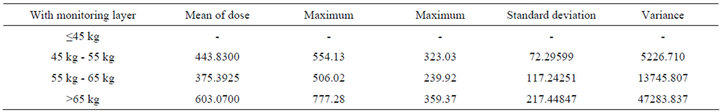
Table 1. An analysis table with of chest radiation dose.
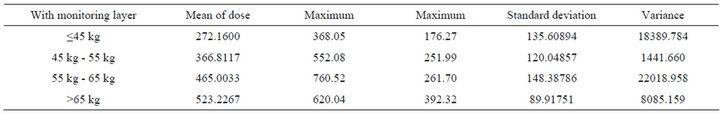
Table 2. An analysis table without of chest radiation dose.
ning parameters. The scanning dose and image scale was shown in Table 3.
The above data analysis shows that: all the images obtained under the four scanning parameters have certain defects. When current is 260 mA, the image resolution is low, this may affect the diagnosis; When the current is 400 mA, the image will produce too much unnecessary information, at the same time the patient will be unnecessarily hurt by the radiation. When the current is 350 mA, the image gets the most amount of information and it is clear with relatively low radiation dose.
Most of the scanning monitoring layers are concentrated between 5.00 - 7.5; the radiation dose has slightly linear growth with the increasing number of the scanning monitoring layers. The radiation dose is not slightly affected by heart beat (except in patients with coronary CT examination). The number of the male patients who received enhanced CT scan is slightly more than the number of the female patients; the number of the male patients who received low-dose scan is slightly more than the number of the female; the scanning dose of the male and female patients mostly concentrate on 900 - 1400 mGy.
The correlation between radiation dose, the number of monitoring layers, the heart rate and the height is that radiation dose were slightly related to the number of the monitoring layers of the patients, the radiation dose slightly increased with the growing number of the monitoring scanning layers, but the situation dose not directly reflect that the radiation dose and the patient’s heart rate, height and sex is definitely related, it need to be further studied.
4. Conclusions and Expectation
CT is now widely used in clinical, radiological protection sector pay more and more attention to CT examination. In order to enhance the quality management and control
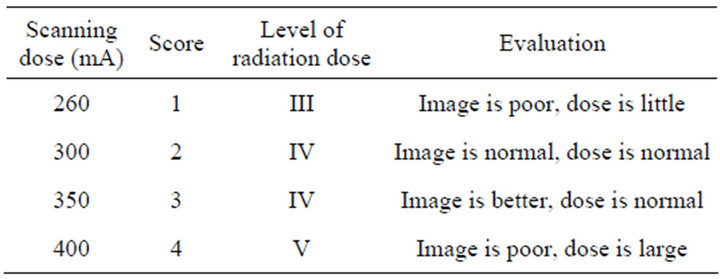
Table 3. Scanning dose and image scale.
of CT, we not only require the software and hardware of the CT and other radiation detection equipment to become more and more secure and humanized, but also require the operation standardization of the scanning personnel [6]. The radiology technicians should increase accountability for the patient to choose the most appropriate method of examination, they should ensure that they can obtain a satisfactory diagnostic images by using the minimum radiation dose, and effectively optimize the CT scanning parameters, greatly reduce the radiation dose and radiation risk, they should be responsible for the patients [7]. From the above experiments, the following conclusions can be drawn:
1) The patient who receive examination with monitoring layers are more likely to suffer more radiation dose than the patients who receive examination without monitoring, the patients who receive examination with monitoring layers are more likely to have much more lower risk to suffer from radiation dose than the patients who receive examination again without monitoring. All in all, the patients who receive examination with monitoring layers suffer relatively less radiation dose. When the patients are given enhanced CT examination, if the physician is not a scanning technician with many years’ experience in radiology, the Smart Monitoring must be carried out, when the CT threshold value is achieved, the physician trigger the CT machine, and scan the patient to obtain medical diagnostic information.
2) CT diagnostic image acquisition should not affect the clarity of the premise and minimize the radiation dose. When the tube voltage is 120 Kv, the physician should adjust the tube current, optimize it to 300 mA - 350 mA, so this will get the most amount of information and the most clear images, while the radiation doses is relatively low.
3) When the physicians scan the patients with monitoring layers, the number of the scanning monitoring layers mostly concentrates between 5.00 - 7.5. The radiation dose have linear growth with the increasing number of scanning monitoring layers, the physician should rationally reduce the number of the monitoring layers under the premise of not affecting scanning to obtain image information, this can reduce the whole radiation dose of the patient.
4) The correlation between the radiation and the heart rate, height, age and sex is: the information of height and heart rate and other patient information do not directly affect the radiation dose of the patients who receive the enhanced CT examination (except for patients with coronary CT examination), but these information do affect the examination condition of the patient, so they will have certain impact on the patients who receive the enhanced CT examination. No evidence reflects that the radiation dose and the patient’s heart rate, height and sex are definitely related, this need to be further studied.
REFERENCES
- J. E. Colang, J. B. Killion and E. Vano, “Patient Dose from CT: A Literature Review,” Radiation Technology, Vol. 79, No. 1, 2007, pp. 17-26. http://radiologictechnology.org/content/79/1/17.abstract
- D. J. Brenner and E. J. Hall, “Computed Tomography Is an Increasing Source of Radiation Exposure,” New England Journal of Medicine, Vol. 357, No. 22, 2007, pp. 2277-2284. doi:10.1056/NEJMra072149
- American Association of Physicists in Medicine, “Specification and Acceptance Testing of Computed Tomography Scanners,” AAPM Report No. 39, New York, 1993.
- S. R. Prasad, C. Wittram, J. A. Shepard, “Standard Dose and 50% Reduced Dose Chest CT Comparing the Effect on Image Quality,” American Journal of Roentgenology, Vol. 179, No. 2, 2002, pp. 461-465. doi:10.2214/ajr.179.2.1790461
- D. Tacka and V. De Maertelaer, “Dose Reduction in Multi-Detector CT Using Attenuation Based Online Tube Current Modulation,” American Journal of Roentgenology, Vol. 181, No. 2, 2003, pp. 331-334. doi:10.2214/ajr.181.2.1810331
- IEC, “Evaluation and Routine Testing in Medical Imaging Departments—Part 3 - 5: Acceptance Tests—Imaging Performance of Computed Tomography X-Ray Equipment,” IEC 61223-3-5, 2004.
- ICRP, “Managing Patient Dose in Computed Tomography,” Pergamon Press, Oxford, 2011.