Psychology
Vol.5 No.11(2014), Article
ID:49071,14
pages
DOI:10.4236/psych.2014.511151
Non-Verbal Cognitive Profile of Young Children with Autism Spectrum Disorders
Tatiana Pontrelli Mecca1, Fernanda Tebexreni Orsati2, Elizeu Coutinho de Macedo3
1Educational Psychology Program at Unifieo, Osasco, Brazil
2Hussman Institute for Autism, Baltimore, USA
3Developmental Disorders Program, Mackenzie University, Sao Paulo, Brazil
Email: tati.mecca@gmail.com
Copyright © 2014 by authors and Scientific Research Publishing Inc.
This work is licensed under the Creative Commons Attribution International License (CC BY).
http://creativecommons.org/licenses/by/4.0/


Received 13 June 2014; revised 7 July 2014; accepted 1 August 2014
ABSTRACT
The literature shows that children with autism spectrum disorders (ASD) demonstrate a heterogeneous pattern of cognitive abilities, including nonverbal abilities. However, there is a need for better cognitive characterization of this population for both research and intervention purposes. The present study aims to verify the Leiter-R performance profile for 40 children between the ages of 3 and 8 years old with ASD. The performance of the ASD children in each subtest and their total scores were compared to those of a control group of typically developing children, and intragroup analysis was conducted to verify the strengths and weaknesses of the children with ASD. The results show that individuals with ASD have difficulties with abstract reasoning related to fluid intelligence as well as selective attention and inhibition. Conversely, their visuo-spatial abilities are their strength. Cluster and comparative intra-group analyses indicate that nonverbal cognitive abilities are heterogeneous among the individuals within the ASD group. Performance in nonverbal tasks is positively correlated with adaptive functioning in communication and daily skills domains and inversely correlated with symptom severity as measured by the Autism Behavior Checklist. These results corroborate the literature associating cognition and functionality in ASD.
Keywords:Autism Spectrum Disorders, Intelligence, Cognitive Profile, Nonverbal, Leiter-R

1. Introduction
1.1. Intelligence and ASD
Cognitive assessment of individuals with ASD reveals how they process and execute tasks. In addition to being essential for determining specific deficits and areas for improvement, such an assessment can be used to identify strengths for an effective intervention (Fecteau, Lepage, & Theoret, 2006; Penn, 2006). In addition, we can use intelligence scores to better characterize and define more homogenous groups within the ASD population, which will inform interventionists and practitioners and help identify other underlying neurobiological markers for this condition (Joseph, 2011).
Symptom differences characterize different levels of cognitive and adaptive functionality, which depend on the intensity, frequency and duration of the behaviors (Klin, 2009). Some authors show trends in intellectual disabilities among individuals with ASD (Fombonne, 2003; Braun et al., 2007), while Klin (2009) reports a range from individuals with profound intellectual disabilities to individuals with high intellectual quotients (IQs).
Munson et al. (2008) assessed 456 children between two and five and a half years of age. The authors identified a first group (comprising 59% of the individuals) that showed severe intellectual disability, with below average scores in verbal and non-verbal abilities; a second group (12.5% of the sample) that was similar to the first group but with large discrepancy between verbal and non-verbal abilities; a third group (21.7% of the sample) that showed moderate to mild deficits in both verbal and nonverbal abilities; and a fourth group (7% of the sample) that had average performance in all scores. The researchers also found significant differences in adaptive behavior. There is a progressive improvement from the first to the fourth group regarding communication and socialization.
Intellectual assessment can be useful in assessing intervention effectiveness and forming predictions of longterm results (Klinger, O’Kelley, & Mussey, 2009). An intelligence assessment aims to identify individuals’ abilities and deficits that influence learning and provide a better understanding of possible and efficacious intervention according to individuals’ needs.
1.2. Assessing Intellectual Abilities in ASD
A literature review conducted by Siegel, Minshew, & Goldstein (1996) showed a 12-point difference between verbal and execution IQs, with the latter score being higher. According to Hurley & Levitas (2007), the recent advancements in describing and understanding the cognitive functioning of individuals with ASD were obtained from individuals who can be verbally accessed and thus have intact intelligence scores. Nevertheless, there is an urgent need to better characterize and learn about the cognitive functioning of other subgroups within the ASD population, particularly individuals who are considered to have moderate or severe intellectual disabilities and individuals who are not able to respond to traditional IQ measures, such as the WISC (Wechsler Intelligence Scale for Children), due to verbal expression and comprehension abilities.
Research studies report patterns of discrepancy when individuals with ASD are assessed using the WISC. It is important to note that these patterns and results are valid for individuals with ASD with average verbal communication skills and do not apply to individuals with limited verbal communication skills. Happé & Frith (1996) reported better performance in the Execution scales relative to the Verbal Comprehension Index of the WISC III in a sample with ASD compared to controls. Individuals with ASD performed better in the Block Design subtest, which measures organization, visuo-spatial processing and mental combination of elements based on a model. In this case, the choice of strategy for performing a task is another excellent predictor of nonverbal intelligence as well as visuo-spatial reasoning. The individual who chooses an analytic route divides the picture into its small squares, finds the corresponding cube face for each of the square units and puts them together to form the whole picture. The global strategy consists of the individual using trial and error to match each piece and form the complete the picture. Lastly, individuals who choose the synthesis strategy mentally divide the picture into partial cube sections, which are unified in the complete picture at the end of the task (Grégoire, 2000). These different routes show how different abilities are involved in this subtest, which measures visuo-perception, constructive abilities, eye-hand coordination and speed (Simões, 2002), and the importance of understanding nonverbal individuals and their abilities better.
Happé & Frith (1996) also suggested lower performance in the Comprehension subtest, which assessed the individual’s abilities to express his or her experiences. This test requires the ability to recognize social relationships rules, apply convincing capabilities and utilize mental flexibility. A below average result may suggest difficulties in thinking about or recalling different solutions for the same problem, difficulties in recognizing social rules and/ora lack of empathy and judgment, all which are common characteristics of individuals who present a non-verbal dysfunction (Simões, 2002). In both the Picture Arrangement and Coding subtests, individuals with ASD also produce lower scores (Szatmari, Tuff, Finlayson, & Bartolucci, 1990; Happé & Frith, 1996). The Coding subtest assesses the capacity of an individual to associate a number with a symbol and to keep these associations in memory in order to use this information to perform the task as quickly as possible. It evaluates the individual’s ability in learning how to make a behavior automatic, as it requires associations to be made quickly and precisely. It also includes other cognitive components, such as attention, cognitive flexibility and visuo-motor coordination. The Picture Arrangement subtest requires that the child put a series of pictures with an underlying short plot in logical sequential order. It assesses perceptual analysis ability as well as the ability to integrate all of the information available. A score below the average may reflect a deficit in the frontal functions of auto-regulation (Simões, 2002). Deficits found in both Comprehension and Picture Arrangement subtests are explained as deficits in theory of mind, which is the ability to infer the mental states of others (Baron-Cohen, Leslie, & Frith, 1986).
All of the measures and instruments described are useful in helping determine a profile for individuals with ASD. However, to efficiently base interventions on the strengths of these children and assess ASD at an early age, we need nonverbal tools.
1.3. Non-Verbal Assessment in ASD
Assessment of the non-verbal IQs of children with ASD has been found to be a reliable measure and is particularly useful when individuals exhibit communication and language deficits (Joseph, 2011). The child’s profile of strengths and deficits can also be assessed using nonverbal tasks that access different abilities (Kuschner, Bennetto, & Yost, 2007; Macedo et al., 2013). Individuals with ASD demonstrate better performance in visuo-spatial abilities (visual processing Gv) and deficits in tasks that assess abstract reasoning and concept formation (fluid intelligence Gf) (Klinger & Dawson, 2001; Minshew, Meyer, & Goldstein, 2002). The latter deficits can be explained by difficulties with executive functioning (Kuschner, Bennetto, & Yost, 2007). Individuals with ASD show difficulties in tasks that require planning, flexibility and inhibition (Happé & Frith, 1996). Macedo et al. (2013) demonstrated that preschool age children with ASD have significantly lower scores than the population average in concrete and abstract reasoning. In addition, intra-group analysis revealed significantly lower performance in these reasoning tasks than in visuo-construction tasks.
Several studies have used the Leiter-R to obtain a more complete picture of cognitive profiles and abilities in ASD (Portoghese et al., 2010; Reed, Watts, & Truzoli, 2011; Scattone, Raggio, & May, 2012; Grondhuis & Mulick, 2013). In addition, research studies report that the Leiter-R is a more efficient tool for the assessment of cognitive aspects of individuals with ASD than other measures, such as the Wechsler or Stanford-Binet scales (Dawson, Soulières, Gernsbacher, & Mottron, 2007; Grondhuis & Mulick, 2013).
The Leiter-R has several advantages when used in the assessment of individuals with ASD. The instrument requires minimal verbal communication; the tasks are independent of verbal instructions, minimizing the need for verbal and gesture comprehension and verbal interactions with the clinician. Furthermore, there is no time limit for task completion (Shah & Holmes, 1985). Two studies that assessed individuals with ASD using the Leiter-R used minimal verbal instructions because, according to the authors, it is not possible to use the instrument without any verbal instructions for students with ASD. The authors used the same procedures with all of the groups assessed to control for the effect of the minimal verbal instructions (Kuschner et al., 2007; Tsatsanis et al., 2003).
Tsatsanis et al. (2003) analyzed the profile of children with ASD using the Leiter-R. The authors reported that three in four children performed significantly better in the subtests that assessed visual processing than those that assessed inductive and sequential reasoning. This study also revealed high correlations between performance in the Leiter-R and the level of adaptive behavior assessed using the Vineland Adaptive Behavior Scales.
Kuschner et al. (2007) assessed differences among non-verbal abilities using the Leiter-R in preschool students for three different groups: ASD children, children with intellectual disabilities and typically developing children. The main effect of the subtests revealed differential performance for different groups. Children with ASD had better performance in tasks that assessed discrimination, exploration and visual search (Figure-Ground subtest) as well as perceptual organization (Form Completion subtest) when compared to tasks that assessed inductive (Repeated Patterns subtest) and sequential (Sequential Order subtest) reasoning. These results corroborate the literature that describes strengths in perceptual abilities rather than fluid intelligence. The other two groups assessed, children with intellectual disabilities and typically developing children, demonstrated a more homogenous and linear profile. Intellectually disabled children performed worse in the Figure-Ground subtest than the Form Completion subtest, and the typically developing children performed better in the Figure-Ground, Form Completion and Repeated Patterns subtests than the Sequential Order subtest. These results indicate that discrepancies between visuo-perceptual abilities and abstract reasoning are more frequent in individuals with ASD, increasing its correlation with communication skills.
Dias (2013) assessed 105 preschool students ranging from three to five years of age divided in four groups: children with autism or pervasive developmental disorder-not otherwise specified (PDD-NOS), children with Asperger syndrome, children with developmental delays but no ASD diagnosis and children with typical development. The aim of the study was to identify the performance profiles of these four different groups using the Leiter-R. Both groups of children with ASD had IQ scores within the average range for their age. The autism/ PDD-NOS group had lower scores than the Asperger group and significantly lower scores than the typically developing group. Looking at performances in the subtests, the group with developmental delays had significantly lower scores for all subtests, with the exception of when they were compared with the ASD groups in the Figure-Ground subtest. In this subtest, the individual is tasked with pairing the drawings of the stimulus with the drawings presented in the card that complete the missing part of the picture (Roid & Miller, 1997). There were no significant differences between the ASD and Asperger’s groups or between the Asperger and typical development groups for any of the subtests. Finally, the ASD group had significantly lower scores than the typical development group in the Figure-Ground and Classification subtests, which assess visual discrimination as well as exploration and semantic association, respectively (Dias, 2013).
The Leiter-R is clearly well suited for the strengths and weaknesses of individuals with ASD. Furthermore, there is a need for the early identification of signals and symptoms in ASD (Cangialose & Allen, 2014; Charman, 2014) to provide ASD children with access to early intervention, thereby improving their prognoses. As a consequence, assessment tools that can be used with younger children are necessary. In Brazil, the WISC-III (Wechsler, 1991) and more recently the WISC-IV (Wechsler, 2003) are currently used for children that are six years of age and older, limiting early assessment possibilities. To fill this gap, several studies have attempted to determine the adequacy, precision and validity of the Leiter-R for the Brazilian population (Mecca, 2010; Mecca et al., 2014). The present study adds to this body of literature, aiming to verify the cognitive profile of Brazilian children between three and eight years old with ASD using the Leiter-R and relate the Leiter-R scores with autism symptoms and adaptive behaviors.
2. Method
2.1. Participants
A total of 49 children participated in this study. All of the children had a confirmed clinical diagnosis of ASD according to an experienced clinician and the DSM-IV-TR criteria, the most recent criteria adopted in Brazil (American Psychitric Association, 2000). In addition, all participants scored within the ASD range on both the Autism Screening Questionnaire (Berument et al., 1999; Sato et al., 2009) and the Autism Behavior Checklist (Krug, Arick, & Almond, 1980; Marteleto & Pedromônico, 2005). Individuals with genetic and neurological associated conditions, such as Fragile X Syndrome or epilepsy, were excluded.
The sample was comprised of 48 boys and one girl, and their ages ranged from 3 to 8 years old. In total, 37 of the participants were diagnosed with autism (75.51%), 10 with pervasive developmental disorder-not otherwise specified (PDD-NOS) (20.40%) and two with Asperger syndrome (4.09%). Recruitment occurred in two institutions in which the children received their diagnosis based on a multidisciplinary team assessment. The clinical diagnosis was based on the results of medical, behavioral, neuropsychological and speech pathologist evaluation. The participation of the children and families in this study was voluntary, and the caregivers signed consent forms.
The clinical group was compared to a control group based on the sample of the validation study of the LeiterR in Brazil (Mecca, 2013). The controls were paired by gender, age in months, and type of school they attended: private or public.
2.2. Instruments
Three intelligence assessment tools were used in this study. The Leiter International Performance Scale Revised (Leiter-R), is a nonverbal assessment battery used to assess individuals from two to 20 years of age (Roid & Miller, 1997), but the validation study for Brazilian population is for individuals between two and eight years old (Mecca, 2013). The Leiter-R assesses intelligence in a nonverbal manner using subtests that demand visual processing (Gv) and fluid reasoning (Gf). Each age group is required to respond to six subtests, yielding a total IQ score. Four of the six subtests are the same for all age groups: Figure-Ground, Form Completion, Sequential Order and Repetitive Patterns. For individuals between two and five years of age, the subtests Matching and Classification are also used, and after the age of six, Design Analogies and Paper Folding are used. The total time required for assessment with this instrument is approximately 30 min.
The other intelligence measure used was the WISC-III, the Wechsler Intelligence Scale for Children, used for children from six to 16 years of age. The WISC is composed of two subscales, Execution and Verbal, which are combined to provide a total IQ measure. Previous studies showed a high positive correlation between WISC-III and Leiter-R (r = 0.85) (Roid & Miller, 1997). Lastly, SON-R 2 1/2-7[a] was used to assess the fluid intelligence of children from two to seven years old. It is composed of non-verbal tasks that measure visuo-spatial ability and concrete and abstract reasoning and contains four subtests: Mosaic, Situations, Categories and Patterns. It takes approximately 30 min to complete (Laros, Jesus, & Karino, 2013).
To compare symptom severity with other measures in this study, two autism screening questionnaires were used: the Autism Screening Questionnaire (ASQ) and the Autism Behavior Checklist (ABC). These questionnaires were chosen because they have been translated and normalized for the Brazilian population. The ASQ is composed of 40 questions, which were answered with a “yes” or “no” by the child’s caregiver. Every question is scored as 0 or 1 depending on the presence of the symptom. It includes three domains: social interaction, language and behavior. The final score in the Brazilian normalization has three classification possibilities: zero to 14 points is typical development, 15 to 21 is categorized as PDD, and children with scores above 21 are classified as autistic (Berument et al., 1999; Sato et al., 2009). The second autism questionnaire, the ABC, has 57 items assessing behaviors in five domains: relationships, use of body and objects, language, personal and social domains and sensorial stimulation. The score for each item is 0 or 1, depending on the presence of the symptom. For the Brazilian normalization, the classification is as follows: 68 points or higher as autism, 54 to 67 points as a moderate probability of autism, 47 to 53 as a low probability of autism and lower than 47 points as typical development (Krug et al., 1980; Marteleto & Pedromônico, 2005).
The last scale used to examine adaptive behavior was the Vineland Adaptive Behavior Scale (VABS).This scale assesses adaptive behavior in four domains: a) communication, b) daily living skills, c) socialization and d) motor skills. The caregivers respond to the questionnaires based on the frequency of a skill, behavior or situation that the child actually performs, not those she is capable of performing (Sparrow, Balla, & Ciccheti, 1984).
2.3. Procedures
The evaluation with the child and the administration of the questionnaires with the caregivers were conducted individually. For the ASD group, the assessment was conducted in specialized institutions; for the control group, it was conducted in their schools with previous arrangements to avoid disturbing their classroom activities. In the first session with the ASD group, the caregivers responded to the autism questionnaires, and the VABS were completed in a second session.
The completion of the three intelligence instruments was attempted in different sessions: one for the Leiter-Rand one for both the WISC-III and SON-R. When a participant was not able to respond to any of these instruments, description of his or her behavior were provided. This study reported the number of participants that completed the Leiter-R, WISC-III and SON-R because we aim to understand the viability of using these instruments for assessing individuals with neurodevelopment disorders.
2.4. Analysis
Variance analyses were conducted to compare groups. Intra-group analysis based on Student’s t-test was used to determine the performance profiles of participants in the Leiter-R. Raw scores were transformed into standard scores for both groups to examine cognitive profiles when comparing performance on the scale subtests. The standard score for the American population was used for both groups because there is no standardization for the Brazilian population. Cluster and variance analyses were applied to these results to compare the clustered group and to compare the Leiter-R score between the ASD subgroups based on the DSM-IV-TR diagnoses (APA, 2002) of autism and PDD-NOS.
This study also used Pearson correlations between performance on the Leiter-R and the autism scales and VABS. In addition, both the Leiter-R and the VABS scores were standardized using the American standards to enable the comparison of all age groups. All of the statistical analyses were performed using IBM SPSS version 20.0, and the significance level adopted was 5%. For the group comparisons, the effect size was calculated based on the Cohen d.
3. Results
Among all 49 participants with ASD, the Leiter-R was completed by 40, with only nine participants (16.67%) being unable to respond to the test. From these nine participants, eight were diagnosed with autism and one with PDD-NOS. A lack of basic assessment behaviors allowed the participants to be considered as non-respondent to the test. These behaviors included lack of gaze and attention to the testing materials, fixation on just part of the material, lack of comprehension of the context and instructions, not responding to the materials and instructions, not staying seated in the chair and non-standard sensory exploration of the materials.
Therefore, for this study, the total sample was comprised of 40 students with ASD, including one girl (2.5%) and 39 boys (97.5%). Out of the total sample, two children (5%) had been diagnosed with Asperger syndrome, 10 (25%) with PDD-NOS and 28 with autism. Table 1 presents the number of children who completed each test by age range.
Clearly, the number of participants who completed the Leiter-R is much higher than the number who completed the WISC-III or SON-R. Note that all children who completed any other intelligence test responded to the Leiter-R, whereas the opposite was not true.
Comparisons of the performance of the ASD children to the control group in terms of each subtest and total score on the Leiter-R were conducted using analysis of variance (ANOVA). The results show significant differences for the five subtests of Leiter-R and the total scores (Table 2).

Table 1. Number of participants with ASD who responded to each instrument.
Table 2. Comparison between ASD and the control group for the Leiter-R.
Four measures comprise the estimated IQ in the Leiter-R: Figure-Ground, Form Completion, Sequential Order and Repeated Patterns. Significant differences were found between these four subtests. The first two subtests assess visual processing ability, and the last two assess fluid reasoning. For the subtests used only for preschoolage children, significant differences were found in the Classification subtest, which examines semantic categorization. No significant differences were found in the Matching subtest, which assesses the individual’s ability to perform simple pairing based on concrete and abstract stimuli. No differences were found for the two subtests used for children six years of age and older: Design Analogies and Paper Folding. The first assesses logical reasoning based on visual stimuli, and the latter assesses visual processing with a specific component of image rotation and manipulation.
Considering that certain subtests are specific for certain age ranges, the profile analysis was performed for two separate groups: 20 preschool children (2 to 5 years of age) and 20 elementary school age children (6 to 8 years of age), both with ASD. The preschool group differed significantly from the control group for the following subtests: Figure-Ground (F(1,38) = 11.093; p < 0.01), Form Completion (F(1,38) = 11.868; p < 0.01), Sequential Order (F(1,38) = 9.243; p < 0.01) and Repeated Patterns (F(1,38) = 9.052; p < 0.01).An analysis by subtest is presented in Figure 1.
Analyzing both groups, we can notice similar patterns of performance being lowest in the Repeated Patterns subtest, followed by the Sequential Order subtest. For the ASD group, the Form Completion subtest elicited the best performance. Paired-group t-tests revealed that the ASD group’s performance on the Matching subtest is significantly better than that on the Figure-Ground (t(19) = 3.929; p < 0.01), Sequential Order (t(19) = 2.073; p = 0.05) and Repeated Patterns (t(19) = 5.542; p < 0.01) subtests. In contrast, in the control group, only the performance in the Complete Shapes subtest was significantly better than that in the Sequential Order (t(19) = 2.159; p = 0.04) and Repeated Patterns (t(19)=2.396; p = 0.02) subtests.
For the elementary student group, significant differences were found between the ASD and control groups for the Figure-Ground (F(1,38) = 20.571; p < 0.01), Form Completion (F(1,38) = 12.290; p < 0.01), Sequential Order (F(1,38) = 9.001; p < 0.01) and Repeated Patterns (F(1,38) = 11.044; p < 0.01) subtests. The scores on each subtest are compared in Figure 2.
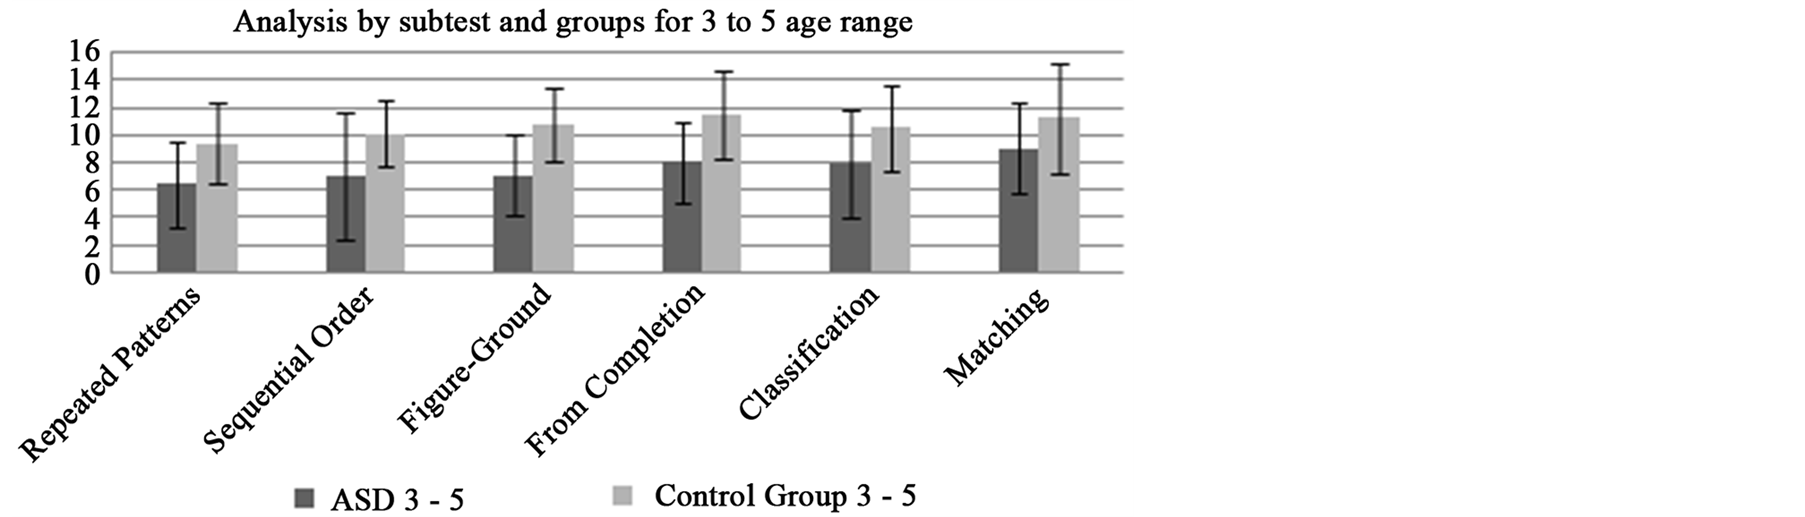
Figure 1. Comparison of the scores of the ASD and control group for each Leiter-R subtest in the age range of 3 to 5 years old.
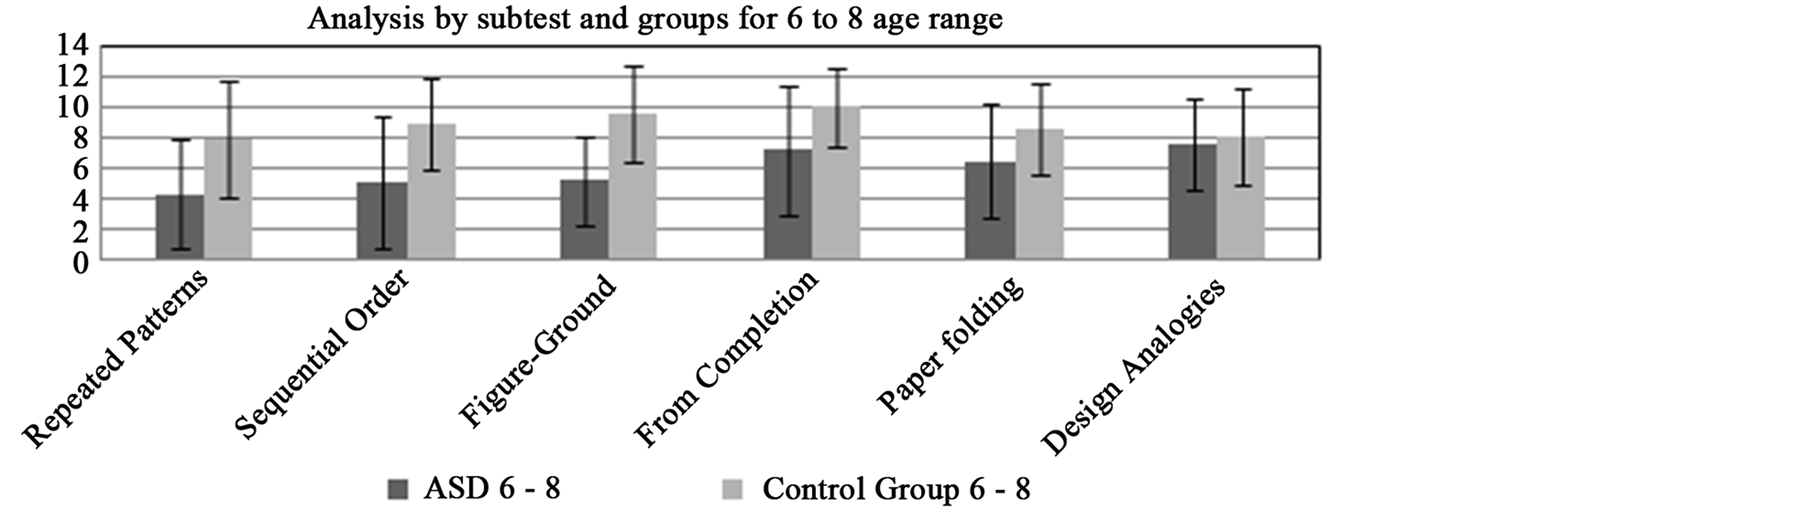
Figure 2. Comparison of the scores of the ASD and control groups for each Leiter-R subtest in the age range of 6 to 8 years.
As shown in the graph, the ASD school age group struggles most with Repeated Patterns, while the Analogies subtest is the easiest. However, for the control group, the easiest subtest is Complete Shapes. Repeated measures t-tests revealed that the performance of the ASD group on the Design Analogies, Form Completion and Paper Folding subtests are significantly better than those on the Repeated Patterns, Sequential Order and FigureGround subtests.
In the control group, performance on the Form Completion subtest was significantly better than that on the Design Analogies, Paper Folding and Repeated Patterns subtests. In addition, the scores on the Repeated Patterns subtest were significantly worse than the Figure-Ground scores. Table 3 presents all descriptive measures, repeated measures t-test results and effect sizes for both elementary school age groups of students.
The results presented in Table 3 indicate that significant differences between subtests occur more often in the ASD group than in the control group. For example, in the ASD group, performance on the Figure Ground subtest is significantly lower than that on the Design Analogies, Form Completion and Paper Folding subtests, showing a moderate effect size. For the ASD group, significant differences were found between the FigureGround and Repeated Patterns subtests, with worst performance on the latter.
Performance in the Design Analogies subtest was significantly better than that in the Figure-Ground, Repeated Patterns and Sequential Order subtests for the ASD group. No significant differences were found between the Design Analogies and Form Completion subtests for the ASD group, unlike the control group. After Design Analogies, the ASD group performed best in the Form Completion subtask, for which score differences were found relative to the Figure-Ground, Sequential Order and Repeated Pattern subtests.
For the control group, significant differences were also found between the Form Completion and Repeated Patterns performances. However, unlike the ASD group, there were significant differences between the Form Completion and Paper Folding performances. Lastly, the ASD group showed better performance in the Paper Folding subtest than the Repeated Patterns subtest. The differences found between subtests in both groups had a moderate effect size with the exception of the ASD group, for which the difference between subtests with extremely different levels of performance (Repeated Patterns and Design Analogies) had a large effect size.
Table 3. Comparison of pairs of subtests by group.
To better understand the performance of individuals with ASD in the Leiter-R, a k-means cluster analysis was conducted. Due to the low number of participants, clustering in two groups was sought. The results reveal that the first group was formed by 17 children, 16 of whom were diagnosed with autism and only one with PDDNOS. The second cluster contained 23 children, 12 with an autism diagnosis, 9 with PDD-NOS and 2 with Asperger syndrome. For this analysis, only the subtests that were shared by all age ranges were included: FigureGround, Form Completion, Sequential Order and Repeated Patterns. In addition to the subtest performance, cluster analysis for total IQ score was also conducted using the standardized score so that all participants could be compared. These results are presented in Table4
The group formed by cluster 2 performed better than the first group for all measures, and the differences were significant, with a large effect size. Considering that the first cluster primarily contained students diagnosed with autism and only one student with PDD-NOS and the second cluster contained some children with autism and PDD-NOS and two children with Asperger syndrome, further analysis was conducted excluding these two children and comparing a group with autism and another with PDD-NOS. The results are described in Table5
There are significant differences between both groups for most of the measures, with the exception of the Figure-Ground subtest. The subtests Sequential Order and Repeated Patterns had a larger effect size than Form Completion and Figure-Ground.
This study also analyzed the correlation of the Leiter-R score with the other measures, including the autism questionnaires, the Vineland scores and four specific domains: communication, daily living skills, socialization and motor development. The Pearson correlation coefficients indicate negative and small effects between Leiter-R score and autism questionnaire results, indicating an inverse relationship between cognitive abilities and symptom severity. However, significant correlations were found with ABC (r = −0.38; p = 0.02) but not ASQ (r = −0.24; p = 0.18).
When adaptive behaviors and Leiter-R scores were compared, a positive, large effect size and significant correlations were found for performance in the communication (r = 0.51; p < 0.01) and daily living skills (r = 0.61; p < 0.01) domains and in the general level of adaptive behavior score (r = 0.63; p < 0.01). No correlation was found between the Leiter-R and Socialization(r = 0.23; p = 0.22) or Motor (r = 0.44; p = 0.09) VABS scores.
Table 4. Comparison of Leiter-R performance between clusters.
Table 5. Comparisons of the Leiter-R scores of the autism and PDD-NOS groups.
4. Discussion
This study aimed to describe the profile of Brazilian children with ASD diagnoses using a nonverbal intelligence measure, the Leiter-R. Internationally, a large number of studies utilize the Leiter-R to assess intelligence of individuals with ASD (Tsatsanis et al., 2003; Kuschner et al., 2007; Dichter et al., 2010; Portoghese et al., 2010; Reed et al., 2011; Scattone et al., 2012; Grondhuis & Mulick, 2013). Furthermore, the literature indicates that assessment measures that offer nonverbal instruction and answers are the most adequate for these individuals (Siegel et al., 1996; Kuschner et al., 2007; Dawson et al., 2007; Grondhuis & Mulick, 2013). However, to date, no study has conducted such a study on the Brazilian population.
The sample of the present study is mostly composed of boys, which is expected because of the prevalence of ASD among these individuals (Fombonne, 2003). Half of the participants are of preschool age, which responds to a need and indicates the relevance cognitive aspects of individuals with ASD in early stages of development (Kuschner et al., 2007), particularly in Brazil. Furthermore, this relevance is associated with the fact that cognitive abilities in preschool children are associated with adaptive behavior (Munson et al., 2008) and thus early identification of a cognitive profile is useful for both diagnostic purposes and establishing and monitoring interventions.
The results of the present study show that individuals with ASD were pervasively more appropriately assessed with Leiter-R than the WISC-III and SON-R. Leiter-R offers nonverbal instruction and response, practice trials and fewer subtests than other assessment tools, such as the Wechsler (Roid & Miller, 1997), which contributes to the ability of ASD individuals to respond to it. The use of gestures also contributes to the assessment of individuals with undeveloped verbal comprehension and expression (Hooper, Hatton, Baranek, Roberts, & Bailey, 2000), as often found in individuals with ASD (APA, 2013). In addition, the simple verbal prompts used in the Leiter-R assessment showed viability and effectiveness (Tsatsanis et al., 2003; Kuschner et al., 2007); for this reason, the use of simple verbal prompts was adopted for this study.
Comparing Leiter-R scores between ASD children and children with typical development, the ASD children struggled more with the tasks that involved exploration, discrimination, identification and spatial manipulation of visual stimuli. Individuals with ASD also showed lower performance in fluid intelligence, such as sequential and inductive reasoning. Preschool children had more difficulties with categorization and semantic association tasks. All of the described results partially corroborate the literature describing individuals with ASD as having difficulties with reasoning (Sequential Order and Repeated Patterns) and categorization (Classification)but strengths in visuo-spatial tasks (Design Analogies and Paper Folding). However, this study found worse results regarding basic visual processing abilities as assessed by Figure-Ground and Form Completion (Klinger & Dawson, 2001; Minshew, Meyer, & Goldstein, 2002; Kuschner et al., 2007; Macedo et al., 2013). These differences can be explained by the use of different methods, standard scores used instead of raw scores, different tasks and control pairing.
The Leiter-R is used to determine IQ and to determine cognitive profiles. The cognitive profile of individuals with ASD was similar over the age span studied and is characterized by lower scores in inductive reasoning, followed by sequential reasoning and visual discrimination, and strengths in the synthesis and manipulation of visuo-spatial stimuli. When we separate the groups by age range, the preschool ASD group exhibited strengths in the ability to pair concrete or abstract stimulibut struggled in tasks that require fluid reasoning, discrimination and selective attention to visual stimuli. The elementary-school-age children were better at manipulating and synthesizing visuo-spatial stimuli than reasoning and discriminative and selective attention to visual stimuli.
The previous literature reported better performance in the Figure-Ground subtest for individuals with ASD (Kuschner et al., 2007), which was not replicated in this study. In this subtest, the individual needs to identify a target picture with distractors in the background. Roid & Miller (1997) indicated that this task includes executive functioning components, as the individuals need to apply selective attention and inhibition control to avoid errors. We hypothesize that the executive function component of this task is the factor influencing performance, which aligns with previous literature describing individuals with autism as having difficulties with executive functioning (Lopez, Lincoln, & Ozonoff, 2005; Corbett, Carmean, & Fein, 2009; Eigsti, 2011).
Overall, the difficulties found in semantic categorization can be explained by a difficulty in central coherence (Plaisted, 2001), while the difficulties in abstract reasoning, which requires global comprehension and maintaining attention to detail, signifies a difficulty in global processing (Minshew et al., 2002). Difficulties in organization and manipulation of information are also consistent and corroborate various studies in the literature (Geurts, Verte, Oosterlaan, Roeyers, & Sergeant, 2004; Williams, Goldstein, & Minshew, 2006). The strengths in pairing also corroborate previous literature findings, showing the ability to categorize based on visual processing (Shulman, Yirmiya, & Greenbaum, 1995). Knowing both the difficulties and strengths of these individuals will allow practitioners to develop intervention plans that can build upon their strengths. For example, new content or a new skill might be taught starting with simple pairing and processing of visual information, followed by more abstract pairing and then more complex organization, manipulation and reasoning strategies.
The differences in performance observed in the different clusters corroborate the literature that shows the heterogeneity of abilities among individuals with ASD diagnoses (Kamp-Becker et al., 2010). The variability of characteristics within the ASD classification can also be observed in the individuals’ cognitive ability, which is one variable responsible for the spectrum of conditions (Munson et al., 2008; Klin, 2009). In addition, the differences found between the children with diagnoses of autism and those with PDD-NOS, according to the DSM-IV-TR (APA, 2000), demonstrates that, despite being grouped in a single diagnosis category (APA, 2013), their ability levels in nonverbal tasks are distinct. For that reason, the American Psychiatric Association (APA, 2013) reports a need for descriptions of intelligence associated with ASD diagnoses, which is aligned with the aims of the present study.
Regarding the association of symptoms in ASD and cognitive performance, the present study corroborates the international literature indicating a negative association between intelligence scores and severity of social and communication deficits as well as restrictive behavior (Szatmari et al., 1990; Mandelbaum et al., 2006). The association in the present study was moderate, and performance in only one of the questionnaires was significantly correlated to cognitive performance. It is important to note that most studies utilize diagnostic instruments for ASD (Mandelbaum et al., 2006), whereas the present study utilized simple screening questionnaires that simply list possible symptoms.
Finally, the present study reports a relevant relationship between cognitive aspects in individuals with ASD and adaptive behaviors. Important correlations were found with communication abilities, including comprehension, expression and writing as well as daily living skills. These findings corroborate previous studies (Szatmari et al., 1990; Tsatsanis et al., 2003) showing the importance and validity of this assessment tool.
5. Conclusion
The current study with Brazilian children corroborates previous findings that indicate a variable cognitive profile for individuals with ASD, even when only considering nonverbal abilities. The cognitive profile of children with ASD is shaped by strengths in visuo-spatial abilities compared to more abstract reasoning abilities, which corroborates the literature and confirms the difference from the profile of typically developing children, who do not exhibit these discrepancies between nonverbal perceptual abilities and abstract reasoning.
The results of the present study emphasize the importance of identifying strengths and weaknesses in ASD and determining subgroups based on cognitive abilities for a better characterization of this heterogenic population of individuals. Further examination is necessary, particularly with a more homogenous group of individuals with intellectual disabilities, such as Down Syndrome, to determine associations and specificities. There is also a need to consider groups paired by mental development and groups containing more individuals to better understand the heterogeneity in this population with ASD, including individuals who in the previous categorization would be in a different category, Asperger syndrome.
This study also contributes to the comprehension of the correlations of cognitive abilities and adaptive behaviors in relation to communication and daily living skills, with direct impact on the practice and everyday routines of these individuals. Overall, the nonverbal cognitive profiles of students with ASD emphasize that interventions need to be tailored to methods that utilize pairing and the manipulation of visuo-spatial abilities to then develop conceptualization and reasoning for problem solving. The results from the present study are important for better understanding, describing and supporting individuals with ASD.
References
- American Psychiatric Association—APA (2000). Diagnostic and Statistical Manual of Mental Disorders—DSM-IV-TR. Washington DC: APA.
- American Psychiatric Association—APA (2013). Diagnostic and Statistical Manual of Mental Disorders—DSM-V. Washington DC: APA.
- Baron-Cohen, S., Leslie, A. M., & Frith, U. (1986). Mechanical, Behavioural, Intentional understanding of Picture Stories in Autistic Children. British Journal of Developmental Psychology, 4, 113-125. http://dx.doi.org/10.1111/j.2044-835X.1986.tb01003.x
- Berument, S. K., Rutter, M., Lord, C., Pickles, A., & Bailey, A. (1999). Autism Screening Questionnaire: Diagnostic Validity. British Journal of Psychiatry, 175, 444-451. http://dx.doi.org/10.1192/bjp.175.5.444
- Braun, K. V. N., Pettygrove, S., Daniels, J., Miller, L., Nicholas, J., Baio, J. et al. (2007). Evaluation of a Methodology for a Collaborative Multiple Source Surveillance Network for Autism Spectrum Disorders—Autism and Developmental Disabilities Monitoring Network, 14 Sites, United States, 2002. MMWR. Surveillance Summaries: Morbidity and Mortality Weekly Report, 56, 29-40.
- Cangialose, A., & Allen, P. J. (2014). Screening for Autism Spectrum Disorders in Infants before 18 Months of Age. Journal of Pediatric Nursing, 40, 33-37.
- Charman, T. (2014). Early Identification and Intervention in Autism Spectrum Disorders: Some Progress but Not as Much as We Hoped. International Journal of Speech-Language Pathology, 16, 15-18. http://dx.doi.org/10.3109/17549507.2013.859732
- Corbett, B. A., Carmean, V. & Fein, D. (2009). Assessment of Neurospychological Functioning in Autism Spectrum Disorders. In S. Goldstein., J. A. Naglieri, & S. Ozonoff (Eds.), Assessment of Autism Spectrum Disorders (pp. 253-289). New York, NY: Guilford Press.
- Dawson, M., Soulieres, I., Gernsbacher, M. A., & Mottron, L. (2007). The Level and Nature of Autistic Intelligence. Psychological Science, 18, 657-662. http://dx.doi.org/10.1111/j.1467-9280.2007.01954.x
- Dias, B. S. (2013). Cognitive Non-Verbal Profile in Autism Spectrum Disorders. The 13th International Meeting for Autism Research, San Sebastian, 66.
- Dichter, G. S., Radonovich, J. K., Turner-Brown, L. M., Lam, K. S. L., Holtzclaw, T. N., & Bodfish, J. W. (2010). Performance of Children with Autism Spectrum Disorders on the Dimension-Change Card Sort Task. Journal of Autism and Developmental Disorders, 40, 448-456. http://dx.doi.org/10.1007/s10803-009-0886-1
- Eigsti, I. (2011). Executive Functions in ASD. In D. A. Fein (Ed.), The Neuropsychology of Autism (pp. 185-203). New York: Oxford University Press.
- Fecteau, S., Lepage, J. F., & Theoret, H. (2006). Autism Spectrum Disorder: Seeing Is Not Understanding. Current Biology, 16, R131-R133. http://dx.doi.org/10.1016/j.cub.2006.02.008
- Fombonne, E. (2003). Epidemiological Surveys of Autism and Other Pervasive Developmental Disorders: An Update. Journal of Autism and Developmental Disorders, 33, 365-382. http://dx.doi.org/10.1023/A:1025054610557
- Geurts, H. M., Verte, S., Oosterlaan, J., Roeyers, H., & Sergeant, J. A. (2004). How Specific Are Executive Functioning Deficits in Attention Deficit Hyperactivity Disorder and Autism? Journal of Child Psychology and Psychiatry, 45, 836-854. http://dx.doi.org/10.1111/j.1469-7610.2004.00276.x
- Gregoire, J. (2000). L’evaluation clinique de l’intelligence de l’enfant: Theorie et pratique Du WISC-III. Liege: Pierre Mardaga.
- Grondhuis, S. N., & Mulick, J. A. (2013). Comparison of the Leiter International Performance Scale-Revised and the Stanford-Binet Intelligence Scales, in Children with Autism Spectrum Disorders. American Journal on Intellectual and Developmental Disabilities, 118, 44-54. http://dx.doi.org/10.1352/1944-7558-118.1.44
- Happe, F., & Frith, U. (1996). The Neuropsychology of Autism. Brain, 119, 1377-1400.http://dx.doi.org/10.1093/brain/119.4.1377
- Hooper, S. R., Hatton, D. D., Baranek, G. T., Roberts, J. P., & Bailey Jr., D. B. (2000). Nonverbal Assessment of IQ, Attention, and Memory Abilities in Children with Fragile-X Syndrome Using the Leiter-R. Journal of Psychoeducational Assessment, 18, 255-267. http://dx.doi.org/10.1177/073428290001800305
- Hurley, A. D., & Levitas, A. S. (2007). The Importance of Recognizing Autism Spectrum Disorders in Intellectual Disability. Mental Health Aspects of Developmental Disabilities, 10, 157-161.
- Joseph, R. M. (2011). The Significance of IQ and Differential Cognitive Abilities for Understanding ASD. In D. A. Fein (Ed.), The Neuropsychology of Autism (pp. 281-294). New York: Oxford University Press.
- Klin, A. (2009). Subtyping the Autism Spectrum Disorders: Theoretical, Research and Clinical Considerations. In S. Goldstein., J. A. Naglieri, & S. Ozonoff (Eds.), Assessment of Autism Spectrum Disorders (pp. 91-116). New York: Guilford Press.
- Klinger, L. G., & Dawson, G. (2001). Prototype Formation in Autism. Development and Psychopathology, 13, 111-124.http://dx.doi.org/10.1017/S0954579401001080
- Klinger, L. G., O’Kelley, S. E., & Mussey, J. L. (2009). Assessment of Intellectual Functioning in Autism Spectrum Disorders. In S. Goldstein, J. A. Naglieri, & S. Ozonoff (Eds.), Assessment of Autism Spectrum Disorders (pp. 209-252). New York: Guilford Press.
- Krug, D., Arick, J., & Almond, P. (1980). Behavior Checklist for Identifying Severely Handicapped Individuals with High Levels of Autistic Behavior. Journal of Child Psychology and Psychiatry, 21, 221-229. http://dx.doi.org/10.1111/j.1469-7610.1980.tb01797.x
- Kuschner, E. S., Bennetto, L., & Yost, K. (2007). Patterns of Nonverbal Cognitive Functioning in Young Children with Autism Spectrum Disorders. Journal of Autism and Developmental Disorders, 37, 795-807. http://dx.doi.org/10.1007/s10803-006-0209-8
- Laros, J. A., Jesus, G. R., & Karino, C. A. (2013). Brazilian Validation of the Nonverbal Intelligence Test SON-R 21/2-7[a]. Avaliacao Psicologica, 12, 233-242.
- Lopez, B. R., Lincoln, A. J., Ozonoff, S. Z., & Lai, Z. (2005). Examining the Relationship between Executive Functions and Restricted, Repetitive Symptoms of Autistic Disorder. Journal of Autism and Developmental Disorders, 35, 445-460. http://dx.doi.org/10.1007/s10803-005-5035-x
- Macedo, E. C., Mecca, T. P., Valentini, F., Laros, J. A., Lima, R. M. F., & Schwartzman, J. S. (2013). Using the Nonverbal Test SON-R 21/2-7[a] to Assess Children with Autism Spectrum Disorders. Revista Educacao Especial, 26, 603-618.
- Mandelbaum, D. E., Stevens, M., Rosenberg, E., Wiznitzer, M., Steinschneider, M., Filipek, P. et al. (2006). Sensorimotor Performance in School-Age Children with Autism, Developmental Language Disorder, or Low IQ. Developmental Medicine and Child Neurology, 48, 33-39. http://dx.doi.org/10.1017/S0012162206000089
- Marteleto, M. R., & Pedromonico, M. R. (2005). Validity of Autism Behavior Checklist (ABC): Preliminary Study. Revista Brasileira de Psiquiatria, 27, 295-301. http://dx.doi.org/10.1590/S1516-44462005000400008
- Mecca, T. P. (2010). Translation, Adaptation, Reliability and Validity Evidence of the Visualization and Reasoning Battery of the Leiter International Performance Scale-Revised. Master Dissertation, Sao Paulo: Mackenzie University.
- Mecca, T. P. (2013). Study of the Psychometric Properties of Visualization and Reasoning Battery of the Leiter-R in Children between 2 and 8 Years of Age and in Individuals with Developmental Disorders. Ph.D. Thesis, Sao Paulo: Mackenzie University.
- Mecca, T. P., Antonio, D. A. M., Seabra, A. G., & Macedo, E. C. (2014) Psychometric Parameters of the Leiter-R International Performance Scale for Preschool Children. Avaliacao Psicologica, 13, 125-132.
- Minshew, N. J., Meyer, J., & Goldstein, G. (2002). Abstract Reasoning in Autism: A Diassociation between Concept Formation and Concept Identification. Neuropsychology, 16, 327-334. http://dx.doi.org/10.1037/0894-4105.16.3.327
- Munson, J., Dawson, G., Sterling, L., Beauchaine, T., Zhou, A., Koehler, E. et al. (2008). Evidence for Latent Classes of IQ in Young Children with Autism Spectrum Disorder. American Journal on Mental Retardation, 113, 439-452.http://dx.doi.org/10.1352/2008.113:439-452
- Penn, H. E. (2006). Neurobiological Correlates of Autism: A Review of Recent Research. Child Neuropsychology, 12, 57-79. http://dx.doi.org/10.1080/09297040500253546
- Plaisted, K. C. (2001). Reduced Generalization in Autism: An Alternative to Weak Central Coherence. In J. A. Burack, & T. Charman (Eds.), The Development of Autism: Perspectives from Theory and Research (pp. 139-169). Mahwah, NJ: Lawrence Erlbaum Associates.
- Portoghese, C., Buttiglione, M., De Giacomo, A., Lafortezza, M., Lecce, P. A., Martinelli, D. et al. (2010). Leiter-R versus Developmental Quotient for Estimating Cognitive Function in Preschoolers with Pervasive Developmental Disorders. Neuropsychiatric Disease and Treatment, 6, 337-342.
- Reed, P., Watts, H., & Truzoli, R. (2011). Flexibility in Young People with Autism Spectrum Disorders on a Card Sort Task. Autism, 7, 162-171.
- Roid, G. H., & Miller, L. J. (1997). Leiter International Performance Scale-Revised. Wood Dale, IL: Stoelting.
- Sato, F., Paula, C. S., Lowenthal, R., Nakano, E. Y., Brunoni, D., Schwartzman, J. S., & Mercadante, M. T. (2009). Instrument to Screen Cases of Pervasive Developmental Disorder: A Preliminary Indication of Validity. Revista Brasileira de Psiquiatria, 31, 30-33. http://dx.doi.org/10.1590/S1516-44462009000100008
- Scattone, D., Raggio, D. J., & May, W. (2012). Brief Report: Concurrent Validity of the Leiter-R and KBIT-2 Scales of Nonverbal Intelligence for Children with Autism and Language Impairments. Journal of Autism and Developmental Disorders, 42, 2486-2490. http://dx.doi.org/10.1007/s10803-012-1495-y
- Shah, A., & Holmes, N. (1985).The Use of the Leiter International Performance Scale with Autistic Children. Journal of Autism and Developmental Disorders, 15, 195-203. http://dx.doi.org/10.1007/BF01531605
- Shulman, C., Yirmiya, N., & Greenbaum, C. W. (1995). From Categorization to Classification: A Comparison among Individuals with Autism, Mental Retardation, and Normal Development. Journal of Abnormal Psychology, 104, 601-609.http://dx.doi.org/10.1037/0021-843X.104.4.601
- Siegel, D. J., Minshew, N. J., & Goldstein, G. (1996). Wechsler IQ Profiles in Diagnosis of High-Functioning Autism. Journal of Autism and Developmental Disorders, 26, 389-406. http://dx.doi.org/10.1007/BF02172825
- Simoes, M. R. (2002). Uses of the WISC-III in the Assessment Neuropsychological of Children It Is Adolescent. Paideia (Ribeirao Preto), 12, 113-132.
- Sparrow, S. S., Balla, D. A., & Ciccheti, D. V. (1984). Vineland Adaptative Behaviour Scales. Circle Pines, MN: American Guidance Service.
- Szatmari, P., Tuff, L., Finlayson, M. A., & Bartolucci, G. (1990). Asperger’s Syndrome and Autism: Neurocognitive Aspects. Journal of the American Academy of Child and Adolescent Psychiatry, 29, 130-136. http://dx.doi.org/10.1097/00004583-199001000-00021
- Tsatsanis, K. D., Dartnall, N., Cicchetti, D., Sparrow, S. S., Klin, A., & Volkmar, F. R. (2003) Concurrent Validity and Classification Accuracy of the Leiter and Leiter-R in Low-Functioning Children with Autism. Journal of Autism and Developmental Disorders, 33, 23-30. http://dx.doi.org/10.1023/A:1022274219808
- Wechsler, D. (1991). Wechsler Intelligence Scale for Children (3rd ed.). (WISC-III): Manual. San Antonio, TX: The Psychological Corporation.
- Wechsler, D. (2003). Wechsler Intelligence Scale for Children (4th ed.). (WISC-IV): Manual. San Antonio, TX: The Psychological Corporation.
- Williams, D., Goldstein, G., & Minshew, N. (2006). The Profile of Memory Function in Children with Autism. Neuropsychology, 20, 21-29. http://dx.doi.org/10.1037/0894-4105.20.1.21