Journal of Environmental Protection
Vol. 4 No. 8A1 (2013) , Article ID: 35729 , 9 pages DOI:10.4236/jep.2013.48A1010
Measurement of Emissions from a Passenger Truck Fueled with Biodiesel from Different Feedstocks
![]()
1Automotive Air Pollution Division, Pollution Control Department, Bangkok, Thailand; 2Department of Civil Engineering, The University of Texas at Arlington, Arlington, USA; 3Department of Mechanical and Aerospace Engineering, The University of Texas at Arlington, Arlington, USA; 4Department of Industrial and Manufacturing Systems Engineering, The University of Texas at Arlington, Arlington, USA; 5International Council on Clean Transportation, Washington DC, USA
Email: sattler@uta.edu
Copyright © 2013 Natchanok Pala-En et al. This is an open access article distributed under the Creative Commons Attribution License, which permits unrestricted use, distribution, and reproduction in any medium, provided the original work is properly cited.
Received May 17th, 2013; revised June 19th, 2013; accepted July 25th, 2013
Keywords: Alternative Fuel; Biodiesel; Diesel; Emissions; On-Road Testing; Portable Emission Measurement System (PEMS); Dynamometer
ABSTRACT
Biodiesel has generated increased interest recently as an alternative to petroleum-derived diesel. Due to its high oxygen content, biodiesel typically burns more completely than petroleum diesel, and thus has lower emissions of hydrocarbons (HC), carbon monoxide (CO), and particulate matter (PM). However, biodiesel may increase or decrease nitrogen oxide (NOx) and carbon dioxide (CO2) emissions, depending on biodiesel feedstock, engine type, and test cycle. The purpose of this study was to compare emissions from 20% blends of biodiesel made from 4 feedstocks (soybean oil, canola oil, waste cooking oil, and animal fat) with emissions from ultra low sulfur diesel (ULSD). Emissions of NOx and CO2 were made under real-world driving conditions using a Horiba On-Board Measurement System OBS-1300 on a highway route and arterial route; emissions of NOx, CO2, HC, CO, and PM were measured in a controlled setting using a chassis dynamometer with Urban Dynamometer Drive Schedule. Dynamometer test results showed statistically significant lower emissions of HC, CO, and PM from all B20 blends compared to ULSD. For CO2, both on-road testing (arterial, highway, and idling) and dynamometer testing showed no statistically significant difference in emissions among the B20 blends and ULSD. For NOx, dynamometer testing showed only B20 from soybean oil to have statistically significant higher emissions. This is generally consistent with the on-road testing, which showed no statistically significant difference in NOx emissions between ULSD and the B20 blends.
1. Introduction
As global population increases and developing countries industrialize, energy demand around the world is increasing markedly. World energy consumption is expected to increase by 50% by 2020 [1]. According to the Energy Information Administration’s (EIA’s) International Energy Outlook, world demand for crude oil is expected to grow from 84 million barrels/day in 2005 to over 114 million barrels/day in 2030 [2].
Biodiesel has generated increased interest in the US and elsewhere recently as an alternative to petroleumderived diesel. Because it can be produced from domestic natural sources such as soybeans, canola, and recycled cooking oil, biodiesel can help reduce dependence on petroleum fuel from foreign sources, and thus foster energy independence [3]. Due to its high oxygen content, biodiesel typically burns more completely than petroleum diesel, and thus has lower emissions of hydrocarbons (HC), carbon monoxide (CO), and particulate matter. Since biodiesel is essentially free of sulfur, SO2 emissions are negligible. However, a B20 blend of biodiesel may increase or decrease nitrogen oxide (NOx) emissions (from +12% to −13%) and carbon dioxide (CO2) emissions (from +1% to −67%), depending on biodiesel feedstock, engine type, and test cycle [3-7].
Biodiesel feedstocks that reduce NOx would be beneficial to US regions facing problems with ground-level ozone, fine particulates, and/or acid precipitation. From the viewpoint of climate change, all regions should avoid biodiesel from feedstocks that increase CO2 emissions. Therefore, determining which biodiesel feedstocks increase and decrease NOx and CO2 emissions is important.
Various studies have compared NOX emissions from biodiesel from one feedstock with those from petroleum diesel, based on chassis or engine dynamometer testing [7-10]. Several additional studies of NOx emissions from one biodiesel feedstock have involved on-road or in-use testing [11-14]. Comparing emissions from various feedstocks across studies can be difficult due to different engines and testing protocols.
Various studies [5,6,8,15-20] have compared NOx emissions from multiple biodiesel feedstocks using the same engine and testing protocol with either engine or chassis dyno testing. None involved on-road testing. None of the studies looked at NOx emissions from biodiesel from animal fat, which is potentially important as a waste product source that would not compete with food crops.
For a given engine type, the amount of CO2 produced should correlate with the fuel carbon content, which would vary with feedstock. Various studies have compared CO2 emissions from biodiesel from one feedstock with those from petroleum diesel, based on chassis or engine dyno testing [7-9,21,22]. Several additional studies of CO2 emissions from one biodiesel feedstock have involved on-road testing [12,14]. As for NOx, comparing CO2 emissions from various feedstocks across studies can be difficult due to different engines and testing protocols.
A few studies [8,17,18,23] have compared CO2 emissions from biodiesel from multiple feedstocks using the same engine and testing protocol, using chassis or dyno testing. None involved on-road testing. None of the studies looked at CO2 emissions from biodiesel from animal fat.
The study described in this paper aimed to go beyond previous studies of NOx and CO2 emissions from multiple biodiesel feedstocks, in terms of test conditions and feedstocks, by: 1) involving more test states/cycles/conditions (on-road arterial, on-road highway, steady-state idling, and chassis dynamometer testing), and 2) by including feedstocks previously untested (canola for NOx and animal fat for NOx and CO2).
2. Methodology
2.1. Biodiesel Feedstocks, Blends, and Fuel Properties
Biodiesel from soybean oil, canola oil, waste cooking oil, and animal fat was tested. Soybean and canola oil were selected to represent biodiesel made from vegetable oil. Soybean oil is the primary feedstock in the US because the U.S. is the largest producer of soybean oil. Biodiesel made from non-food crops is called “second generation” biodiesel, and is increasingly emphasized so that it does not compete with food as an end-use of crops. Waste cooking oil and animal fat biodiesel were included as examples of second generation biodiesel feedstocks. B20 (biodiesel blended with 20% with ultra low sulfur diesel, or ULSD) was tested, because such blends can be used in existing engines without modification [16]. ULSD was tested as a baseline fuel.
Biodiesel from soybean, canola, and waste cooking oil were produced at the Mechanical and Aerospace Engineering Laboratory at UT Arlington. Details of the transesterification method can be found in Pala-En (2012) [24]. Animal fat biodiesel was from Houston Biodiesel. Iowa Central Fuel Testing Laboratory measured physical/chemical properties of ULSD (ASTM D 975) and B20 blends (ASTM D 7467). C, H, O, N content was measured by Intertek QTI.
2.2. Test Vehicle
The test vehicle was a 1994 diesel Chevy C/K 2500 3/4 ton pickup truck, with an extended cab and long bed, which is owned by the UT Arlington research group. Information about the vehicle is given in Table 1.
2.3. On-Road Testing Equipment
Emissions were measured as the vehicle travelled onroad using a Horiba On-Board emission measurement System OBS-1300. NOx and CO2 concentrations were measured second-by-second, along with vehicle velocity and exhaust temperature, pressure, and flow rate. The OBS-1300 system consists of a MEXA-720 NOx analyzer, a MEXA-1170 HNDIR analyzer, 2 12 V deep cycle batteries and power supply unit to convert DC to AC, a data logger PC and other accessories. The MEXA-720 NOx analyzer is a non-sampling type zirconium sensor that measures NOx concentrations, with accuracy ±3.3 ppm. The NOx sensor probe is attached to the tail pipe. The HNDIR analyzer, used to measure CO2, has a heated tube attached to the tail pipe, which takes in the sample for analysis. According to the manufacturer, accuracy for the CO2 emission measurements was ±0.3%. A GPS unit is provided log vehicle position as a function of time. Differences in vehicle position with time were used to calculate vehicle velocity; differences in vehicle velocity
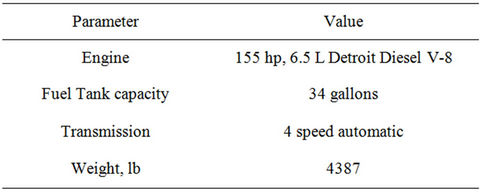
Table 1. Specifications of test vehicle.
with time were used to calculate vehicle acceleration. Routine instrument calibrations and warm up were carried out each day before the start of each session of data collection. The sensor was also calibrated weekly as required by the protocol. Maintenance and diagnostic procedures were conducted as required.
2.4. On-Road Testing Procedure
For each biodiesel blend, 1.5 hours of highway testing and 1.5 hours of arterial testing were conducted during off-peak weekday hours (9 a.m.-4 p.m.). Off-peak hours were used so that traffic flow patterns would be more similar among runs. As shown in Figure 1, the arterial test route was 6.5 miles, centered on UT Arlington, and the highway test route was 50 miles, centered on the City of Arlington. In addition, 15 minutes of idling data were collected for each fuel. The driver was the same for all testing, to eliminate variability associated with different driving habits. The truck was warmed up prior to data collection to avoid cold-start conditions.
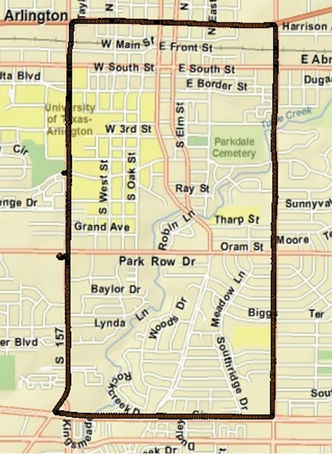

Figure 1. Routes for on-road testing (arterial route at top, highway route at bottom).
The order of testing of each fuel and route was randomly chosen to reduce systematic error and bias conditions. Each B20 blend and route was tested with 2 replications, in the order shown in Table 2. The fuel tank was drained between runs.
2.5. Dynamometer Testing Procedure
Chassis dynamometer testing was conducted at the University of Houston’s Texas Diesel Testing and Research Center using a 500 HP AC chassis dynamometer (Burke Porter, model 6356 - 6419). The Urban Dynamometer Drive Schedule (UDDS), shown in Figure 2, was selected as it simulates a combination of low speed and idling as well as high speed and high acceleration driving. The driving cycle test consisted of:
1) Vehicle fuel system purge with the fuel to be tested;
2) Vehicle warm-up;
3) Set of three repeated runs, with a 20-minute soaking period between runs.
The ambient temperature was controlled at 23˚C - 25˚C. Emissions of NOx, total hydrocarbons (THC), CO, CO2 and oxygen (O2) were analyzed by a five gas analytical bench (Horiba, MEXA 7100). PM was collected and measured using filtration capture and gravimetric method. Fuel consumption data were collected from direct gravimetric measurement, and emission carbon balance inference.
3. Results
3.1. Fuel Properties
Table 3 (at end) compares properties of biodiesel fuel from different feedstocks with ULSD fuel. Viscosity is important due to the potential of high viscosity to adversely affect fuel injection [16]. None of the viscosities
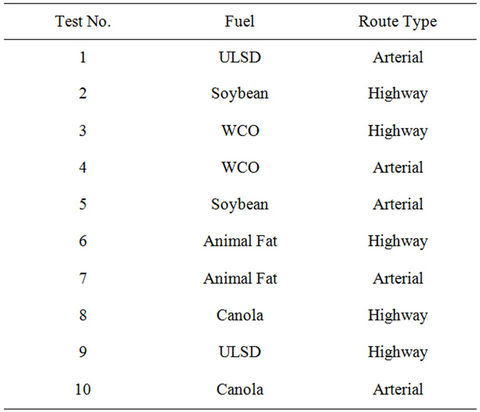
Table 2. On-road testing order.
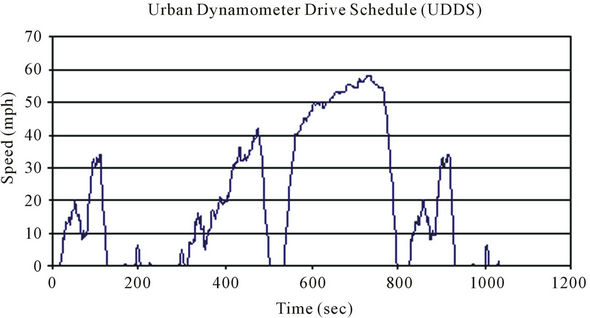
Figure 2. Urban dynamometer drive schedule (UDDS).
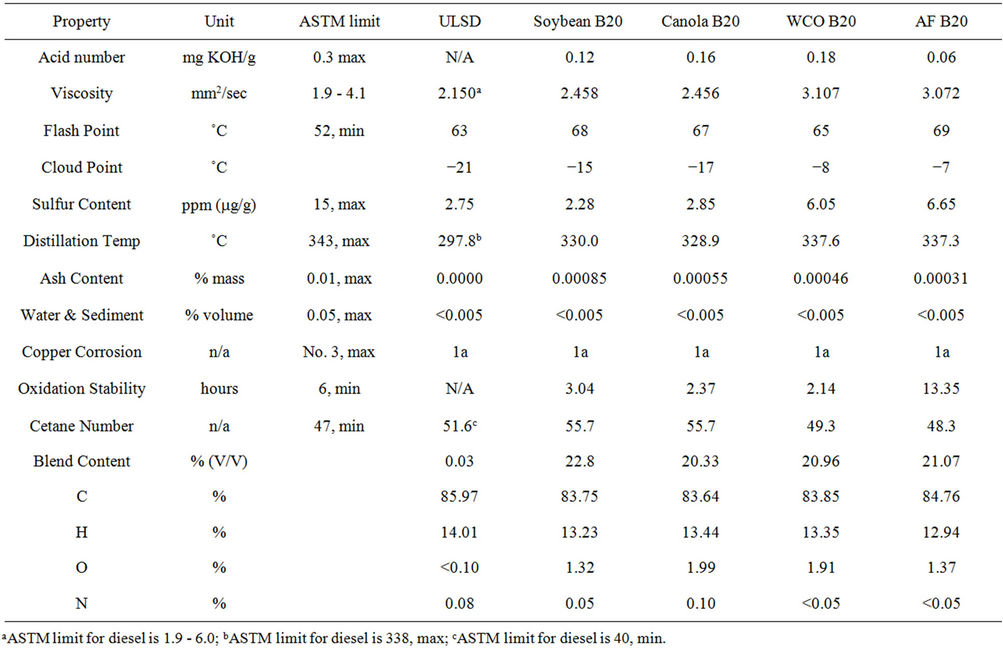
Table 3. Fuel properties of ultra low-sulfur diesel and biodiesel blends from 4 feedstocks.
of the B20 blends exceed the ASTM D7467 limit.
Flash point is the lowest temperature at which a substance vaporizes to form an ignitable mixture in air; higher flash points are advantageous from a safety perspective. Table 3 shows that ULSD has the lowest flash point (63˚C), while B20 blends of animal fat, soybean oil, canola, and waste cooking oil have higher flash points (69˚C, 68˚C, 67˚C, and 65˚C, respectively).
ASTM protocol requires cloud point testing for biodiesel fuel, but there is not a specific limit. Below the cloud point temperature, wax solidifies in diesel and can clog fuel filters and injectors in engines. Thus, a lower cloud point is preferable. Table 3 shows that the biodiesel blends all had higher flash points than ULSD.
Fuels with high sulfur content produce higher sulfur dioxide emissions. To meet requirements for ultra-low sulfur diesel, a fuel’s sulfur content must be £15 ppm. The sulfur content for all 4 B20 blends was less than 15 ppm, qualifying them as ultra-low sulfur diesel fuels.
Cetane number measures how easily a fuel ignites under compression; a higher cetane number means easier ignition and a shorter ignition delay time. Molecules with longer chain lengths or higher degrees of saturation have higher cetane numbers. Molecules with higher degrees of saturation tend to have lower NOx emissions for several reasons [3]:
• The shorter ignition delay time means less time for the reactants (fuel and oxygen) to preheat, which lowers flame temperature and lowers NOx emissions according to the Zeldovich mechanism.
• Molecules with higher degrees of saturation have lower adiabatic flame temperatures, due to lack of high-energy double bonds; this produce less NOx according to the Zeldovich mechanism.
• The double bonds of unsaturated molecules may cause higher levels of certain hydrocarbon radicals in the fuel-rich zone of the diesel spray, which increases formation of prompt NOx.
Several researchers have thus found that the higher cetane number of biofuels leads to a decrease in NOx emissions for B20 blends [4,15]. According to Table 3, vegetable oil biodiesel B20 (both soybean and canola) has the highest cetane number (55.7). WCO B20 and animal fat B20 have cetane numbers (49.3 and 48.3, respectively) lower than ULSD (51.6).
The oxygen content of biodiesel fuel is typically higher than that for regular petroleum diesel, leading to more complete combustion and lower emissions of CO, HC, and PM. Table 3 shows that B20 from canola has the highest oxygen content (1.99%); other B20 blends of waste cooking oil, animal fat, and soybean oil have oxygen contents of 1.91, 1.37, and 1.32%, respectively, which are higher than for ULSD (<0.10%).
ULSD has higher carbon and hydrogen contents than the biodiesel blends. Higher carbon content may mean that ULSD will emit greater CO2 emissions. ULSD has lower nitrogen content than the B20 blends. This is likely not significant in terms of NOx emissions, since thermal NOx emissions typically dominate for diesel fuel.
Other properties of the biodiesel fuel blends such as acid number, distillation temperature, ash content, water and sediment, and copper corrosion do not exceed the ASTM standards. The only biodiesel property which did not meet ASTM standards was oxidation stability, for 3 of the 4 B20 blends. Only animal fat B20 met the ASTM standard.
3.2. On-Road Testing
Example emission traces for on-road measurement of NOx and CO2 are shown in Figures 3 and 4, respectively. Emission test results for the arterial route, highway route and idling testing are shown in Tables 4-6, respectively. Tables 4 and 5 show averages of duplicate runs, with standard deviations in parentheses. Analysis of Variance (ANOVA) F-tests were conducted to determine whether emission means were statistically different; p-values for the tests are given in Tables 4-6. Details of the statistical analysis are provided in Pala-En (2012) [24]; results are summarized below.
To a 95% level of confidence, no difference was detected in mean NOx emissions for the different fuel types for the arterial route, despite their differences in cetane numbers; similarly, no difference was detected in mean NOx emissions for the different fuel types for the highway route or for idling. Similarly, to a 95% level of confidence, the 3 F-tests for arterial route, highway route, and for idling detected no difference in mean CO2 emissions for the different fuel types.
To a 95% level of confidence, emissions from the arterial route were higher than those from the highway route for both NOx and CO2 (p = 0.0011) for all types of B20 and ULSD, by amounts ranging from 13% - 80%. This may be due to the engine operating more efficiently at highway speeds. The average speed of arterial route was about 25 mph, while the highway route average speed was about 55 mph. In addition, more accelerations typically occur on arterial routes; the acceleration mode has been shown to produce higher emissions than cruise mode [25].
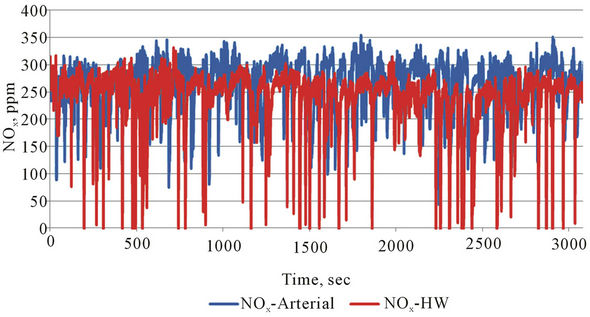
Figure 3. NOx from on-road testing of soybean B20 for arterial and highway routes.
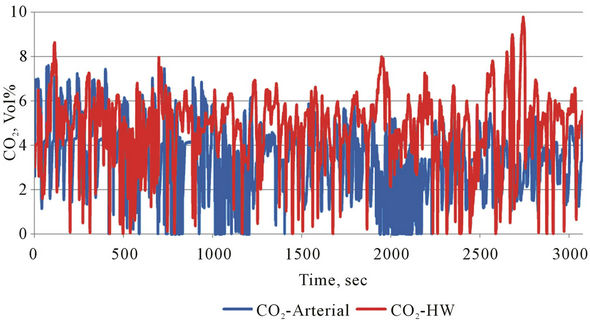
Figure 4. CO2 from on-road testing of soybean B20 for arterial and highway routes.
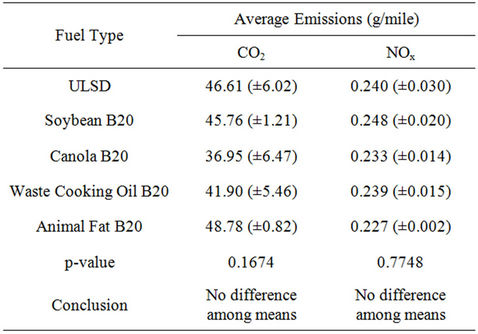
Table 4. On-road testing results—arterial route.
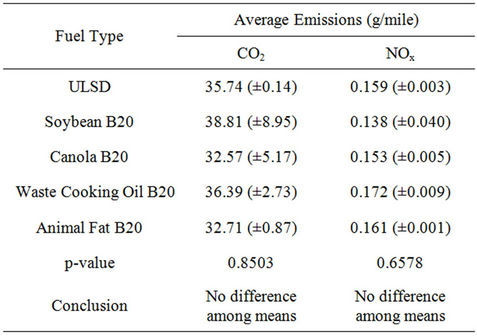
Table 5. On-road testing results—highway rout.
Compared to the dynamometer results discussed in the next section, the on-road CO2 values are about a factor of 20 lower, and the NOx values are around a factor of 30 lower. For dynamometer testing, load had to be added to the vehicle to meet the minimum weight requirement; however, this would not account for all of the difference in the emission values between the on-road and dynamometer testing. The OBS-1300 had been recently re-
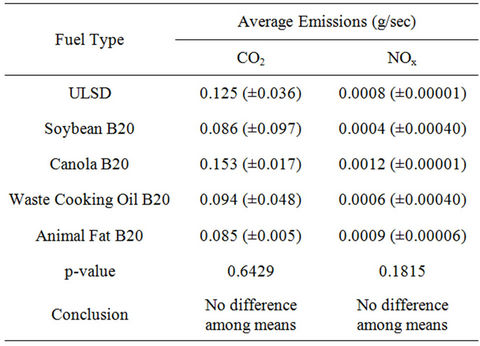
Table 6. Idling test results.
paired prior to testing; although the instrument was calibrated regularly during the testing period, it was likely still reading low. Assuming that the instrument was reading low to the same degree throughout the testing, the relative comparisons between arterial and highway runs and among fuel types would still be valid.
3.3. Dynamometer Testing
Example emission traces for NOx and CO2 for dynamometer testing are shown in Figures 5 and 6, respectively. Table 7 (at end) shows average dynamometer emissions test results for 3 replications of each fuel. The magnitude of emissions from dynamometer testing is much greater than those from on-road testing. The test results are not directly comparable, because the vehicle load was different. For dynamometer testing, load was added to the vehicle to achieve 6000 lbs, to meet the minimum requirement of the laboratory equipment.
As for on-road testing, ANOVA tests were conducted to a 95% level of confidence to determine whether emission means were statistically different. Prior to conducting each ANOVA test, checks for constant variance and normal distribution of residuals were conducted; data transformations were executed when necessary. For each of the 5 pollutants (NOx, CO2, CO, HC, and PM), as well as fuel economy, the ANOVA test detected differences among mean emissions for the different fuel types; thus, pairwise comparisons of means were conducted for each pollutant and fuel economy using Dunnett’s T test and Tukey’s method, both to a 95% level of confidence. P-values of the tests are shown in Table 7. Details of the statistical analysis are provided in Pala-En (2012); results are summarized below.
Nitrogen Oxides. Both Dunnett’s T-test and Tukey’s method showed a statistically significant difference in NOx emissions between soybean B20 and ULSD, but not between the other biodiesel blends and ULSD, or between the other biodiesel blends themselves. These results are surprising in light of the fact that soybean B20 had a higher cetane number than ULSD, and would have thus been expected to produce lower NOx emissions.
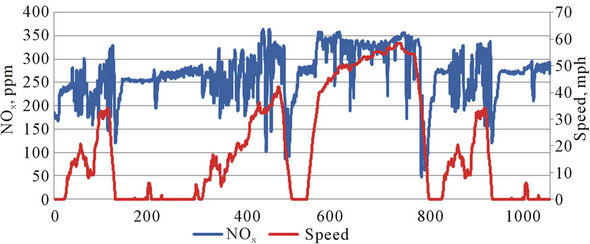
Figure 5. NOx from UDDS driving cycle for canola B20.
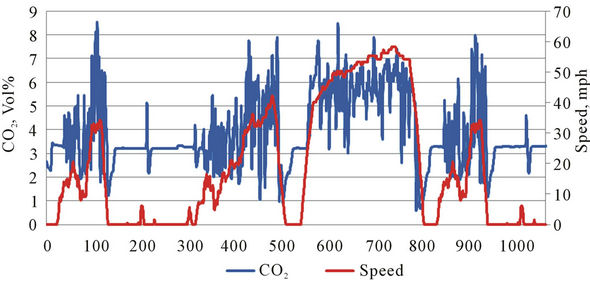
Figure 6. CO2 from UDDS driving cycle for canola B20.
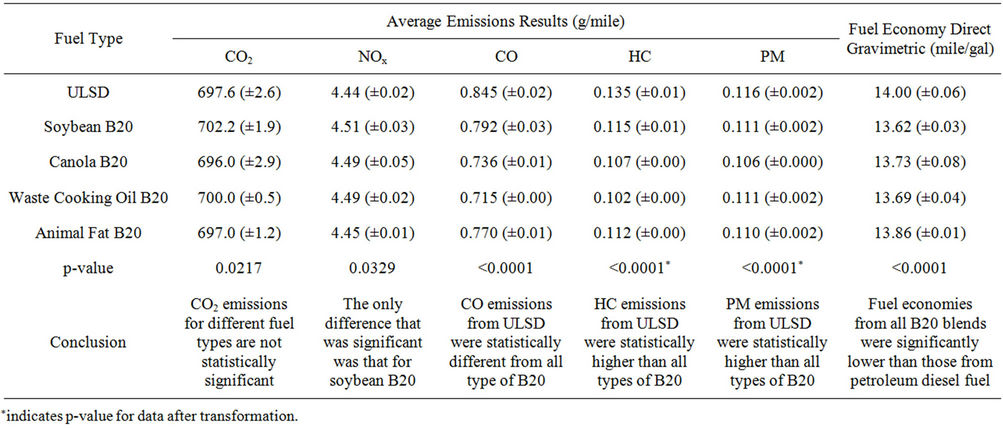
Table 7. Data from chassis dynamometer tests with urban dynamometer drive schedule.
With the exception of the higher emissions for soybean B20, these results are consistent with our on-road testing results, which showed no statistically significant difference between NOx emissions from ULSD and the B20 blends.
Carbon Dioxide. Dunnett’s T-test showed that differences in CO2 emissions between the B20 blends and ULSD were not statistically significant. Tukey’s method showed that soybean B20 CO2 emissions were significantly higher than those for canola B20.
Carbon Monoxide. Dunnett’s T test showed CO emissions for all B20 blends to be significantly lower than those for ULSD. These results are surprising, given that only canola B20 had higher oxygen content than ULSD. Since CO results from incomplete combustion, higher oxygen content typically lowers CO emissions by producing more complete combustion. Tukey’s method showed that CO emissions from soybean B20 were significantly higher than canola and WCO B20, and CO emissions from animal fat B20 were significantly higher than WCO B20.
Hydrocarbons (HC). Dunnett’s T test showed that HC emissions for all B20 blends are significantly lower than those for ULSD. Again, these results are surprising given the oxygen content results. Tukey’s method showed that the HC emissions from soybean and AF B20 were statistically higher than WCO B20.
Particulate Matter. Dunnett’s T test showed that PM emissions for all B20 blends are significantly lower than those for ULSD, which is surprising given the oxygen content results. Tukey’s method showed that among the 4 types of B20, only PM emissions from canola B20 were significantly lower than those from the other 3 types.
Fuel Economy. Dunnett’s T test and Tukey’s method showed that fuel economies from all B20 blends were significantly lower than those from petroleum diesel fuel. This is consistent with the results from other studies, which show that fuel economy from biodiesel is typically a few percent lower than that from regular diesel, by amounts ranging from 1% to 2.7%. Among the B20 blends in terms of fuel economy, there were no statistically significant differences.
4. Conclusions
From the 1994 Chevy Silverado test, the following conclusions can be drawn:
• Emissions from the on-road arterial route were higher than those from the highway route at a 95% level of confidence for both CO2 and NOx for all types of B20 and ULSD.
• For CO2, on-road testing (arterial, highway, and idling) and dynamometer testing showed no statistically significant difference in emissions among the B20 blends and ULSD, with the exception of the difference between soybean B20 and canola B20 for dynamometer testing.
• For NOx, dynamometer testing showed only B20 from soybean oil to have statistically significant higher emissions. This was generally consistent with the on-road testing (arterial, highway, and idling), which showed no statistically significant difference in NOx emissions between ULSD and the B20 blends.
• According to dynamometer test results:
○ CO emissions for all B20 blends were significantly lower than those for ULSD. CO emissions from soybean B20 were significantly higher than canola and WCO B20, and CO emissions from animal fat B20 were significantly higher than WCO B20, to a 95% level of confidence.
○ HC emissions for all B20 blends were significantly lower than those for ULSD. The HC emissions from soybean and animal fat B20 were statistically higher than WCO B20.
○ PM emissions for all B20 blends are significantly lower than those for ULSD. PM emissions from canola B20 were significantly lower than for the other B20 blends.
○ Fuel economies from all B20 blends were significantly lower than those from petroleum diesel fuel, to a 95% level of confidence. Among the B20 blends in terms of fuel economy, there were no statistically significant differences.
5. Acknowledgements
The authors would like to acknowledge funding from Royal Thai Government Scholarships; Mr. Curtis Adams and colleagues from Office of Facilities Management, The University of Texas at Arlington; and staff from the University of Houston’s Texas Diesel Testing and Research Center.
REFERENCES
- S. Fernando, H. Chris and S. Jha, “NOx Reduction from Biodiesel Fuels,” Energy & Fuels, Vol. 20, No. 1, 2006, pp. 376-382. doi:10.1021/ef050202m
- US Department of Energy, Energy Information Administration, Forecast and Analysis of Energy Data, “International Energy Outlook 2008,” Report DOE/EIA-0484, 2008. http://www.eia.doe.gov/oiaf/ieo/oil.html
- G. A. Ban-Weiss, J. Y. Chen, B. A. Buchholz and R. W. Dibble, “A Numerical Investigation into the Anomalous Slight NOx Increase When Burning Biodiesel; A New (Old) Theory,” Fuel Processing Technology, Vol. 88, No. 7, 2007, pp. 659-667. doi:10.1016/j.fuproc.2007.01.007
- R. L. McCormick, “NREL Final Report. SR-510-31465,” 2003.
- G. Karavalakis, S. Stournas and E. Bakeas, “Light Vehicle Regulated and Unregulated Emissions from Different Biodiesels,” Science of the Total Environment, Vol. 407, No. 10, 2009, pp. 3338-3346. doi:10.1016/j.scitotenv.2008.12.063
- C. L. Peterson, J. S. Taberski, J. C. Thompson and C. L. Chase, “The Effect of Biodiesel Feedstock on Regulated Emissions in Chassis Dynamometer Tests of a Pickup Truck,” Transactions of the American Society of Agricultural Engineers, Vol. 43, No. 6, 2000, pp. 1371-1381.
- H. Aydina and C. İlkılıç, “Effect of Ethanol Blending with Biodiesel on Engine Performance and Exhaust Emissions in a CI Engine,” Applied Thermal Engineering, Vol. 30, No. 10, 2010, pp. 1199-1204. doi:10.1016/j.applthermaleng.2010.01.037
- G. Fontaras, G. Karavalakis, M. Kousoulidou, T. Tzamkiozis, L. Ntziachristos, E. Bakeas, S. Stournas and Z. Samaras, “Effects of Biodiesel on Passenger Car Fuel Consumption, Regulated and Non-Regulated Pollutant Emissions over Legislated and Real-World Driving Cycles,” Fuel, Vol. 88, No. 9, 2009, pp. 1608-1617. doi:10.1016/j.fuel.2009.02.011
- M. Gumus and S. Kasifoglu, “Performance and Emission Evaluation of a Compression Ignition Engine Using a Biodiesel (Apricot Seed Kernel Oil Methyl Ester) and Its Blends with Diesel Fuel,” Biomass and Bioenergy, Vol. 34, No. 1, 2010, pp. 134-139. doi:10.1016/j.biombioe.2009.10.010
- K. Ryu, “The Characteristics of Performance and Exhaust Emissions of a Diesel Engine Using a Biodiesel with Antioxidants,” Bioresource Technology, Vol. 101, No. 1, 2010, pp. S78-S82. doi:10.1016/j.biortech.2009.05.034
- H. C. Frey and K. Kim, “Comparison of Real-World Fuel Use and Emissions for Dump Trucks Fueled with B20 Biodiesel versus Petroleum Diesel,” Transportation Research Record: Journal of the Transportation Research Board, Vol. 1987, 2006, pp. 110-117. doi:10.3141/1987-12
- K. Ropkins, R. Quinn, J. Beebe, H. Li, B. Daham, J. Tate, M. Bell and A. Gordon, “Real-World Comparison of Probe Vehicle Emissions and Fuel Consumption Using Diesel and 5% Biodiesel (B5) Blend,” Science of the Total Environment, Vol. 376, No. 1-3, 2007, pp. 267-284. doi:10.1016/j.scitotenv.2006.11.021
- H. C. Frey, W. J. Rasdorf, K. Kim, S. H. Pang and P. Lewis, “Comparison of Real-World Emissions of B20 Biodiesel versus Petroleum Diesel for Selected Nonroad Vehicles and Engine Tiers,” Transportation Research Record: Journal of the Transportation Research Board, Vol. 2058, 2008, pp. 33-42. doi:10.3141/2058-05
- H. C. Frey and K. Kim, “In-Use Measurement of Activity, Fuel Use, and Emissions of Cement Mixer Trucks Operated on Petroleum Diesel and B20 Biodiesel,” Transportation Research—Part D, Vol. 14, No. 8, 2009, pp. 585- 592. doi:10.1016/j.trd.2009.08.004
- M. E. Tat, “Investigation of Oxides of Nitrogen Emissions from Biodiesel Fueled Engines,” Ph.D. Dissertation, Iowa State University, Ames, 2003.
- C. D. Rakopoulous, K. A. Antonopoulos, D. C. Rakopoulos, D. T. Hountalas and E. G. Giakoumis, “Comparative Performance and Emissions Study of a Direct Injection Diesel Engine Using Blends of Diesel Fuel with Vegetable Oils or Bio-Diesels of Various Origins,” Energy Conservation and Management, Vol. 47, No. 18-19, 2006, pp. 3272-3287. doi:10.1016/j.enconman.2006.01.006
- R. L. Muncrief, C. W. Rooks, M. Cruz and P. H. Michael, “Combining Biodiesel and Exhaust Gas Recirculation for Reduction in NOx and Particulate Emissions,” Energy & Fuels, Vol. 22, No. 2, 2008, pp. 1285-1296. doi:10.1021/ef700465p
- G. Karavalakis, S. Stournas and E. Bakeas, “Effects of Diesel/Biodiesel Blends on Regulated and Unregulated Pollutants from a Passenger Vehicle Operated over the European and the Athens Driving Cycles,” Atmospheric Environment, Vol. 43, No. 10, 2009, pp. 1745-1752. doi:10.1016/j.atmosenv.2008.12.033
- F. Wu, J. Wang, W. Chen and S. Shuai, “A Study on Emission Performance of a Diesel Engine Fueled with Five Typical Methyl Ester Biodiesels,” Atmospheric Environment, Vol. 43, No. 7, 2009, pp. 1481-1485. doi:10.1016/j.atmosenv.2008.12.007
- M. Kousoulidou, G. Fontaras, L. Ntziachristos and Z. Samaras, “Biodiesel Blend Effects on Common-Rail Diesel Combustion and Emissions,” Fuel, Vol. 89, No. 11, 2010, pp. 3442-3449. doi:10.1016/j.fuel.2010.06.034
- Y. Lin, Y. G. Wu and C. Chang, “Combustion Characteristics of Waste-Oil Produced Biodiesel/Diesel Fuel Blends,” Fuel, Vol. 86, No. 12-13, 2007, pp. 2810-2816. doi:10.1016/j.fuel.2007.01.012
- Z. Utlu and M. S. Koçak, “The Effect of Biodiesel Fuel Obtained from Waste Frying Oil on Direct Injection Diesel Engine Performance and Exhaust Emissions,” Renewable Energy, Vol. 33, No. 8, 2008, pp. 1936-1941. doi:10.1016/j.renene.2007.10.006
- M. Kocak, E. Ileri and Z. Utlu, “Experimental Study of Emission Parameters of Biodiesel Fuel Obtained from Canola, Hazelnut and Waste Cooking Oils,” Energy and Fuels, Vol. 21, No. 6, 2007, pp. 3622-3626. doi:10.1021/ef0600558
- N. Pala En, “On-Road Measurement of NOx and CO2 Emissions from Biodiesel Produced from Different Feedstocks,” Ph.D. Dissertation, University of Texas at Arlington, Arlington, 2012.
- H. C. Frey, N. M. Rouphail, A. Unal and J. D. Colyar, “Measurement of On-Road Tailpipe CO, NOx and Hydrocarbon Emissions Using a Portable Instrument,” The Annual Meeting of the Air & Waste Management Association, Orlando, 24-28 June 2001, pp. 1-20.