Journal of Environmental Protection
Vol.4 No.8(2013), Article ID:35473,10 pages DOI:10.4236/jep.2013.48096
Determination of Different Trace Heavy Metals in Ground Water of South West Bank/Palestine by ICP/MS
![]()
1Department of Earth and Environmental Studies, Faculty of Science and Technology, Al-Quds University, East Jerusalem, Palestinian Authority; 2Aquatic and Aquaculture Research Laboratory, Al-Quds University, East Jerusalem, Palestinian Authority; 3Faculty of Science and Technology, Al-Quds University, East Jerusalem, Palestinian Authority.
Email: *qutob@planet.edu
Copyright © 2013 Husam Malassa et al. This is an open access article distributed under the Creative Commons Attribution License, which permits unrestricted use, distribution, and reproduction in any medium, provided the original work is properly cited.
Received May 17th, 2013; revised June 24th, 2013; accepted July 1st, 2013
Keywords: heavy metals; WHO limits; ICP/MS; ground water; West Bank
ABSTRACT
Heavy metal contamination of the groundwater of south West Bank in Palestine was assessed. The groundwater samples were analyzed for different trace heavy metals (Tl, Pb, Bi, Cr, Mn, Co, Ni, Cu, Zn, Mo, Ag, and Cd), and Al content by ICP/MS. This study was conducted to determine the water quality of ground water which is used for drinking in the study area. Water samples from ten groundwater wells were obtained in four different dates of the year (October 2012, November 2012, March 2013, and April 2013). Three water samples were obtained from each well for each sampling date. A total of 120 water samples were collected from the ten wells. The samples were analyzed for their pH, electrical conductivity, total dissolved solids, and different trace metals content. The pH, electrical conductivity, and total dissolved solids of all water samples were found to be within the US Environmental protection Agency limits. Results showed that Pb, Al, Cr, Co, Ni, Cu, Zn, and Mo were detected in all water samples analyzed in this study, while Tl, Bi, Mn, Ag, and Cd were detected in 80%, 88%, 90%, 75%, and 95% of the water samples analyzed in this study, respectively. In general, 93% of all samples analyzed contained one or more of the 13 metals studied each in varying concentration. Furthermore, results showed that the concentration of Cr, Mn, Ni, Cu, Zn, and Mo is within the allowed WHO limits in drinking water. However the concentration of Pb Cd, and Al are found to be higher than the allowed WHO limits in 40%, 8%, and 33% of the water samples analyzed in this study, respectively. Statistical analyses showed that concentrations of the metals studied in this study vary significantly between the ten ground water wells, indicating that the wells analyzed in this study is different from each other in terms of heavy metal content. Additionally, from the statistical results obtained, it was found that there is a significant difference in the concentration of the metals in each well for the four sampling times (October 2012, November 2012, March 2013, and April 2013), denoting that metal concentration in the wells vary significantly with sampling time. The results obtained from this study suggest a possible risk to the population of the study area given the toxicity of these metals, and the fact that for many people in the study area, ground water is a main source of their water supply.
1. Introduction
Groundwater contamination with heavy metals is one of the most important environmental issues as they are toxic even at low concentrations [1-3]. Human activities have increased the concentrations of heavy metals in the environment. For example, anthropogenic activities e.g. industry, agriculture, solid waste disposal increase the contents of heavy metals in different environmental matrices (e.g. water, soil, air), fruits, vegetables, fish. etc. [4-7]. There are 35 metals that concern us because of occupational or residential exposure; 23 of these are heavy metals: antimony, arsenic, bismuth, cadmium, cerium, chromium, cobalt, copper, gallium, gold, iron, lead, manganese, mercury, nickel, platinum, silver, tellurium, thallium, tin, uranium, vanadium, and zinc [8]. Small amounts of these elements are common in our environment and diet and some are necessary for good health, but large amounts of any of them may cause acute or chronic toxicity. Health risks of heavy metals include reduced growth and development, cancer, organ damage, nervous system damage, and in extreme cases, death. Exposure to some metals, such as mercury and lead, may also cause development of autoimmunity, in which a person’s immune system attacks its own cells. Heavy metals become toxic when they are not metabolized by the body and accumulate in the soft tissues. Heavy metals may enter the human body via food, water, air, or absorption through the skin in agriculture, industrial, or residential settings [9].
Many studies have investigated the occurrence and monitoring of heavy metals in ground water and drinking water. Momodu and Anyakora (2010) [1] has assessed groundwater contamination with heavy metals (Pb, and Cd) and Aluminum in Nigeria, and results showed that there is a significant risk for the population from drinking groundwater as these metals were detected in 98% of water samples analyzed in that study. Laniyan et al. (2011) [10] as well as Oyeku and Eludoyin (2010) [11] were also investigated the occurrence of heavy metals in groundwater in Nigeria. Momot and Synzynys (2005) [12] has investigated toxic aluminum and heavy metals in groundwater of middle Russia and results showed that some heavy metals (Hg, Cr, and As) were detected. Batayneh (2010) [4] has studied heavy metal content in water springs of the Yarmouk Basin (Jordan) and results of the study showed that Yarmouk Basin in North Jordan are contaminated with heavy metals that might affect human health as well as the health of the ecosystem. Iqbal and Gupta (2009) [13] and Rajappa (2010) [14] has studied the heavy metal pollution of groundwater in India, where results showed that some heavy metals are detected in groundwater samples. Al-Omary (2013) [15] has determined trace metals in drinking water in Irbid (Jordan), and results showed that the level of most elements determined (As, Ba, Cd, Pb, Cr, Cu, Fe, Zn, Mn, Ni, and Se) were within the Jordanian standards and WHO standards for drinking water. Gutierrez et al. (2008) [16] has studied the occurrence of heavy metals in water of San Petro River in Mexico and results confirmed that the San Pedro River is contaminated with heavy metals and other contaminants that might affect human health as well as the health of the ecosystem. Kar et al. (2008) [17] has studied the assessment of heavy metals pollution in surface water in Ganga in West Bengal and results showed that the dominance of various heavy metals in the surface water of the river Ganga followed the sequence: Fe > Mn > Ni > Cr > Pb > Zn > Cu > Cd. Voica et al. (2012) [18] has determined different heavy metals in surface water from Transylvania/Romania and results showed that toxic heavy metals were detected in water samples in the range of few ppb. Ismail and Mat Saleh (2012) [19] have analyzed different heavy metals in water samples from Malysia and results showed that the concentrations of heavy metals in water samples were below the detection limit.
It is obvious from this literature that studies on the occurrence and determination of heavy metals in water (ground, drinking, surface. etc.) is an important issue for the human health and for environment. In Palestine, the principal water resources available include groundwater, springs, and harvested rainwater [20]. However, there are few studies in Palestine that dealt with pollution of groundwater with different pollutants e.g. pesticides, nitrates, chlorides, heavy metals. A study by Ghanem and Samhan (2012) [21] has focused on the assessment of pollution of groundwater in Tulkarem area with nitrate and chloride, and results indicated that there are many samples with nitrate concentrations exceeding the WHO standards of 45 mg/L for drinking water. Ghanem et al. (2011) [22] has also investigated the groundwater pollution due to pesticides and heavy metals in north West Bank, and results showed that Pb, Cd, and Cr are detected in the groundwater of north West Bank, with concentration of Pb higher that the WHO limit. El-Nahhal (2006) [23] has studied the contamination of groundwater with heavy metals in Gaza Strip where results showed that concentration of Cd, Pb, Fe, and Cr are above the EPA limits in some wells. However and according to our best knowledge there are no studies conducted on the analysis of heavy metals in south of West Bank. The objectives of the current study are therefore to study the occurrence of different trace metals, and to determine the concentration of different heavy metals (Tl, Pb, Bi, Cr, Mn, Co, Ni, Cu, Zn, Mo, Ag, and Cd) and Al in ground water samples collected in south of West Bank.
2. Experimental
2.1. Study Area
2.1.1. Climate
Water samples were obtained from south of West Bank /Palestine including three areas: Jerusalem, Beitlehem, and Hebron. The climate of the study area ranges from arid to semi-arid with an increase in aridity towards the Negev desert in the south and the Jordan valley in the east. The monthly average temperature of the study area ranges from 7.5˚C - 10˚C in the winter to 22˚C in the summer. The minimum temperature is −3˚C in January and the maximum is 40˚C in August. Most of the rain falls during December through February, although there may be rain from mid-October to the end of April. Water shortage is a serious problem facing the study area due to the arid and semi-arid climatic conditions [24].
2.1.2. Groundwater: Aquifers and Wells
The West Bank lies over the Mountain aquifer which is divided into the eastern aquifer, the northeastern aquifer, and the western aquifer. The eastern aquifer and part of the northeastern aquifer flow east towards the Jordan River. The western aquifer and part of the northeastern aquifer flow westerly towards the Mediterranean Sea [25,26]. In the study area, there are 24 wells [27].
2.1.3. Geography and Geology
South of West Bank including Jerusalem, Beitlehem, and Hebron have a highly varying topography and altitude; with the highest point at 1011 m above sea level and the lowest at 150 m above sea level. In terms of geology, the majority of the study area is rocky mainly comprised of carbonate sediment such as limestone, chalky limestone and dolomite with marl. The geological rock age formations range from Turonian to Upper Cenomanian [24].
2.2. Sampling and Analysis
Ten groundwater wells were selected as representative wells of the study area. Figure 1 shows location of the wells in the study area analyzed in this study. Three samples were obtained from each well. The selected wells were sampled four times in four different dates of 2012 and 2013 (October 2012, November 2012, March 2013, and April 2013). A total of 120 water samples were collected from the ten wells. The water samples were collected in 1-liter high density polyethylene bottles (precleaned with 10% nitric acid followed by repeated rinsing with bi-distilled water), stabilized with ultrapure nitric acid (0.5% HNO3), preserved in a cool place (about 4˚C) and transported to the lab of Al-Quds University for further analysis. pH, electrical conductivity, and total dissolved solids were measured in the lab immediately after the arrival of the samples according to standard methods [28]. The samples were then analyzed for heavy metals content (Tl, Pb, Bi, Cr, Mn, Co, Ni, Cu, Zn, Mo, Ag, and Cd) and Al by ICP/MS (Agilent technologies 7500 series).
For accurate quantitative determination of heavy metals in water samples, an internal standard method was used using (In) as internal standard and a multi-standard calibration method: (22 metals standard (Ag 10 ppm, Al 50 ppm, B 50 ppm, Ba 10 ppm, Bi 100 ppm, Ca 10 ppm, Cd 10 ppm, Co 10 ppm, Cr 50 ppm, Cu 10 ppm, Fe 10 ppm, K 100 ppm, Li 50 ppm, Mg 10 ppm, Mn 10 ppm,
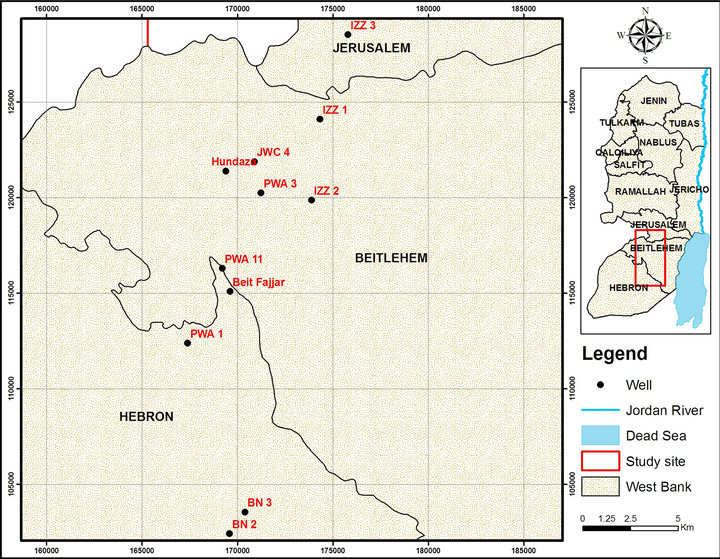
Figure 1. Map of West Bank and the study area showing location of the ground wells analyzed in this study (PWA1, Beit Fajjar, PWA3, JWC 4, BN, Hundaz, PWA 11, IZZ 1, IZZ 2, and IZZ 3).
Mo 50 ppm, Na 50 ppm, Ni 50 ppm, Pb 100 ppm, Sr 10 ppm, Tl 50 ppm, Zn 10 ppm, matrix 5% HNO3). Samples were prepared by dilution of 1.0 mL of the water samples to 10.0 mL with 0.3% ultrapure nitric acid and analyzed by ICP/MS. Each sample was analyzed three times and the results are expressed as mean ± SD (SD: standard deviation). Relative standard deviation (RSD) of the three results are calculated and found to be less than 5% for all samples for all metals analyzed in this study, reflecting the precision of the method for the analysis of these heavy metals. Calibration curves for all metals analyzed were constructed by plotting the ratio of the intensity of the analyte metal to that of the internal standard (In) vs. concentration of the trace metal (in ppb), and results showed that the calibration curves are linear with correlation coefficient (r2) greater than 0.999 for the trace metals analyzed.
The Agilent Technologies 7500 Series ICP-MS (Agilent 7500) can measure trace elements as low as one part per trillion (ppt) and quickly scan more than 70 elements to determine the composition of an unknown sample with a MassHunter Workstation software automates the analysis and accurately interprets the resulting data. The ICP/MS instrument consists of an on-board peristaltic pump that controls the flow of sample solution into and waste (drain) out of the instrument, a nebulizer (Micro Mist nebulizer) that uses a stream of argon to disperse the sample, an ICP Argon plasma torch using Argon as plasma gas, auxillary gas and nebulizer (carrier) gas, two pumps for evacuation, quadrupole mass analyzer with 0.8 amu resolution at 10% height, an octapole reaction system (ORS), and electron multiplier detector. The operating conditions are as follows: nebulizer gas (argon) flow rate: 0.9 L/min, auxiliary gas (argon) flow 0.3 L/min, plasma (Argon) gas flow: 15 L/min, reaction gas flow (helium) 4mL/min, lens voltage 7.25 V, ICP RF power: 1100 W, CeO/Ce = 1%, and Ce+2/Ce+1 = 1%.
2.3. Statistical Analysis
Data were analyzed using Origin 9 software. Statistical differences were tested using one way ANOVA. Differences were considered significant at p values ≤ 0.05.
3. Results and Discussion
This study was conducted to investigate the quality of groundwater which is used for drinking in the study area. The study area has severe water scarcity so people depend mainly on the groundwater and on the rain water harvested and stored in cisterns or wells. The pH of all water samples ranged between 7.0 - 7.9 which is within the allowed WHO limit (6.5 - 8.5). Electrical conductivity and total dissolved solids of all water samples ranged from 196 - 1389 µS/cm, and 112.0 - 791.0 mg/L respectively. The limit for total dissolved solids in drinking water according to WHO is 1000 mg/L [29], where our results showed that all water samples are within this limit.
3.1. Heavy Metals Content
Results showed that twelve heavy metals (Tl, Pb, Bi, Cr, Mn, Co, Ni, Cu, Zn, Mo, Ag, and Cd), and Al were detected in one or more water sample analyzed in this study. Table 1 shows the concentrations of metals detected in the groundwater samples analyzed in this study in four different sampling dates (October 2012, November 2012, March 2013, and April 2013). Results also showed that eight metals (Pb, Al, Cr, Co, Ni, Cu, Zn, and Mo) were detected in all water samples analyzed in this study, while Tl, Bi, Mn, Ag, and Cd were detected in 80%, 88%, 90%, 75%, and 95% of the water samples analyzed in this study, respectively. In general, 93% of all samples analyzed contained one or more of the 13 metals studied each in varying concentration. The concentration of Tl, Pb, Bi, Al, Cr, Mn, Co, Ni, Cu, Zn, Mo, Ag, and Cd in the ten wells analyzed in this study were ranged from: 0.0 - 1.0, 0.15 - 109.3, 0.0 - 215.7, 0.33 - 631.5, 0.08 - 28.6, 0.0 - 45.1, 0.01 - 6.2, 0.36 - 13.2, 0.53 - 243.6, 0.84 - 42.8, 0.1 - 11.5, 0.0 - 6.4, and 0.0 - 7.0 ppb, respectively.
Furthermore, results showed that the concentration of six heavy metals (Cr, Mn, Ni, Cu, Zn, and Mo) is within the allowed WHO limits in drinking water (50, 500, 20, 2000, 3000, and 70 ppb, respectively), however five of these metals (Cr, Ni, Cu, Zn, Mo) were detected in 100% of the water samples, and Mn was found to be existing in 90% of the water samples analyzed in this study. On the other hand, the concentration of Pb, Cd and Al are found to be higher than the allowed WHO limits (10, 3, and 200 ppb, respectively) in 40%, 8%, and 33% of the water samples analyzed in this study, respectively. The highest concentration of lead was found to be in well number PWA 1 with a concentration of 109.3 ppb (11 fold of the allowed WHO limits). Regarding Cd and Al, the highest concentrations of these metals were detected in well number Beit Fajjar (with concentration of 7.0 ppb) and PWA 3 (with concentration of 631.5 ppb), respectively. There is no limit for Ag in drinking water according to WHO, however it is usually found in drinking water in the range 5 - 50 ppb. Our results showed that one sample contained 6.4 ppb of Ag, while the rest samples contain lower than 5 ppb. However it was found that 75% of water samples analyzed in this study contain this heavy metal (Ag). Co and Bi have also no limits in drinking water by WHO, however these metals were detected in 100% and 88% of the water samples analyzed in this study.
Thalium (Tl) is a highly toxic element that humans are exposed to mainly by consumption of drinking water and vegetables grown in soil with high thallium content but also through inhalation of particles in the air. Thallium is also present in fossil fuels, alloys, and in electronic utilities. The increasing use of the element and emissions from notably energy production has lead to a higher load on the surface of the Earth. The allowed WHO limits of Tl in water is 0.01 - 1 ppb [30]. Our results showed that Tl is detected in 90% of the water samples analyzed with a range of 0.01 - 1.0 ppb. This finding indicates that such concentration level of Tl is harmful to human being consuming this groundwater.
3.2. Trace Metals Pollution in Terms of Well Number
A one way ANOVA statistical test was used to test if the concentration of the analyzed metals is significantly different between the ten groundwater wells. Results showed that the ten wells in this study are different from each other at 95% confidence level in terms of heavy metal content. These findings confirm locational variations of the metals in the ten wells analyzed in this study. Figure 2 shows this variation for Pb as an example in the ten wells. This fluctuation in the concentration of trace metals in the ten wells analyzed in this study indicates that the sources of these metals are from anthropogenic and human activities e.g. arbitrary dumping sites, landfills, and industry.
From Table 1, it was found that the highest concentration of Tl, Pb, Bi, Al, Cr, Mn, Co, Ni, Cu, Zn, Mo, Ag, and Cd were found in well IZZ 1, PWA1, IZZ 1, PWA 3, IZZ 1, Beit Fajjar, Beit Fajjar, PWA 1, IZZ 1, Hundaz, IZZ 2, IZZ1, and Beit Fajjar, respectively. As it is clear from this result, IZZ1 well is highly contaminated with heavy metals compared to others as this well is located near some industrial activities.
3.3. Effect of Sampling Date on the Heavy Metal Content
Statistical analyses were conducted to test if there is significant difference in the concentration of the metals in the groundwater wells as a function of the sampling date (October 2012, November 2012, March 2013, and April 2013), and results confirmed that there is a significant difference, denoting that metal concentration in the wells vary significantly with sampling time. As it is seen in Table 1, concentration of Pb is highest in November and lowest in April. The same applies for Tl where highest concentration was detected in November, but the lowest concentration fluctuates between other months. For Bi, Co, and Ni the highest concentrations of these metals were detected in October and November, while the lowest in April. For Al, the highest concentration is detected in November for some samples, and in March for other samples, while the lowest concentration remains in April. Regarding Cr, and Mn there is fluctuation in the highest concentration (between October, November, and March), but the lowest concentration remains in April. The highest concentration of Cd was found to be in November, but the lowest concentration fluctuates between October, March, and April. Concerning Cu, Zn, Mo, Ag there is a fluctuation in the concentration of these metals and there is no trend in the highest and lowest concentration. Generally high concentrations of trace metals are detected in October and November, while lower concentrations are detected in March and April (and especially in April). This result may be explained by the fact that such heavy metals which arise from anthropogenic sources are collected and concentrated during no-rain months, and then washed in October and November (beginning of rainfall) with the rain runoff and leached to the groundwater through soil.
It was important to calculate the total concentration of all trace metals in the wells, and to compare this concentration in the ten wells in terms of sampling month. Results showed that the total concentration of the thirteen trace metals is highest in November and lowest in April in eight wells analyzed in this study (PWA1, Beit Fajjar, PWA3, JWC4, Bani Naem, IZZ1, IZZ2, and IZZ3). On the other hand, the total concentration for wells Hendaza, and PWA11 was found to be highest in March but the lowest total concentrations remains in April, see Table 1. The high total concentration of trace metals found in November can be attributed to the leaching of theses heavy metals to the groundwater with rainfall in November, while in April these trace metals are diluted.
3.4. Sources of Heavy Metals in the Groundwater Samples
Heavy metals exist in water in colloidal, particulate and dissolved phases [31] with their occurrence in water bodies being either of natural origin (e.g. eroded minerals within sediments, leaching of ore deposits and volcanism extruded products) or of anthropogenic origin (i.e. solid waste disposal, industrial or domestic effluents) [3]. The most common heavy metals that humans are exposed to are Aluminium, Arsenic, Cadmium, Lead and Mercury. Aluminium has been associated with Alzheimer’s and Parkinson’s disease, senility and presenile dementia.
Arsenic exposure can cause among other illness or symptoms cancer, abdominal pain and skin lesions. Cadmium exposure produces kidney damage and hypertension. Lead is a commutative poison and a possible human carcinogen [32].
The quality of ground water sources are affected by the characteristics of the media through which the water passes to the ground water zone of saturation [33], thus, the heavy metals discharged by industries, traffic, mu-
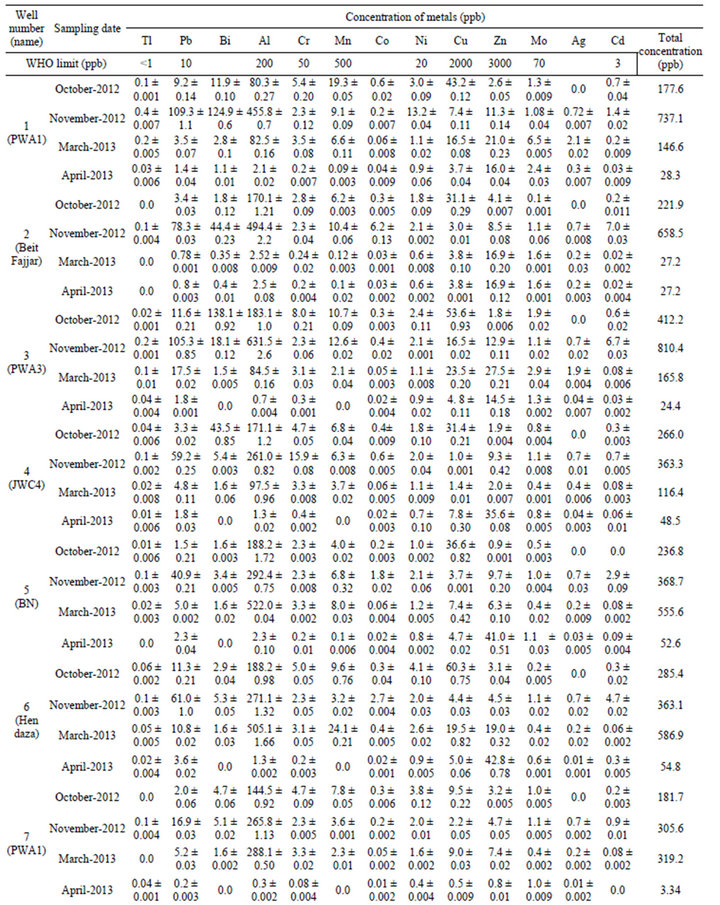
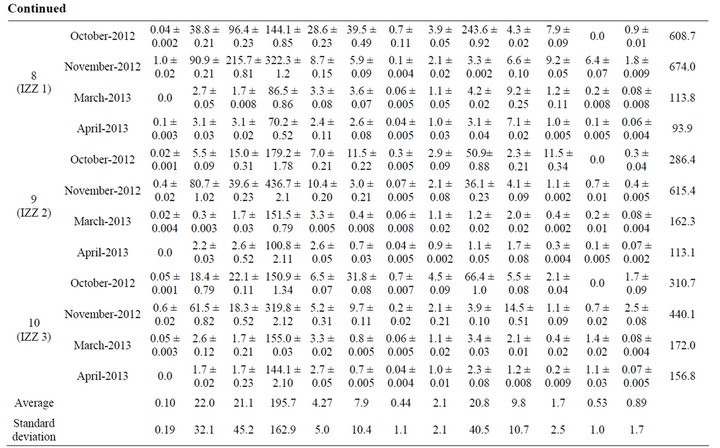
Table 1. Concentration of trace metals detected in groundwater wells analyzed in this study. Results expressed as average ± SD for three samples (SD: standard deviation).
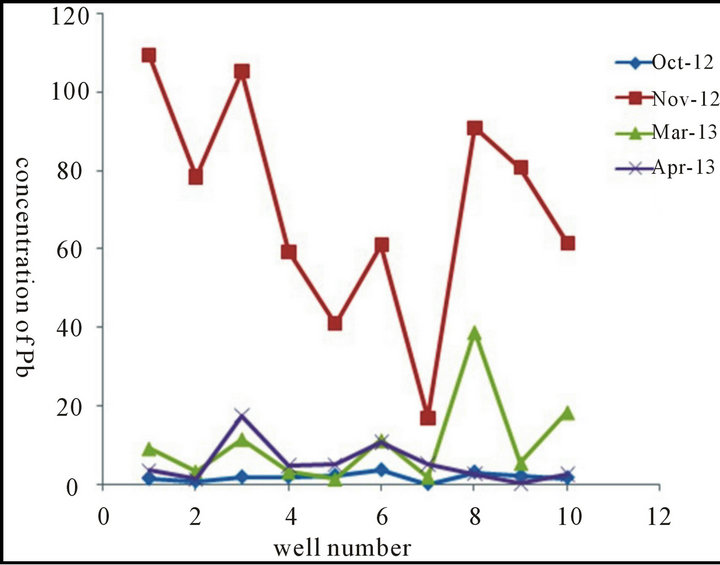
Figure 2. Concentration of Pb (in ppb) vs. well number obtained in October 2012, November 2012, March 2013, and April 2013.
nicipal wastes, hazardous waste sites as well as from fertilizers for agricultural purposes and accidental oil spillages from tankers can result in a steady rise in contamination of ground water [34]. Additionally, groundwater quality is influenced considerably by the quality of the recharge source. Variations in natural and human activities reflect spatial variations of the aquifer and the hydro chemical parameters of the groundwater. Pollution sources are classified as point sources and diffuse sources. Point sources are sources that can be clearly identified and pinpointed (such as landfill leachate). Diffuse sources cannot be pinpointed and are distributed over a large surface area (application of fertilizers and pesticides in agriculture).
In Palestine, groundwater is one of the major sources of water. Efficient management of this resource requires a good understanding of its status. Groundwater management in the West bank is affected by the randomly distributed dumping sites, solid waste landfills, cesspits, especially in rural communities, as well as agricultural and industrial practices. Accordingly, the shallow aquifer in the eastern and western groundwater basins is deteriorated; high concentrations of nitrate and sulfate were detected larger than the WHO standards. Microorganisms were detected in some springs inside rural communities in Ramallah area. This could be reflected on the water supply for these communities for the fact that these water sources are the major sources for drinking and agricultural purposes [22]. Accordingly, the sources of the detected metals in groundwater wells of the study area which is used for drinking can be attributed to many sources, including, among others, dumping sites and landfills for solid waste disposal, cesspits, industries, traffic, as well as from fertilizers for agricultural purposes. The leachate of municipal wastes and landfills which contain heavy metals is transported to the ground water through soil. In addition to the leachate of landfills, uncontrolled burning (incineration) of solid wastes in illegal waste dumping sites and landfills may also results in the contamination of groundwater with heavy metals. The most publicized concerns from environmentalists about the incineration of municipal solid wastes involve the fear that it produces significant amounts of emissions in their ash and flue gases including heavy metals [35]. Fly ash generated from waste incineration is usually contaminated with heavy metals and other dangerous substances and have to be treated as a hazardous residue. As a result of solid waste incineration, diverse pollutants are formed and emitted in flue gas including heavy metals e.g. Hg, Cd, Tl, As, Ni, Pb, Sb, Se, Sn, Zn, …, especially when wastes contain batteries, leather, pigments, cans. The heavy metals emitted from solid waste incineration process can reach water (surface, ground, rainwater..etc) and pollute it. Europe has been strongly committed since the early 1970s to the environment protection of air. In this ambit, it should be mentioned the Directive 2000/ 76/EC [36] of the European Parliament and of the Council, on the incineration of waste that aims “to prevent or to limit as far as practicable negative effects on the environment, in particular pollution by emissions into air, soil, surface water and groundwater, and the resulting risks to human health, from the incineration and co-incineration of waste.” This Directive, known as Waste Incineration Directive (WID), states that continuous measurements of emissions including the following heavy metals (Cd, Tl, Hg, Sb, As, Pb, Cr, Co, Cu, Mn, Ni, V) is necessary (Directive 2000/76/EC of The European Parliament and the Council 2000). The emissions of heavy metals depend mostly on the waste characteristics and air pollution control devices. Air pollution residues produced in incineration processes are classified as hazardous solid waste mainly due to its high pH, and high content in volatile heavy metals [37]. As an example, cadmium is an environmental problematic toxic element that may arise in air emissions due to its thermal mobility. Although some countries restrict applications of Cd, frequent sources are electronic devices (including accumulators), paints, Ni-Cd batteries, and cadmium-stabilised plastics [38]. During incineration process, combustion temperatures determine the evaporation degree of heavy metals. Indeed, the following heavy metals: Hg, Cd, Tl, Sb, As, Pb, Cr, Co, Cu, Mn, Ni and V must be under control. These are very toxic metals since they are carcinogenic or may provoke respiratory damages. Lead and chromium are currently the most problematic heavy metals found in solid wastes residues that lead to a classification as hazardous waste [38]. Results of the current work have confirmed pollution of ground water collected in the study area, where thirteen metals including the toxic heavy metals: Pb, Cr , Cd, Mn, Co, Ni, Cu, Zn are detected.
In West Bank and especially in rural areas, people dispose their wastewater using cesspits which is one of the main pollution sources to groundwater. Most of these cesspits are emptied by vacuum tankers and disposed into wadis or to improper dumping sites. These dumping sites are located in agricultural lands and their sites were selected randomly without any consideration to the soil characteristics, topography and climate as well as groundwater. As none of the existing dumping sites is designed to collect leachate from solid waste degradation, the leachate always finds its way through the soil to the groundwater, increasing concentration of pollutants including heavy metals to the water. In addition to municipal wastes and cesspits, urban, agricultural and industrial activities in the study area may also contribute to the contamination of the groundwater with heavy metals.
4. Conclusion
Groundwater from south West Bank contains twelve heavy metals (Tl, Pb, Bi, Cr, Mn, Co, Ni, Cu, Zn, Mo, Ag, and Cd) and one metal (Al) in 93% of samples analyzed from ten wells, with eight trace metals (Pb, Al, Cr, Co, Ni, Cu, Zn, and Mo) detected in 100% of water samples analyzed. Concentrations of six heavy metals (Cr, Mn, Ni, Cu, Zn, and Mo) detected in the water samples analyzed in this study are within the allowed limits, but they are detected in almost all water samples analyzed in this study. The concentration of three metals (Pb, Cd, and Al) are higher than the allowed WHO limits in 40%, 8%, and 33% of the water samples analyzed in this study, respectively. Municipal waste, landfills, cesspits, and incineration of solid wastes in the study area are responsible for the occurrence of the trace metals detected in the groundwater of the study area. It is concluded that uncontrolled consumption of groundwater which is used for drinking in the study area may be dangerous for human health. Our recommendations are that uncontrolled disposal of wastes and incineration of solid waste should be banned and responsible authorities have to monitor and control the quality of groundwater periodically (e.g. heavy metals content) in West Bank as this water is used for drinking especially in regions suffering from water scarcity. Additionally other studies should be conducted for monitoring heavy metals in water (surface, ground, etc.) in other locations in Palestine.
5. Acknowledgements
The authors are gratefully for German research funding organization (Deutsche Forschungsgemeinschaft), DFG for their financial support through TRION project.
REFERENCES
- M. A. Momodu and C. A. Anyakora, “Heavy Metal Contamination of Ground Water: The Surulere Case Study,” Research Journal Environmental and Earth Sciences, Vol. 2, No. 1, 2010, pp. 39-43.
- J. K. Vodela, J. A. Renden, S. D. Lenz, W. H. Mchel Henney and B. W. Kemppainen, “Drinking Water Contaminants,” Poultry Science, Vol. 76, No. 11, 1997, pp. 1474-1492.
- J. E. Marcovecchio, S. E. Botte and R. H. Freije, “Heavy Metals, Major Metals, Trace Elements”. In: L. M. Nollet, Ed., Handbook of Water Analysis, 2nd Edition, CRC Press, London, 2007, pp. 275-311.
- A. T. Batayneh, “Heavy Metals in Water Springs of the Yarmouk Basin, North Jordan and Their Potentiality in Health Risk Assessment,” International Journal of the Physical Sciences, Vol. 5, No. 7, 2010, pp. 997-1003.
- N. Abderahman and Y. Abu-Rukah, “An Assessment Study of Heavy Metal Distribution within Soil in Upper Course of Zarqa River Basin/Jordan,” Environmental Geology, Vol. 49, No. 8, 2006, pp. 1116-1124. doi:10.1007/s00254-005-0154-4
- I. Adekunle, M. Adetunji, A. Gbadebo and O. Banjoko, “Assessment of Groundwater Quality in a Typical Rural Settlement in Southwest Nigeria,” International Journal of Environmental Research and Public Health, Vol. 4, No. 4, 2007, pp. 307-318. doi:10.3390/ijerph200704040007
- C. Chen, C. Kao, C. Chen and C. Dong, “Distribution and Accumulation of Heavy Metals in the Sediments of Kaohsiung Harbor, Taiwan,” Chemosphere, Vol. 66, No. 8, 2007, pp. 1431-1440. doi:10.1016/j.chemosphere.2006.09.030
- D. J. Ferner, “Toxicity and Heavy Metals,” eMedicine Journal, Vol. 2, No. 5, 2001, p. 1.
- D. Dupler, “Heavy Metal Poisoning,” In: J. L. Longe, Ed., Gale Encyclopedia of Alternative Medicine, Gale Group, Farmington Hills, 2001, pp. 2054-2057.
- T. A. Laniyan, O. O. Kehinde Phillips and L. Elesha “Hazards of Heavy Metal Contamination on the Groundwater around a Municipal Dumpsite in Lagos, Southwestern Nigeria,” International Journal of Engineering & Technology, Vol. 11, No. 1, 2011, pp. 61-69.
- O. T. Oyeku and A. O. Eludoyin, “Heavy Metal Contamination of Groundwater Resources in a Nigerian Urban Settlement,” African Journal of Environmental Science and Technology, Vol. 4, No. 4, 2010, pp. 201-214.
- O. Momot and B. Synzynys, “Toxic Aluminium and Heavy Metals in Groundwater of Middle Russia: Health Risk Assessment,” International Journal of Environmental Research and Public Health, Vol. 2, No. 2, 2005, pp. 214-218. doi:10.3390/ijerph2005020003
- M. A. Iqbal and S. G. Gupta, “Studies on Heavy Metal Ion Pollution of Ground Water Sources as an Effect of Municipal Solid Waste Dumping,” African Journal of Basic & Applied Sciences, Vol. 1 No. 5-6, 2009, pp. 117- 122.
- B. Rajappa, “Monitoring of Heavy Metal Concentration in Groundwater of Hakinaka Taluk, India,” Contemporary Engineering Sciences, Vol. 3, No. 4, 2010, pp. 183- 190.
- A. Alomary, “Determination of Trace Metals in Drinking Water in Irbid City-Northern Jordan,” Environmental Monitoring and Assessment, Vol. 185, No. 2, 2013, pp. 1969-1975. doi:10.1007/s10661-012-2680-3
- R. Gutierrez, H. Rubio-Arias, R. Quintana, J. Ortega and M. Gutierrez, “Heavy Metals in Water of the San Pedro River in Chihuahua, Mexico and Its Potential Health Risk,” International Journal of Environmental Research and Public Health, Vol. 5, No. 2, 2008, pp. 91-98. doi:10.3390/ijerph5020091
- D. Kar, P. Sur, S. Mandal, et al., “Assessment of Heavy Metal Pollution in Surface Water,” International Journal of Environmental Science and Technology Vol. 5, No. 4, 2008, pp. 119-124.
- C. Voica, M. H. Kovacs, A. Dehelean, D. Ristoiu and A. Iordache, “ICP-MS Determinations of Heavy Metals in Surface Waters from Transylvania,” Romanian Journal of Physics., Vol. 57, No. 6-7, 2012, pp. 1184-1193.
- I. Ismail and I. Mat Saleh, “Analysis of Heavy Metals in Water and Fish (Tilapia sp.) Samples from Ttasik Mutiara, Puchong,” The Malaysian Journal of Analytical Sciences, Vol. 16, No. 3, 2012, pp. 346-352.
- UNEP, “Desk Study on the Environment in the Occupied Palestinian Territories,” United Nations Environment Programme, Nairobi, 2003.
- M. Ghanem and N. Samhan, “Groundwater Pollution Assessment in Tulkarem Area, Palestine,” Journal of Earth Sciences and Geotechnical Engineering, Vol. 2, No. 4, 2012, pp. 1-16.
- M. Ghanem, S. Samhan, E. Carlier and A. Wasim, “Groundwater Pollution Due to Pesticides and Heavy Metals in North West Bank,” Journal of Environmental Protection, Vol. 2, No. 4, 2011, pp. 429-434. doi:10.4236/jep.2011.24049
- Y. El-Nahhal, “Contamination of Groundwater with Heavy Metals in Gaza Strip,” 10th International Water Technology Conference, Alexandria, 2006, pp. 1139-1150. http://www.water-observatory.net/sources/iwtc2006/15-1.PDF
- “Environmental Profile for the West Bank, Vol. 3: Hebron District,” Applied Research Institute, Jerusalem, 1995.
- A. Abed and S. Wishahi, “Geology of Palestine: The West Bank and Gaza Strip. Palestin,” Palestine Hydrology Group, Ramallah, 1999.
- F. M. Anayah and M. N. Almasri, “Trends and Occurrences of Nitrate in the Groundwater of the West Bank, Palestine,” Applied Geography, Vol. 29, No. 4, 2009, pp. 588-601. doi:10.1016/j.apgeog.2009.01.004
- PHG, “Water For Life,” Water, Sanitation and Hygiene Monitoring Program (WaSH MP), 2007/2008.
- APHA (American Public Health Association), “Standard Methods for the Examination of Water and Wastewater,” 20th Edition, Washington DC, 1998, p. 1294.
- WHO, “Total Dissolved Solids In drinking water,” Background Document for Development of WHO Guidelines for Drinking Water Quality (WHO/SDE/WSH/03.04/16),” 2003.
- IPCS, “Thallim International Program on Chemical Safety, Environmental Health Criteria: 182,” WHO, Geneva, 1996.
- A. A. Adepoju-Bello, O. O. Ojomolade, G. A. Ayoola and H. A. B. Coker, “Quantitative Analysis of Some Toxic Metals in Domestic Water Obtained from Lagos Metropolis,” Nigerian Journal of Pharmacy, Vol. 42, No. 1, 2009, pp. 57-60.
- M. T. Bakare-Odunola, “Determination of Some Metallic Impurities Present in Soft Drinks Marketed In Nigeria,” The Nigerian Journal of Pharmaceutical Research, Vol. 4, No. 1, 2005, pp. 51-54.
- O. Adeyemi, O. B. Oloyede and A. T. Oladiji, “Physicochemical and Microbial Characteristics of Leachate Contaminated Ground Water,” Asian Journal of Biochemistry, Vol. 2, No. 5, 2007, pp. 343-348. doi:10.3923/ajb.2007.343.348
- I. O. Igwilo, O. J. Afonne, U. J. Maduabuchi and O. E. Orisakwe, “Toxicological Study of the Anam River in Otuocha, Anambra State, Nigeria,” Archives of Environmental & Occupational Health, Vol. 61, No. 5, 2006, pp. 205-208. doi:10.3200/AEOH.61.5.205-208
- M. B. Chang, C. H. Jen, H. T. Wu and H. Y. Lin, “Investigation on the Emission Factors and Removal Efficiencies of Heavy Metals from MSW Incinerators in Taiwan,” Waste Management & Research, Vol. 21, No. 3, 2003, pp. 218-224. doi:10.1177/0734242X0302100305
- Directive 2000/76/EC of the European Parliament and the Council, 4 December 2000, on the Incineration of Waste.
- M. J. Quina, R. C. Santos, J. C. M. Bordado and R. M. Quinta Ferreira, “Characterization of Air Pollution Control Residues Produced in a Municipal Solid Waste Incinerator in Portugal,” Journal of Hazardous Materials, Vol. 152, No. 2, 2008, pp. 853-869. doi:10.1016/j.jhazmat.2007.07.055
- BREF, “Integrated Pollution Prevention and ControlReference Document on the Best Available Techniques for Waste Incineration,” European Commission, 2006.
NOTES
*Corresponding author.