Journal of Environmental Protection
Vol. 3 No. 12 (2012) , Article ID: 26038 , 8 pages DOI:10.4236/jep.2012.312186
Seasonal Influence on the Ambient Air Quality in Al Jahra City for Year 2010
![]()
1Department of Chemical Engineering, College of Technological Studies, Public Authority Applied Education and Training, Adailiya, Kuwait; 2Department of Environment Technology and Management, College for Women, Kuwait University, Kuwait City, Kuwait; 3Water Technologies Department, Water Resources Division, Kuwait Institute for Scientific Research, Safat, Kuwait; 4Gulf Paper Manufacturing Company, Fahaheel, Kuwait.
Email: *ra.alenezi@paaet.edu.kw
Received October 11th, 2012; revised November 10th, 2012; accepted December 6th, 2012
Keywords: Pollutants; Al Jahra; Seasonal Changes; Monitoring Station
ABSTRACT
Eight primary criteria air contaminants were measured continuously for the year 2010 to evaluate ambient air quality in Al Jahra, which is one of the oldest and busiest cities in the state of Kuwait. The state of the art instrumentation was used to record the pollutants concentration to ppb levels maintaining quality control and quality assurance. Hourly base data for Non-Methane Hydrocarons (NM-HC), CH4, CO, CO2, O3, SO2, NO2 and Particulate Matter (PM10) were analyzed for year 2010. Meteorological parameters contributing to air pollution, such as (temperature, solar intensity, wind speed and direction) have also been considered. The effect of winter and summer seasonal changes on pollutant concentration levels were analyzed to identify the most probable sources for the application of the futuristic mitigation methods for pollution abatement. The obtained results consistently suggest that the foregoing pollutant concentration levels are higher in winter than summer due to poor dispersion and shallow inversion layer with the exception of O3, CO2 and PM10. However, all of the pollutant concentrations are below the allowable standards limits except for NM-HC.
1. Introduction
Air is one of the major components of the environment that has been abused by human reckless behavior due to renaissance and prosperity as part of urbanization causing what is known today as air pollution. Air pollution has become a burdensome and an international problem threatening the existence of life due to its adverse impact on all living organisms, as well as facilities. Air pollution comprises outdoor and indoor air pollution, which was rated by experts as high risk to human health. According to World Health Organization (WHO) 1 of 6 people lives in polluted urban area, which is more than 1.1 billion people [1]. Outdoor air pollutants come mostly from two main sources. First source is natural source such as volcanic eruption and forest fire. Second source is industrial source such as burning fossil fuels in motor vehicles and power and industrial plants. Such urbanization processes have contributed significantly to the deterioration of air quality by increasing pollution levels in urban areas. As one might expect, humans have been producing increasing amounts of pollution as time has progressed, they now account for the majority of pollutants released into the air.
Monitoring the level of air pollutant is vital for their control and for decision makers. Therefore, the concentrations of air pollutants in Kuwait are constantly measured and monitored by number of fixed Air Quality Monitoring Stations, (AQMS) belonging to Kuwait-Environment Public Authority (KU-EPA). Mainly air quality in Kuwait is affected from burning fossil fuel in power plants, traffic, oil activities and petroleum refineries.
The area of air quality in the State of Kuwait has been discussed by many researchers [2-8]. Wahab and Bouhamra [9] used a mobile Air Pollution Monitoring Laboratory, (APML) to study air pollution in a residential area of Kuwait, which was affected by road traffic increase at an unimaginable scale. They reported that the levels of Nitrogen Oxides (NOx) and Non-Methane Hydrocarons (NM-HC) exceeded the proposed ambient air quality standard for residential areas in Kuwait. Also, AbdulWahab [3] has studied two cases of air pollution in the industrial area in the Sultanate of Oman and an urban residential area in Kuwait and come up with the same conclusion for NM-HC and NOx.
Ettouney et al., [2] have analyzed air pollution and meteorological data for two locations in Kuwait; Jahra and Umm Al Hyman over a period of 4 years (2001- 2004). There evaluations for the data were calculated to obtain annual hourly averages and annual 1-h maxima for each year for each pollutant as well as metrological parameter. This way, the impacts of the seasonal variation (winter, spring, summer and autumn) of these pollutants and metrological parameters on the air quality of these urban areas in different seasons have been masked. In the winter and summer seasons there is substantial difference in the metrological parameters such as ambient temperature, humidity, solar radiations and wind speed that have influence the dispersion of air pollutants. Alenezi and Ashfaque [10] reported that high concentrations of different air pollutants are observed in winter season due to prevalent meteorological conditions. Moreover, Ettouney et al., [2] have presented the annual hourly average for the wind speed and wind direction, which is inaccurate values and misleading. They should have analyzed wind speed vector taking into consideration the wind speed values and direction resolving into their respective horizontal component (along x-axis) and vertical component (along y-axis) and later resultant has to be calculated as an appropriate estimate of the magnitude and direction of wind velocity for the specified period of time, however they calculated the arithmetic mean instead.
Al-Bassam and Popov [11] performed statistical analyses on the variation of selected primary pollutants that are usually emitted by automobiles. Their study was carried out for 11 days in February 2006. Data were measured near a private school using a mobile air monitoring station. A computer dispersion model (CALINE4) was also used in their study, after validation, to predict the CO concentrations as function of number of cars in the vicinity of the school. Results showed high levels of NM-HC almost all of the times above the Kuwaiti EPA limit, while CO and Nitrogen Dioxide (NO2) concentrations found to be below the KU-EPA limits. The model results suggest that 30% reduction in CO is achievable if number of cars is decreased by half. However, this model should be tested to include pollutants of concern such as NM-HC, which has exceedance over 75% of the time from KU-EPA limits. Also, 11 days in the entire year is not enough to provide an accurate and more realistic results, and hence further studies must be performed for long duration to include seasonal effect.
The state of Kuwait is located in the northeastern corner of Arabian Peninsula and one of the Gulf Cooperation Council, GCC countries, which is mainly depending on oil as natural resource. Kuwait is a major exporter of crude oil, which is equal to 2.6 million barrels per day (mbbld). Kuwait locally produces heavy fuel oil that has been used for power generation that contains about 4% sulphur [8]. In Kuwait, motor vehicles and buses are the only means of road transportation [11]. Kuwait environment is exposed to air pollution augmented by extreme weather conditions. Kuwait is characterized by a typical desert type of weather with long summer spells and high frequency of dust storms, arid periods, and humid conditions. In the summer season, high unlimited emissions of various air pollutants such CO, carbon dioxide (CO2), methane (CH4), NM-HC, NOx and Particulate Matters (PM10) resulted as the power plants operated at their full capacity to relinquish the thirst of Heating Ventilation and Air Conditioning, (HVAC) of all buildings.
Due to its size, location (proximity to main pollutants sources) and large population, Al Jahra city was selected as the study area. This work is based on the quantitative analysis of air pollution data reflecting the ambient air quality of Al Jahra being the largest governorate in the state of Kuwait. The exceedances of the air pollutants threshold values are calculated during the period of study. Also, the diurnal profiles and the seasonal variations of these air pollutants are studied and the relationships between each other were investigated. The year of 2010 was divided into two main seasons (winter and summer) furthermore, these seasons are divided into three months each, starting from winter (January to March) and summer season (July to September). Similar diurnal trend of concentration levels at different times in the day were observed for both seasons. The meteorological parameters (temperature, wind speed and direction and solar intensity) were also considered in the discussion of the results.
Locations and Measurements
Kuwait map (Figure 1) shows the location of the Al Jahra residential area relative to Kuwait city and other urban areas in Kuwait. According to the satellite image of Kuwait, Al Jahra district is surrounded by several utility industries, Northern oil fields, powers and desalination plants, wastewater treatment plant and free-ways connecting it to the rest of Kuwait Cities and neighbouring countries. As shown in Figure 1 and wind rose plot
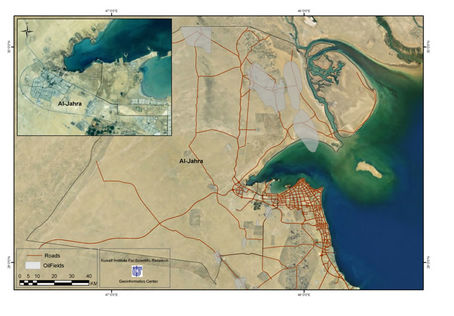
Figure 1. Al Jahra residential area with respect to neighboring areas in Kuwait.
(Figure 14), Al Jahra area is located on the path of the predominant north-westerly wind that blows most of the times from this direction throughout the year transporting these pollutants to the city. Kuwait municipality’s 2003 records describe Al Jahra as a relatively run down residential suburb of central Kuwait, covering total area (11,230) km2. Al Jahra has a total population of (269,915), housed in (34,755) residential blocks [12]. The district is situated on the major free-way, 6th ring road at the north end.
The air quality data in Kuwait were collected using a fixed AQMS operated by KU-EPA, which measures continuously each 5 minutes the concentration level of various pollutants. This monitoring station is located above the main polyclinic in the middle of the residential area. The sampling site is selected on the basis of availability of power, security and elevated position.
2. Results and Discussions
The ambient air quality data for two extreme seasons (summer and winter) as hourly average concentrations and meteorological conditions were recorded utilizing monitoring stations fixed by KU-EPA at selected sites throughout the state of Kuwait. The pollutants measured were CO, CH4, PM10, NM-HC, SO2 and NO2. The collected meteorological conditions include wind speed and wind direction, ambient temperature and solar intensity. All of the data were recorded from a station placed 10 m above Al Jahra polyclinic located in the centre of commercial districts of the city. Figures 2-15 depict the behaviour of the measured pollutant concentrations and meteorological conditions in Al Jahra city during the designated seasons in year 2010.
2.1. Air Pollutants
2.1.1. Nitrogen Dioxide
Figure 2 presents seasonal average concentrations of
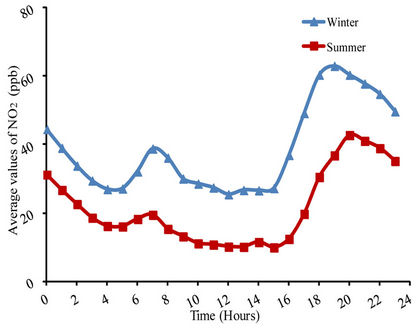
Figure 2. Hourly average NO2 concentrations for winter and summer seasons.
NO2 for each hour in year 2010. NO2 concentrations for winter season were consistently higher than summer values by about (50%) due to many reasons. The foremost cause for this behaviour is summer weather being extremely hot, humid and dusty forcing most of residents, especially foreigners, to travel to their respective countries for summer vacations. About 67% of the population in the state of Kuwait comprises expatriates as reported by ministry of planning in Kuwait (http://unstats.un.org/unsd/statcom/_seminar/kuwait.pdf). This in turn reduces human consumption of fossil fuel used in HVAC and vehicles, which decreases NO emission and hence NO2 formation. Also summer season is characterized as windy and dusty that dilutes and disperses the pollutants evenly decreasing the concentrations of pollutants in the air. The maximum concentration level was recorded during evening time at 19:00 hr for winter season, which is equal to 63.02 ppb (seasonal average). This concentration is in concordance with the results reported by Ettouney et al., [2] for years 2001 to 2004 where the highest yearly concentration was 46 ppb in winter season. The NO2 peak values were calculated for each year and plotted in Figure 3 that showed a linear trend, depicting the influence of population increase associated with increase in number of automobiles and power consumption. The minimum NO2 concentration was 9.9 ppb measured at 15:00 in the summer season, where most of the residents stayed indoor avoiding the extreme temperature (approaching 50˚C) during this hour.
2.1.2. Carbon Monoxide
The diurnal CO hourly seasonal average concentrations are plotted in Figure 4. Winter CO pattern exhibits two maxima; the first one at about at 7:00 am early morning with concentration of 1.22 ppm and the second one was at about 22:00 hr late evening with 1.62 ppm. This is attributed to heavy road traffic caused by people heading to work, school, shopping and other commercial activities. Generally, winter values are higher than those
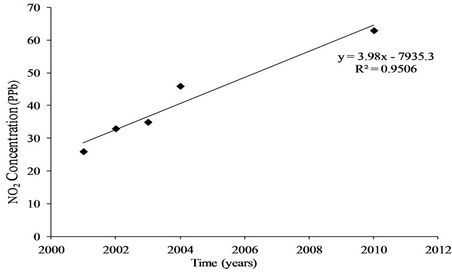
Figure 3. Maximum hourly average concentrations of NO2 for various years.
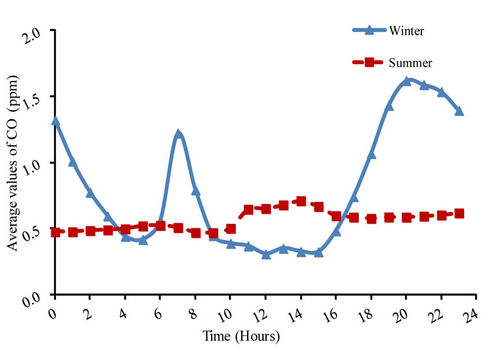
Figure 4. Hourly average CO concentrations for winter and summer seasons.
measured during the summer season about (80%); however there are times especially at low values where CO concentrations during the summer season exceed those recorded in winter season. This is partially caused by drivers (chauffeurs) who keep their cars running to maintain inner car temperatures when they are waiting in the parking area during the summer for quite sometimes to avoid hot weather. CO concentration, unlike NO2, is not showing any trend due to its long decay life about 7 days that forces constant background concentration which does not follow any typical behaviour.
2.1.3. Non-Methane Hydrocarbons and Methane
Diurnal variations for NM-HC and methane concentrations during year 2010 are plotted in Figures 5 and 6, respectively for winter and summer seasons. The concentration of NM-HC gas is most of the time above the standards set by Kuwait Environmental Public Authority, KEPA, (0.24 ppm average value from 6:00 to 9:00 am). The seasonal variation of these gases is different from NO2 and CO concentrations, showing no significant change in the concentrations of NM-HC between winter and summer seasons (less than 0.1 ppm) due to consistent emission from their sources petroleum related activities (oil production, transportation, refining, dispensing and consumption). However, for early morning and late afternoon hours higher values during winter season are recorded reaching maximum concentrations of 0.48 and 0.56 ppm respectively. Methane concentration is plotted in Figure 6, which exhibits almost constant concentration levels for both seasons with greater values recorded during winter season. NM-HCs are among primary pollutants responsible of harmful ozone formation in troposphere with the association of NOx and sunlight as O3 precursors. This coincides with high values measured for NO2 and ozone concentrations during afternoon time.
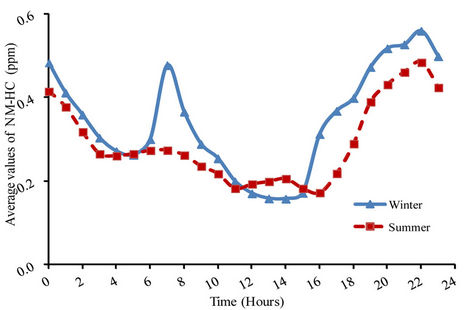
Figure 5. Hourly average NM-HC concentrations for winter and summer seasons.
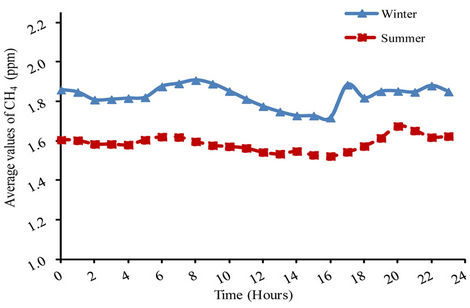
Figure 6. Hourly average CH4 concentrations for winter and summer seasons.
2.1.4. Carbon Dioxide
Unlike previous results, Figure 7 shows that summer season measures higher concentrations of CO2 than winter season. This is clearly due to full capacity operation of desalination and power plants units during summer season to reduce the deficit between demand and supply created by increase in urbanization and industrial development. The same figure shows that average ground level concentration of CO2 is almost the same throughout the year and equal to 381 ppm except for early morning from 6 - 8 am where slight change has been observed, however it is still noticeably higher than winter values. CO2 concentration has showed an increasing trend like most of the other places in the world.
2.1.5. Ozone
Figure 8 represents seasonal average ground level hourly concentration of ozone. It is obvious that there is a distinct maximum recorded during afternoon time in summer season and persisted for about two hr (16 to 18 hr). Assessment of O3 accumulation rate from 8:00 to 18:00, revealed two phases: a slow and a fast one, with different durations in each of the two seasons, due to different
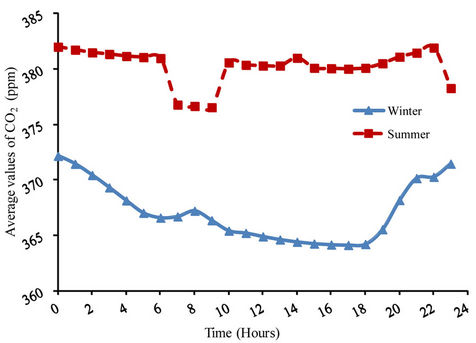
Figure 7. Hourly average CO2 concentrations for winter and summer seasons.
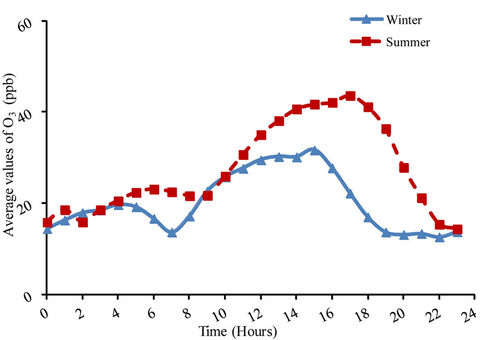
Figure 8. Hourly average O3 concentrations for winter and summer seasons.
levels of precursors. Before the sunrise, auto emissions (particularly NO) actually break down ozone present in the atmosphere and after sunrise, ozone concentrations will gradually increase because of the photodissociation of (NO2). Also, the constituen of automobile exhaust and the combination of the resultant atomic oxygen (O) and molecular oxygen (O2) already present in the atmosphere [13,14]. This corresponds to low concentrations of NOx such as NO2 (Figure 9). Similar trend of O3 concentration was observed by Ettouney et al., [2] with NOx associated with high temperature (solar UV radiation), certifying O3 generation based on its precursors strength. Therefore, concentration of O3 increases during afternoon time until it reaches a maximum value displayed by hump in Figure 8 and then drops down to reach a minimum value at about midnight, whereas, NO2 concentrations show exactly the opposite behaviour during the same time as shown in Figure 9. These results agree with reported values of Abdul-Wahab [3] that shows a decreasing trend in ozone concentration with an increase in
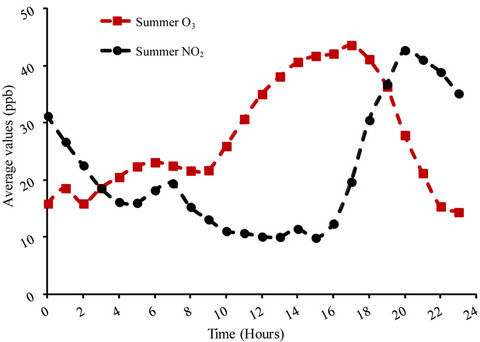
Figure 9. Hourly average O3 and NO2 concentrations for winter and summer seasons.
the concentrations of NOx. They also suggested that O3 increases with SO2, however a negative correlation obtained for temperature greater than 27˚C.
2.1.6. Particulate Matters (PM10)
Kuwait has one of severe arid climate in the world, where hot summer season persists for over six months a year with low annual rainfall of about 110 mm/yr and short winter time lasting for almost three months. There are natural dusty events throughout the year but more severe in summer due to Indian monsoon. Figure 10 shows the concentration variation of PM10 for winter and summer seasons; summer season PM10 concentrations are higher than winter seasonal values. It is clear that seasonal average hourly PM10 concentrations during summer season fluctuates between maximum value of 248.8 µg/m3 recorded at dawn time (3:00 am) and minimum value of 157.8 µg/m3 recorded at early afternoon (13:00). Low rate of precipitation and desertification aggravated land and soil erosion facilitating the dust to be carried by strong wind during the summer season forming the main natural source responsible for local PM10 concentration in Kuwait. The prevalent wind is 80% of the time blowing from North-west direction over the desert plans of Mesopotamia as shown in Figure 10. Other artificial source that recently became a factor is construction of new residential houses in Sa’ad Albduallah city across the street from Al Jahra and other development north of the Al Jahra area.
2.1.7. Sulfur Dioxide
As shown in Figure 11, higher concentrations of SO2 during winter were observed with multiple maxima measured for most of the day (10 hr - 20 hr). Similar trends were reported for the same city by Ettouney et al. [2] and M. S. Al-Rashidi et al., [15] for years 2001 to 2004 with variable magnitudes. Interestingly enough, the
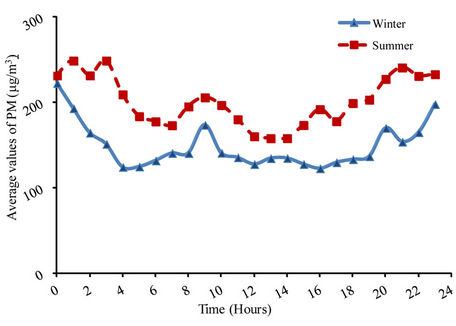
Figure 10. Hourly average PM10 concentrations for winter and summer seasons.
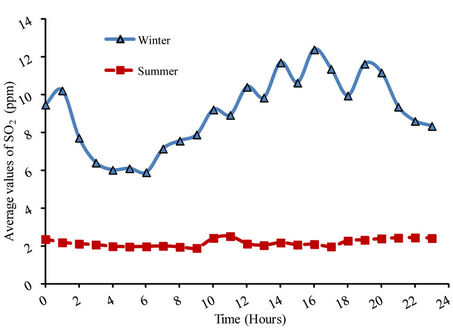
Figure 11. Hourly average SO2 concentrations for winter and summer seasons.
values recorded in the current study is less than those reported by Ettouney et. al. [2] for year 2001 and higher than the rest of the years (2002-2004). This was due to use of heavy fuel oil containing 4% sulphur in year 2001 in power industry and later gas oil and crude oil with low sulphur contents were used [8].
2.2. Meteorological Conditions in Al Jahra
The meteorological conditions play an important role in pollutant dispersion affecting the ground level concentrations in Al Jahra residential areas. In Kuwait, winters are characterized with cold and damp weather accompanied with occasional precipitation of rain that reduces the temperature even further to reach 1˚C during late night and dawn times. Wind conditions in winters are calm and stable, which causes poor pollutants dispersion and hence increases their concentrations in the air. Summer is dry and harsh with maximum day temperatures occasionally slightly exceeding 50˚C, which makes it almost intolerable without significant air conditioning. Winds are considerably turbulent and are predominantly blowing from northwest direction. Turbulent wind along with high inversion layer during the summer helps to dilute pollutants concentrations by increasing their dispersion rate.
2.2.1. Solar Intensity
Figure 12 shows the average solar intensity variations during winter and summer seasons in year 2010. The highest maximum hourly value of solar intensity is recorded during the summer season on the 3rd of July at 11:00 hr and equal to 774.1 w/m2. The average seasonal solar intensity for the entire summer season is 193.71 ± 0.89 σ w/m2, where standard deviation (σ) is equal to 227.470 w/m2. In the winter season, the hourly value of solar intensity is found to be 728.5 w/m2 recorded on 27th of March at 12:00 hour. The average seasonal solar intensity for the entire period of winter is 151.5 ± 0.85 σ w/m2, where standard deviation (σ) is equal to 204.7 w/m2.
2.2.2. Temperature Variations
As stated previously, the weather in Kuwait is harsh due to long summer season with high temperature reaching up to 50˚C (Figure 13). The highest temperature value
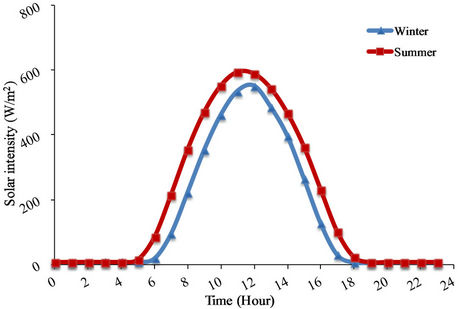
Figure 12. Average solar intensity variations during winter and summer seasons in year 2010.
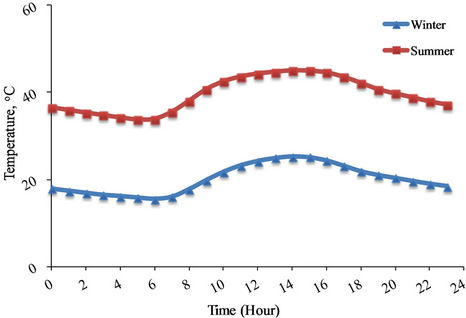
Figure 13. Average temperature variations during winter and summer seasons in year 2010.
was 50˚C recorded on 16th of July at 15:00 hr. The average seasonal temperature in summer season is 39.5 ± 0.85 σ, ˚C, where standard deviation (σ) is 4.65˚C. While in the winter season, the maximum temperature was 40.4˚C measured on 16th of March at 14:00 hr and the average seasonal temperature is 20.1 ± 0.78 σ˚C, where standard deviation (σ) is 5.77˚C.
Summer season is also characterized with high winds causing severe dust storms that disperse pollutants emissions. In winter, high ground level concentrations of pollutants are mainly influenced by more stable meteorological conditions.
2.2.3. Wind Speed and Direction
One of the main factors influencing pollutants ground level concentration is wind speed and direction. Therefore, Figure 14 is generated to show the wind rose for Al Jahra district during the summer season of year 2010, which indicates that the prevailing wind is from Northwestern direction.
Reviewing Figure 14, one can clearly see that the highest hourly based wind speed is equal to 6.94 m/sec measured on 4th of September at 04:00 hr, with 300.5˚ bearing North-western direction, reflecting the dominant influence of wind direction.
Figure 15 shows the wind rose for winter season. The maximum observed hourly average value is 6 m/sec on 18th of March at 13:00 hour, with 143.75˚ bearing southeastern direction, blowing from Arabian Gulf.
3. Conclusions and Recommendations
Assessment of air quality was carried out on data collected from Al Jahara monitoring station for year 2010 to investigate the impact of fossil fuel sources on hourly average pollutant concentrations for winter and summer seasons as precaution measurement for air quality assurance. All of the pollutants under study show higher concentration during winter season except for CO2, O3, and PM10, whereas, hourly average concentration for NM-HC and PM10 exceeded the permissible limits. It is obvious from the present work that the ground level concentration of O3 depends on NO2 concentrations and temperature (O3 precursors). Data from present and previous studies show increasing pattern of NO2, which exhibits a linear relationship with a time slope of 4 (ppb year-1).
Present results are accurate and reflect the actual pollutant concentrations as they vary each hour due to unstable seasonal meteorological conditions. Meteorological results revealed that higher values were obtained for all conditions (parameters) during the summer season, which significantly influenced the pollutant concentrations.
A well studied long-term policy plan must be prepared
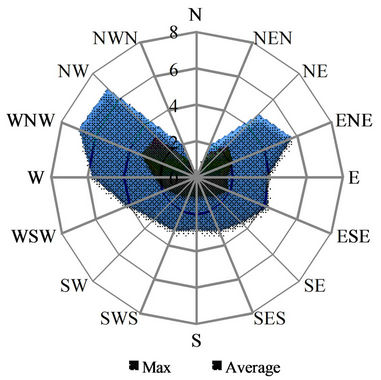
Figure 14. Winde rose for Al Jahra city for summer season.
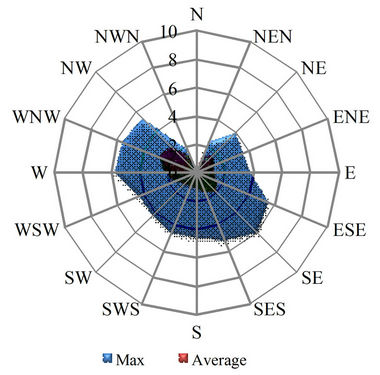
Figure 15. Winde rose for Al Jahra city for winter season.
and implemented soon to minimize the emission of such gases into the air to maintain air quality and healthy environment. This issue concerns GCC the most, which rely mainly on limited natural resources as fossil fuel. However, this resource has become less attractive because of the time constraints imposed by depletion and environmental degradation. Consequently, seeking other alternative sources of sustainable energy is imperative in order to survive and protect our environment such as biofuel, nuclear, solar, wind, hydro tidal and geothermal (renewable).
4. Acknowledgements
The authors want to thanks KU-EPA for providing air pollution data.
REFERENCES
- S. A. Al-Haider and S. M. Al-Salem, “Outdoor Air Quality Data Analysis of Al-Mansoriah Residential Area (Kuwait): Air Quality Indices Results,” Transactions on Ecology and the Environment, Vol. 116, 2008, pp. 189-196.
- R. S. Ettouney, J. G. Zaki, M. A. El-Rifai and H. M. Ettouney, “An Assessment of the Air Pollution Data from Two Monitoring Stations in Kuwait,” Toxicological and Environmental Chemistry, Vol. 92, No 4. 2010, pp. 655- 668. doi:10.1080/02772240903008609
- S. A. Abdul-Wahab, “Two Case Studies of Air Pollution from Oman and Kuwait,” International Journal of Environmental Studies, Vol. 66, No. 2, 2009, pp. 179-191. doi:10.1080/00207230903069403
- A. A. Ramadan, M. Al-Sudairawi, S. Alhajraf and A. R. Khan, “Total SO2 Emissions from Power Stations and Evaluation of Their Impact in Kuwait Using a Gaussian plume Dispersion Model,” American Journal of Environmental Sciences, Vol. 4, No. 1, 2008, pp. 1-12. doi:10.3844/ajessp.2008.1.12
- G. Andria, G. Cavone and A. M. L. Lanzolla, “Modelling study for Assessment and Forecasting Variation of Urban Air Pollution,” Measurement, Vol. 41, No. 3, 2008, pp. 222-229. doi:10.1016/j.measurement.2007.06.004
- E. Al-Bassam and A. Khan, “Air Pollution and Road Traffic in Kuwait,” WIT Press, Dresden, 2004, pp. 741- 750.
- W. S. Bouhamra and S. A. Abdul-Wahab, “Description of Outdoor Air Quality in a Typical Residential Area in Kuwait,” Environmental Pollution, Vol. 105, No. 2, 1999, pp. 221-229. doi:10.1016/S0269-7491(98)00221-8
- B. N. Al-Azmi, V. Nassehi and A. Khan, “SO2 and NOx Emissions from Kuwait Power Stations in Years 2001 and 2004 and Evaluation of the Impact of These Emissions on Air Quality Using Industrial Sources Complex Short-Term (ISCST) Model,” Water, Air, & Soil Pollution, Vol. 203, No. 203, 2009, pp. 169-178. doi:10.1007/s11270-009-0001-4
- S. A. Abdul-Wahab and W. S. Bouhamra, “Diurnal Variations of Air Pollution from Motor Vehicles in Residential Area,” International Journal of Environmental Studies, Vol. 61, No. 1, 2004, pp. 73-98. doi:10.1080/0020723032000130034
- R. Alenezi and A. Ashfaque, “Assessment of Ambient Air Quality in Al Jahra Governorate, for 2008,” International Journal of Energy and Environment, Vol. 5, No. 4, 2011, pp. 582-591.
- E. Al-Bassam, V. Popov and A. Khan, “Air Quality in the Vicinity of a Governmental School in Kuwait,” Transactions on Ecology and the Environment, Vol. 116, 2008, pp. 237-246.
- State of Kuwait, “Annual Statistical Abstract, 2008,” General Statistic Office, State of Kuwait, 2009.
- A.-N. Riga-Karandinos and C. Saitanis, “Comparative Assessment of Ambient Air Quality in Two Typical Mediterranean Coastal Cities in Greece,” Chemosphere, Vol. 59, No. 8, 2005, pp. 1125-1136. doi:10.1016/j.chemosphere.2004.11.059
- J. Seinfeld and S. Pandis, “Atmospheric Chemistry and Physics: From Air Pollution to Climate Change,” Wiley Interscience, New York, 1998.
- M. S. Al-Rashidi, V. Nassehi and R. J. Wakeman, “Investigation of the Efficiency of Existing Air Pollution Monitoring Sites in the State of Kuwait,” Environmental Pollution, Vol. 138, No. 2, 2005, pp. 219-229.
NOTES
*Corresponding author.