Journal of Environmental Protection
Vol. 3 No. 9A (2012) , Article ID: 22972 , 18 pages DOI:10.4236/jep.2012.329137
Evaluation of the Implementation of a Low Emission Zone in Lisbon
![]()
1CENSE—Center for Environmental and Sustainability Research, Faculdade de Ciências e Tecnologia, Universidade Nova de Lisboa, Caparica, Portugal; 2DCEA-FCT/UNL—Departmento de Ciências e Engenharia do Ambiente, Faculdade de Ciências e Tecnologia, Universidade Nova de Lisboa, Caparica, Portugal.
Email: pmfg@fct.unl.pt
Received June 30th, 2012; revised July 26th, 2012; accepted August 21st, 2012
Keywords: Low Emission Zone; PM10; NOx; Euro standards
ABSTRACT
The city of Lisbon, like many others in the EU region, introduced a Low Emission Zone (LEZ) as a tool for improving air quality in its city centre. This kind of emission reduction schemes is always controversial since it might lead to significant changes in the daily behaviours of its inhabitants. In order to evaluate the effects of the measure, an estimation of the impact of the introduction of the Lisbon LEZ was performed. Real traffic counting and fleet characterization combined with CORINAR-based emission inventory methodology allowed to estimate the impacts of three different scenarios applied to the “business as usual” condition (current vehicle fleet) ranging from “no circulation from noncompliant vehicles” to an “aggressive fleet renewal”. Results highlight the high percentage of atmospheric emissions of PM10 and NOx that might result from certain fleets like taxis and buses, especially because there was an emphasis in standardized/normalized estimations (emissions per 1000 vehicles) in order to allow different strategic approaches. The total reduction of PM10 emissions associated to each scenario vary between 6 ton∙year−1 (scenario 2) and 8 ton∙year−1 (scenario 1), or 25% and 34% less emissions. In terms of NOx emission reductions vary between 6 ton∙year−1 (scenario 2) and 57 ton∙year−1 (scenario 1), or 1% and 7% less emissions. The Lisbon LEZ is therefore much more efficient in reducing PM10 emissions compared to NOx. Major reduction in PM10 and NOx emissions are to be expected with a moderate intervention in the (relatively old) taxi fleet in Lisbon while for passenger cars the impact is limited. However in absolute terms and due to its urban mileage passenger cars should also continue being included in Lisbon LEZ. Simultaneously, an effort in the increase of dedicated lanes for public transport should be made, for further reductions in PM10 and NOx emissions.
1. Introduction
The highest probability of employment, higher variety of medical care, educational services and multiple cultural programs, associated to a higher education level are pushing countries populations to their cities. During the last 50 years it may be observed that Portugal is increasing its urban population at an average rate of 5% per decade; after the middle 80’s of the last century this rate is slightly higher, around 6 %. However, it was only in 2010 that Portugal reached the same percentage of urban population as Europe in 1960 (Figure 1, [1]).
Since 75% of the European population lives in urban areas, it causes stress and pressures to the urban environment, population health and quality of life (in general) and, ultimately, in their economic performance but also in their nearby rural sites [2,3]. Having these, and related issues in mind, a Thematic Strategy on the Urban Environment has been published by the European Commission [4] with the objective of contributing to “a better quality of life through an integrated approach concentrating on urban areas” and “to a high level of quality of life and social well-being for citizens by providing an environment where the level of pollution does not give rise to harmful effects on human health and the environment and by encouraging sustainable urban development”.
Within this Thematic Strategy, four main crosscutting aspects were considered, namely: sustainable urban transport, sustainable urban management, sustainable urban construction, and sustainable urban design. On its side, the Thematic Strategy on air pollution [5] in its aim to reduce air pollution concentration to “levels of air quality that do not give rise to significant negative impacts on,
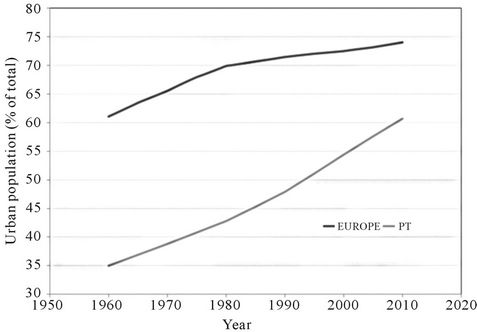
Figure 1. Urban population in Portugal (PT) and Europe between 1950 and 2010.
and risks to human health and the environment”, articulates its objectives with the other policy areas, as Energy, Transport, Agriculture, among others. Hence it is almost natural that searching for solutions on promoting better quality of life in cities, urban transport management in cities may be regarded as key target to focus on, since traffic is one of the major air pollutants emitters, includeing greenhouse gases, besides being a relevant noise producer [3]. These singularities led to several approaches in Europe and one of them was the adoption of the Action Plan of Mobility [6].
Restringing the access to vehicle in the cities may be, in principle, a valuable way to reduce noise and ambient concentrations of atmospheric chemical species. Due to the profusion of access restriction solutions among Europe there are studies that try to collect, summarise, analyse and give recommendations on this kind of solutions [7].
According to [8], assessment restrictions are classified into: 1) point based; 2) cordon based, 3) area license based pricing; 4) distance/time based.
1.1. Low Emission Zones
A Low Emission Zone (LEZ) is a defined area that can only be entered by vehicles meeting certain emissions criteria. A LEZ can lead to major air quality improvements because it capitalises on recent EU legislation for road vehicles, which have set progressively tighter emission limits on new vehicles manufactured over the past decade [8]. LEZ schemes can take many forms based on the geographical area they cover, the times at which the LEZ is in force, the vehicle emissions standards required for vehicles to enter the zone, the types of vehicles that need to comply with the LEZ, and the implementation and enforcement approaches used [8,9].
Due to its flexibility on rules to be applied (type of vehicle and restriction time of day) and inherent easiness on application and understanding it became one of the most popular measure adopted by several municipalities, especially those with more than 200,000 inhabitants [7].
In Asia, LEZ are also implemented in Tokyo [10] and tested in Beijing [11]. However, the broader application area license based pricing are more common and is also observed in the United States. What may be the oldest one was defined in Singapore, operating since 1975 [11, 12].
Over Europe, information on restriction areas on European cities particularly on LEZ is gathered in a web site, supported by the European Union [13]. The LEZ site has presently registered 323 cities where LEZ have, or are planning to be, implemented. Since the inner part of some Italian zones have LEZ (like Lombardy), in reality this figure is even greater.
With the LEZ implementation in an area of a city several objectives may be met simultaneously. Limiting vehicles circulation on a city area imposes subsequent reductions on emissions of air contaminants, greenhouse gases and noise, with positive impacts on population health, along with eventual compliance on climate change and energy policy commitments.
However, and as stated in the European LEZ site [13], the legal air quality standard compliance for human health protection is the major implementation driver of this type of emission reduction schemes across Europe, namely in London [14]. It is also the case of the city of Lisbon, Portugal.
1.2. Air Quality Levels in Lisbon
Lisbon environmental regional authority has identified exceedances to legal limit values (LV) plus margin of tolerance, set in the Directive 2008/50/EC on ambient air quality [15], in agglomerations in its area of jurisdiction, since 2001, as is the case of Northern Metropolitan Lisbon Area (AMLN).
The European Commission has had to start infringement proceedings against 10 Member States, including Portugal, for failing to comply with the EU’s air quality standard for dangerous airborne particles known as PM10 [16]. Currently there are 19 infringement cases pending against Member States which failed to comply with the air quality limit values for particulate matter and/or sulphur dioxide set out in [15]. Also, the Commission is currently assessing Member States’ notifications requesting extensions of the deadline to comply with the limit values for nitrogen dioxide (until 2015 at the latest). The Commission can also open an infringement case against a Member State that did request a time extension but for which this request was rejected [17].
Figure 2 shows the evolution of NO2 and PM10 levels and legal compliance relating to each limit value (annual
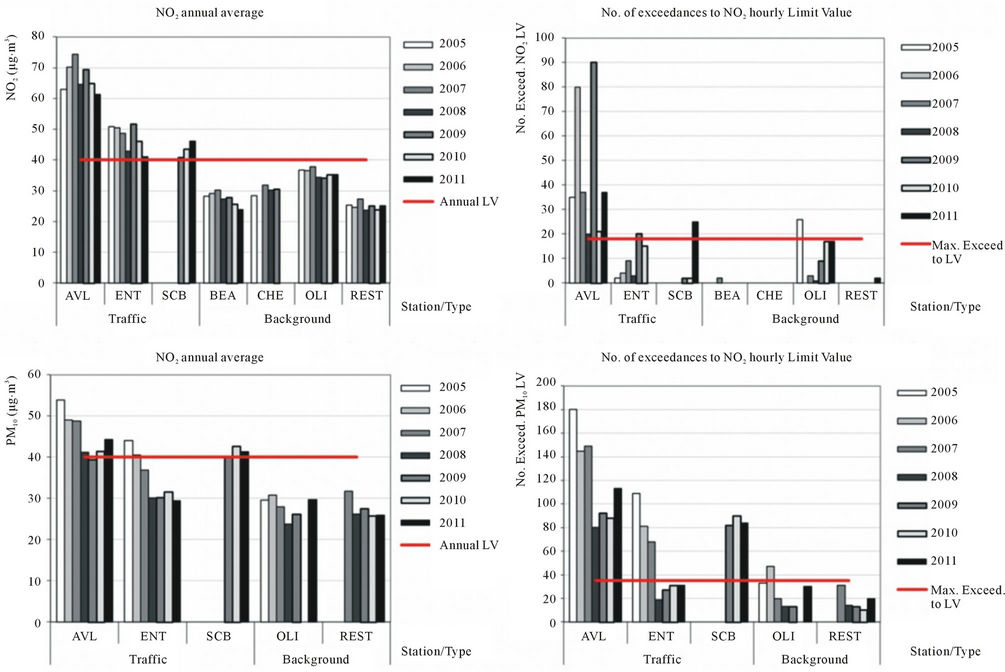
Figure 2. Evolution of NO2 and PM10 levels and legal compliance relating to each limit value, by station in AMLN agglomeration, in 2005-2011.
LV for NO2 and PM10, number of exceedances to NO2 hourly LV, and number of exceedances to PM10 daily LV), by air quality monitoring station (AQMS), in AMLN agglomeration, between 2005 and 2011.
In relation to NO2, annual average levels are improving in traffic stations Avenida da Liberdade (AVL) and Entrecampos (ENT), but not in Santa Cruz de Benfica (SCB), and in urban background stations the evolutionary trend is not clear. Exceedances to hourly limit value are not diminishing enough to avoid the incompliance scenario.
In general, annual averages of PM10 have been reducing through the years, but Lisbon still have problems in AVL and SCB once they are still above the LV. Exceedances to PM10 daily LV are far from achieving legal compliance in traffic stations.
In Lisbon region, the situation of exceedances to NO2 and PM10 limit values plus margin of tolerance resulted in the development of Air Quality Plans in order to improve air quality and to lead to compliance with air quality European standards. Several policies and measures have been identified and assessed in terms of feasibility and cost effectiveness. Some measures are already in place under the scope of other plans, others are to be implemented, with application scales ranging from local to national domain. These plans were published in legal documents as “Portaria n.˚ 715/2008”, of August 6th 2008, relating to the Air Quality Plan (AQP) [18] and “Despacho n.˚ 2763/2009”, of September 16th 2009 [19], relating to the Implementation Programme in which the measures of the AQP that should be adopted were selected, characterized, scheduled, identifying the entities responsible for implementation as well as indicators to assess their effectiveness. One of the measures was the implementation of the Lisbon LEZ.
1.3. Lisbon’s Low Emission Zone
The first Lisbon LEZ phase began in July 4th 2011, with the ban of pre-Euro 1 (also known as Euro 0) vehicles circulation in the city’s central area, between Marquês de Pombal and Terreiro do Paço (zone 1). The second phase began in April 1st 2012 and became more strict, requiring at least Euro 2 in zone 1 (original LEZ area) and Euro 1 in zone 2 (the new and extended area encompassing about 1/3 of the total city area). All vehicles were affected by the LEZ, including passenger cars, light duty and heavy goods vehicles, buses and motorcycles, regardless of the fuel type (petrol or diesel). The only exemptions are emergency and special vehicles, residents within the LEZ, and historical vehicles. Currently the LEZ operates on weekdays (Monday to Friday) from 07:00 to 21:00. Figure 3 shows the geographic extent of the LEZ, as well as its comparison with the total area of Lisbon.
In the present work, an ensemble of traffic related emissions was estimated based on inquires, automatic traffic counters, distances travelled (calculated through inquiries) and emission factors. The ensemble was obtained through the emission factors of vehicle types, their possible speed, area of Lisbon where they circulate, and distance travelled. Emissions characterisation of the Lisbon traffic fleets was made and the emission reduction for the programmed LEZ was estimated. Only zone 2 was considered, although the emissions scenarios were made assuming the more strict restrictions (with pre-Euro and Euro 1 vehicles banned).
2. Methodology and Data
The information required for the purpose of this work is relatively specific and therefore required the simultaneously use of automatically collected data and tailor-made inquiries including vehicles characterization and counting, and personal brief interviews to drivers.
2.1. Traffic Inquires
The traffic inquiries covered an area encompassing the Lisbon LEZ and its surroundings. 21 sampling points were chosen for this assessment. The main criterion for
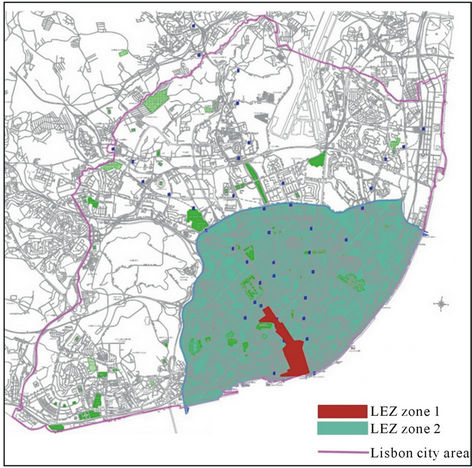
Figure 3. LEZ boundaries and comparison with the Lisbon city area [20].
each sampling point was to be located in places where traffic is frequent. Data were collected between 29th of September and 15th of October 2011, consisting of: 1) vehicle counting, 2) determination of vehicle age through license plate identification, and 3) surveys for drivers to estimate the average distance travelled per vehicle. This process was conducted for four different periods of the day on weekdays: 8:00-10:00, 10:00-14:00, 14:00-18:00 and 18:00-20:00.
Figure 4 shows the geographical location of all sampling points and the AQMS that measure NOx and PM10 simultaneously as well as the boundaries of the Lisbon LEZ.
2.2. GERTRUDE—Traffic Counters
For the definition of emission scenarios it is essential to gather information about the number of road vehicles circulating within the city of Lisbon. Therefore, a compilation and analysis of data from traffic counts in Lisbon was performed. The data was collected and provided by the municipality of Lisbon through the GERTRUDE system, an automatic monitoring system of traffic flow [21], with instantaneous traffic values which were subsequently averaged for 15 minute periods. Traffic data was collected between February 21st, 2011 and April 4th, 2012, thus encompassing the entry into operation of the Lisbon LEZ.
Given the high amount of data associated with traffic counts, the analysis was performed for a set of monitors considered representative of the three zones of the city, as shown in Figure 5:
• Central area—Praça do Comércio, Marquês de Pombal, Praça de Espanha, Campo Pequeno;
• Eastern area—Parque das Nações, Olivais;
• Western area—Alcântara.
After calculating the hourly averages of the traffic volumes on each monitoring counter, it was possible to estimate the Average Daily Traffic (ADT) in circulation in each of the three zones in both ways, divided into working days and weekends. It was observed that there are marked differences between zones (the western area showed the highest values of ADT, almost the double of the ADT of the eastern area) as well as between workdays and weekends (Table 1).
2.3. Emission Estimation
To be consistent with European Guidelines on air contaminants emissions inventories, vehicle emission factors were estimated based on “EMEP/EEA emission inventory guidebook 2009, updated June 2010” [22]. In this work focus is only made on NOx and PM10, since these are the pollutants emitted by road traffic that are responsible for the air quality exceedances in Lisbon, as seen
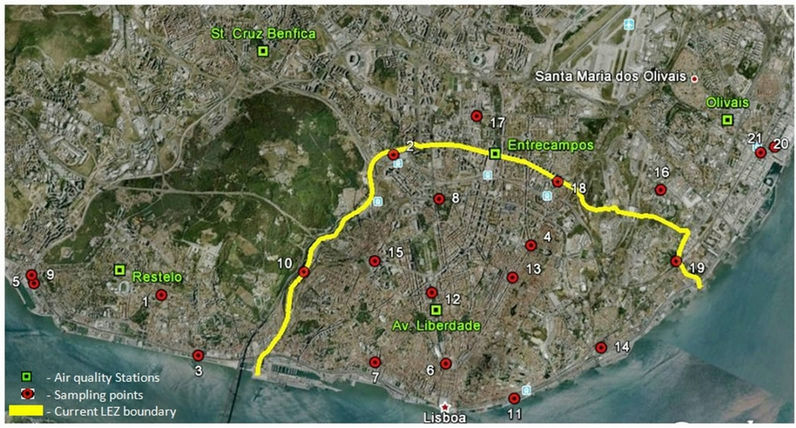
Figure 4. Geographical location of the sampling points and AQMS [23].
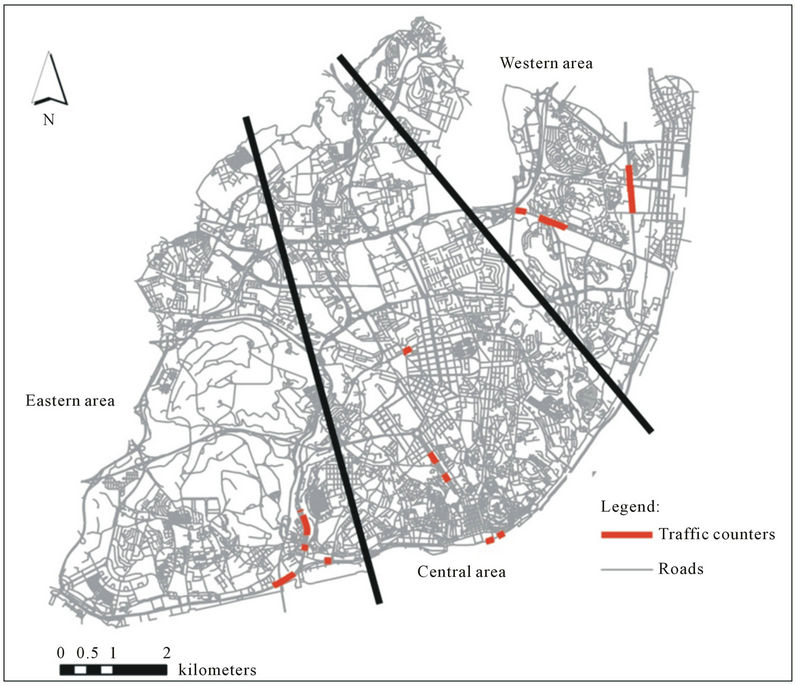
Figure 5. Traffic counters used for each of the three areas of the city.
above.
2.3.1. Taxi Fleet, Passenger, and Light Duty Vehicles
All the emission factors were estimated assuming that vehicles are circulating time enough to be considered as hot emissions. Vehicle emissions of PM10 and NOx vary according to fossil fuel type and are calculated based on speed dependent polynomials (See Tables 3-9 in Annex). Regarding pre-Euro emission standards, emission factors are also calculated attending to the engine capacity.
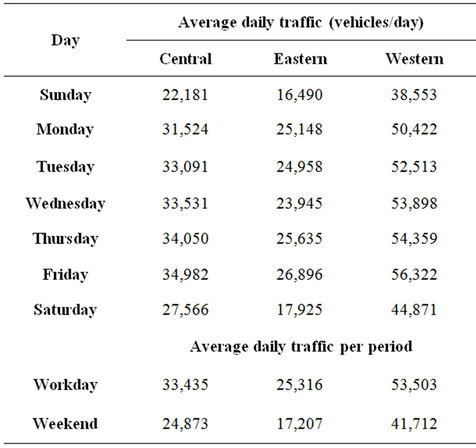
Table 1. ADT for each area analyzed by day of the week.
It is assumed for the present work that all taxis are considered diesel-fueled passenger cars and that all the light duty vehicles are also diesel-fueled.
The results of the inquiries were grouped based on the region of the town where they were made (Eastern area, Central area and Western area). For each area, maximum, median and minimum travel distances were determinedand the share of each vehicle types was calculated. For all the vehicles an ensemble of emission factors were calculated, assuming a range of traffic velocities depending on the region of Lisbon. Speed distributions were applied accordingly to the profiles shown in Figure 6. Faster circulation is assumed in the eastern and western areas of the city, since these are main corridors for traffic entrance into the city centre. The emissions were then calculated for the vehicles counted at each city area for the speed range between 10 and 45 km∙h−1. The final emission constitutes the weighted average for each type of vehicle according to the weights distribution shown in Figure 6. Velocities of 26 km∙h−1 are highlighted since it is the average speed for passenger cars within the city [24].
The same approach was used for light duty vehicles but in this case only diesel was included as fuel type. For motorcycles it was assumed that all of them are gasoline-fueled. Regarding taxis, the emission results were calculated for all the velocities shown in Figure 6, assuming that the speed distribution of these vehicles is the same as used for the eastern and western parts of the city. This was assumed due to the presence of dedicated corridors for public transport inside the city centre, which effectively achieve their objective, increasing their speed of circulation.
To estimate NOx and PM10 emissions by motorcycles,
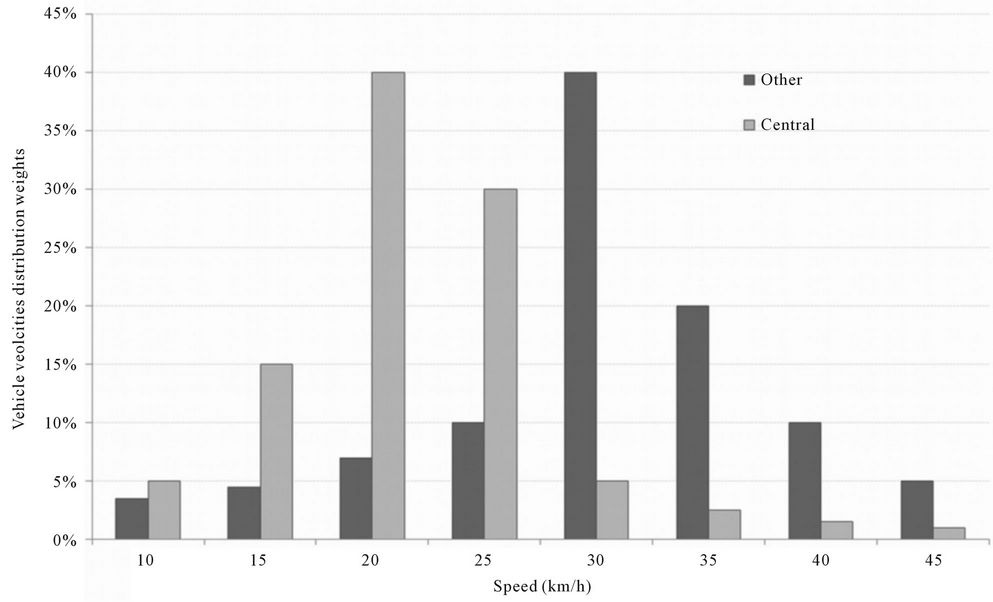
Figure 6. Speed distributions used on emission factors estimations for taxis and passenger cars over the three considered areas over the city of Lisbon (other refers to western and eastern areas).
these vehicles were also weighted by a speed distribution shown in Figure 7. Since 2 wheel vehicles usually circulate faster in urban areas, the velocities considered were shifted for higher values on 5 km∙h−1 and 20 km∙h−1 was imposed as lower speed. This distribution was applied over the three areas previously identified. All motorcycles were considered to have four stroke engines, with motor capacity between 50 and 250 cm3. Since all motorcycles sold in Europe must meet the less-stringent Euro 3 standard and not Euro 5, as applied to cars, there were no estimations of Euro 4 and 5 motorcycle emissions, but only up to Euro 3 (see also details on Annex 1).
2.3.2. Buses and Heavy Duty Vehicles
Heavy duty vehicles were not considered due to the fact that the number of these vehicles in the city centre is negligible. Their usual routes are defined by the municipality and consist of two main riverside roads, which access the port of Lisbon, and are located outside of the LEZ boundary.
Emission factors for buses were estimated based on an ensemble of assumptions related to speed, load, travelling conditions, travelled distance and lanes inclination. For buses, a mean travelled distance was considered for all calculations based on the yearly kilometres supplied by the public bus fleet operator (which gives around 150 km∙day−1) and all the buses were assumed to be always 50% full. However, the equations used for emissions estimations consider 0%, +2% and −2% lane inclinations, and the speed ranging from 10, 14 (average speed), 20 and 25 km∙h−1 [25] and [26]. According to the Euro standards associated to the bus fleet, emissions estimations include: Urban bus Midi ≤ 15 t Euro 3, Urban bus Standard > 15 - 18 t Euro 2, Urban bus Standard > 5 - 18 t Euro3, Urban bus Standard > 15-18 t Euro 4, Urban bus Standard > 15 - 18 t Euro 5, Urban bus articulated >18 t Euro 2 and Urban bus articulated > 18 t Euro 5. Exceptions to this methodology are natural gas vehicles, for which emission factors were calculated independently of vehicle speed.
Based on the traffic inquiries (see Figure 8, some preEuro and Euro 1 buses were counted.
Although there are some private fleet operators with older buses circulating in Lisbon, the total number of these vehicles and the kilometres that they circulate inside the LEZ are very low, and therefore can be considered negligible.
2.4. Emission Scenarios
For the calculation of the impacts of the LEZ in terms of emission reductions, three scenarios were adopted, each trying to simulate different behaviours on the part of
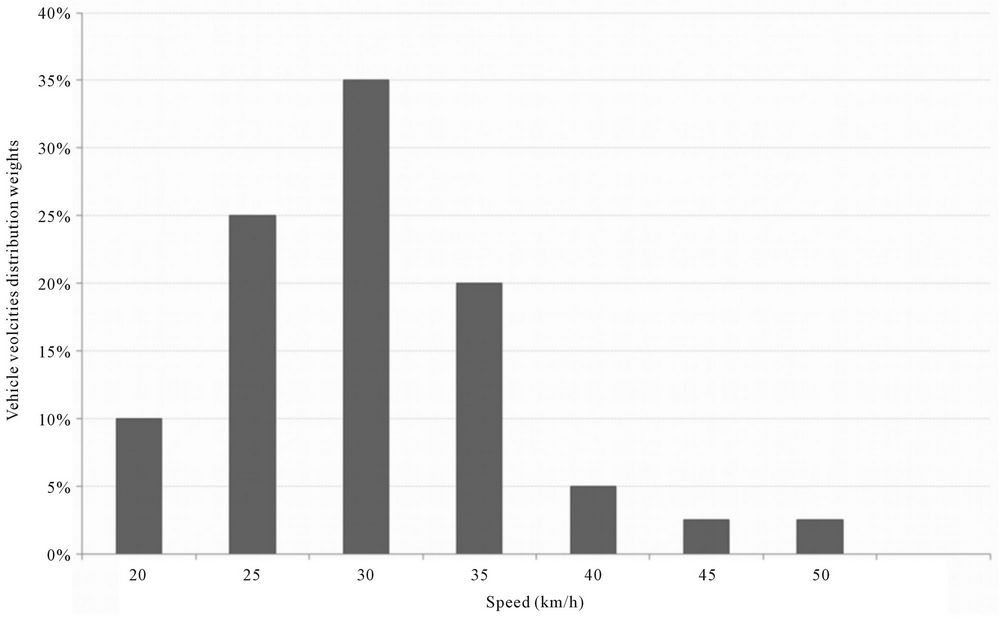
Figure 7. Speed distribution used on emission factors estimations for motorcycles.
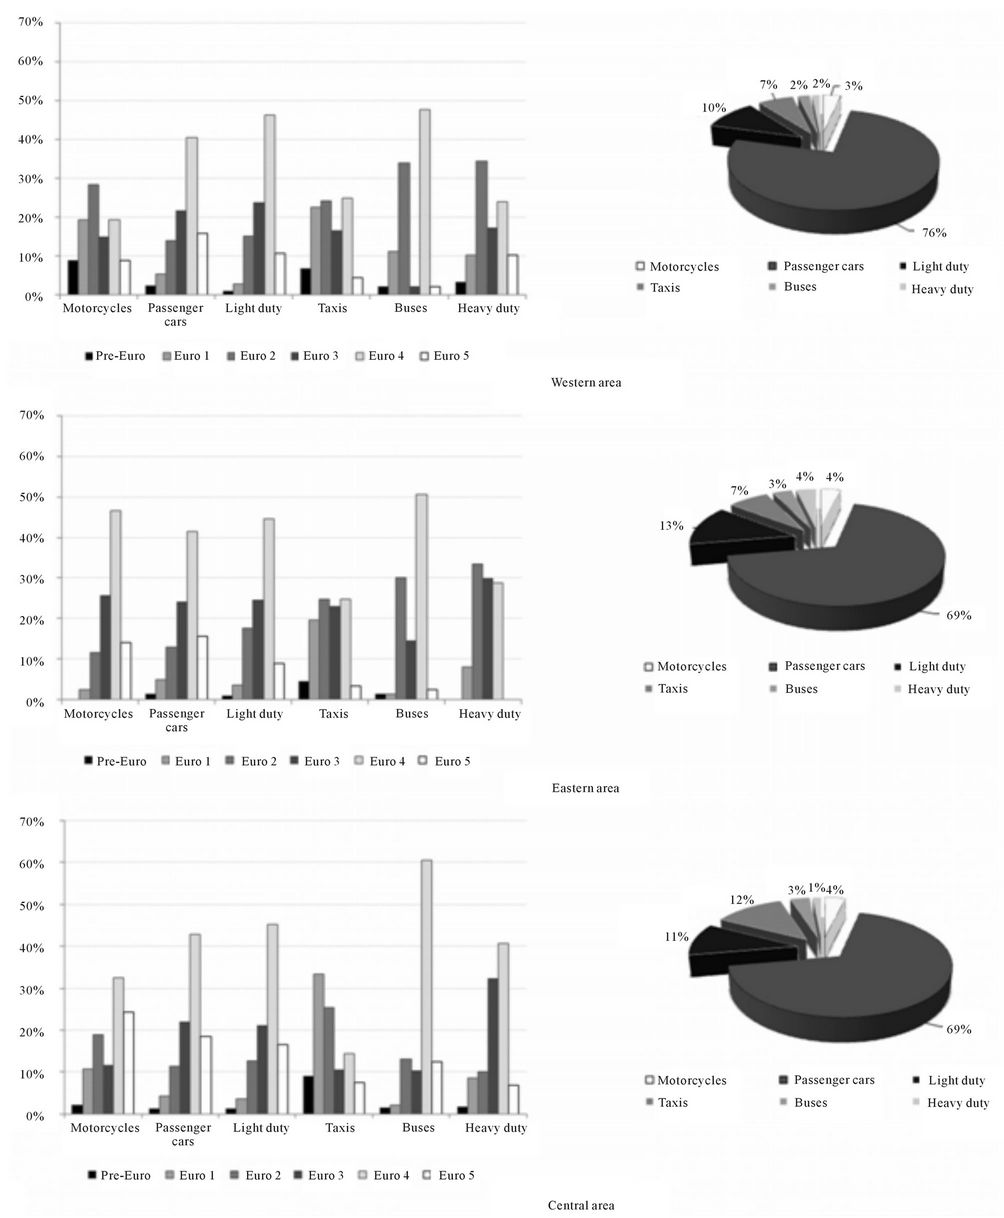
Figure 8. Traffic distribution according to Euro standard and vehicle type, for each area (central, eastern and western).
drivers whose vehicles, for being pre-Euro or Euro 1, could no longer access the Lisbon LEZ:
• Scenario 1: the owners of older vehicles (pre-Euro or Euro 1) simply stop driving in the LEZ, opting for alternative means of travel (re-routing or use of public transport). Most recent vehicles (post-Euro 2) continue to circulate normally. There is therefore no fleet renewal, and the total number of vehicles circulating inside the boundaries of the LEZ decreases.
• Scenario 2: the owners of older vehicles (pre-Euro or Euro 1) adapt to the LEZ by replacing their vehicles, although not all of them being new. There is therefore a “soft” fleet renewal, and the total number of vehicles circulating inside the boundaries of the LEZ remains the same, with the pre-Euro and Euro 1 vehicles being replaced by Euro 3, Euro 4 and Euro 5. These percentages correspond to the current weight of these emission standards in the vehicle fleet of Lisbon, for each of the three areas.
• Scenario 3: the owners of older vehicles (pre-Euro or Euro 1) adapt to the LEZ by replacing their vehicles with the most recent models (Euro 5). There is therefore an “aggressive” fleet renewal, and the total number of vehicles circulating inside the boundaries of the LEZ remains the same, with the pre-Euro and Euro 1 vehicles being totally replaced by Euro 5.
In each scenario the relative weight of diesel and gasoline in the fleet of passenger cars remains the same as determined in the vehicle surveys.
3. Results
3.1. Traffic Inquiries and Traffic Counts
The area covered in the traffic inquires was grouped into three traffic areas: western, eastern, and central area, reflecting the source of traffic flow from the surrounds to the city centre. Figure 8 shows that the vehicle distribution has similar patterns in the three areas, where passenger cars represent between 69% and 76% of all vehicles. Buses, light and heavy duty vehicles, taxis, and motorcycles are less or equal to 20% of all the vehicles.
Based on the traffic inquires a daily minimum, median, and maximum distance travelled were used, per area, on the emission estimations for passenger cars, light duty and motorcycle vehicle types (Table 2). For taxis, a single value for daily distance travelled of 150 km was assumed.
3.2. Emission Calculations
The emission factors associated with each vehicle type were calculated weighted with the speed distributions and distance travelled. Total emissions of PM10 and NOx were subsequently calculated, based on the total number of each vehicle type presented in Figure 9 as total emissions (in tonnes∙year−1) for each vehicle type. These emissions were considered the baseline scenario, i.e. without implementation of the LEZ (designated as “actual”). Buses present the same values for all the scenarios because the current fleet of the public operator is
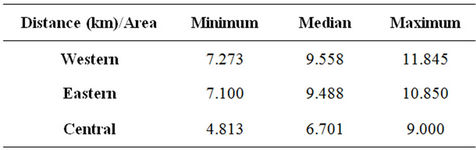
Table 2. Daily distance travelled (km) by vehicles, per city area.
already complying with the LEZ restrictions and therefore no emission reductions are expected.
Presently, and in spite of the low share of buses and taxis amongst the total vehicles registered during the inquiry phase, taxis and buses are responsible for the highest share of PM10 and NOx on total emissions, respectively. At present, the taxi fleet emits 11.7 ton·year−1 of PM10 and buses are responsible for 560 ton·year−1 of NOx. Figure 9 also shows the absolute values on PM10 and NOx emissions obtained for the three assessed scenarios. However, for a better perception of the comparative emission reductions the values was previously normalised to 1000 vehicles.
The baseline scenario varies with the fleet type, both in relative and absolute terms. The baseline emissions of PM10 and NOx and the corresponding reductions associated with each of the adopted scenarios (based on minimum, median and maximum distance travelled) are presented from Figures 10 to 13. Subsequent discussion will be made having in account the median distance travelled by each fleet type. However, looking at the Figures one can have an idea of the variation of emission reductions associated with distance travelled which is the same to say that these values may be regarded as upper and lower emission reduction boundaries.
The implementation of the LEZ may have different impacts depending on the pollutant: the measure may be more effective in reducing PM10 than NOx emissions. This can be explained by the fact that the taxi fleet, which is more affected by the LEZ than any other, is the biggest contributor to PM10. The largest contributor to NOx emissions is the bus fleet, which is not affected by the LEZ because the buses already comply with at least Euro 3 standard.
PM10 reductions are greater in scenario 1 which was expected since this scenario implies the reduction of the total number of vehicles circulating in the LEZ. The estimated reduction associated with scenario 2 gives more modest results although, probably, more realistic since a significant share of commuters won’t be able to afford a new vehicle, or change to alternative means of travel (public transport, re-routing, car-sharing, amongst others). Scenario 3 shows similar reduction percentages to scenario 1 with the exception of motorcycles with similar results, in terms of emission reductions, of the scenario 2.
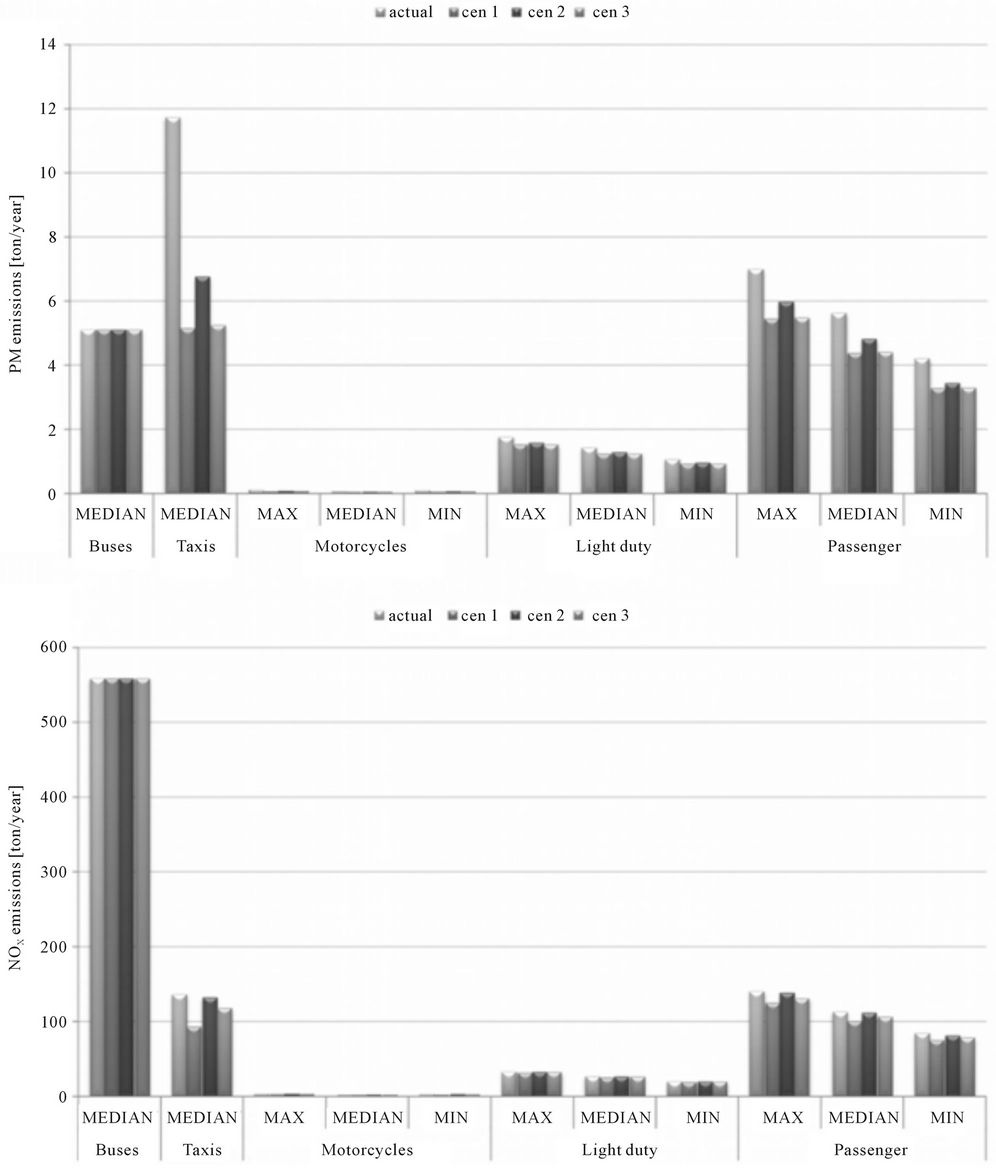
Figure 9. Absolute values of PM10 (top) and NOx emissions (bottom), by vehicle type, travelled distances, and median operational conditions for buses and taxis.
This was expected since the most recent emissions standard for 2-wheel vehicles is Euro 3 and not Euro 5.
In terms of NOx reductions, there is a large differential between scenario 1 and the other two scenarios, with reductions up to five times higher depending on fleet type. This might be explained by the fact that the effective reductions in NOx emissions associated with the most recent vehicles (Euro 4 and/or Euro 5) were not as
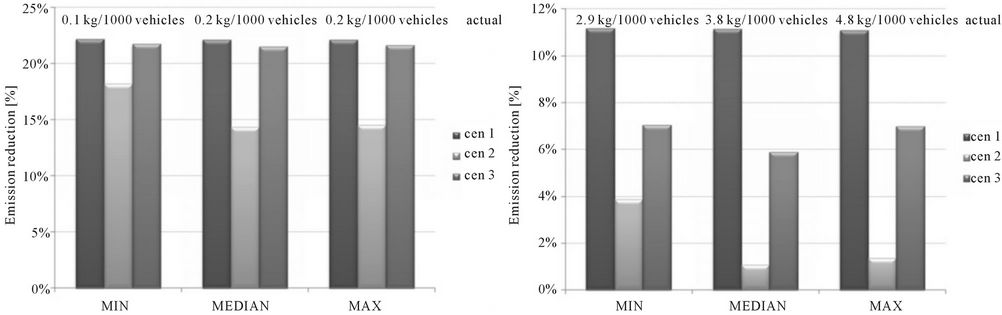
Figure 10. Minimum, median and maximum daily PM10 (left) and NOx (right) emissions (in kg/1000 vehicles) from the passenger car fleet in Lisbon and corresponding emissions reductions associated to each scenario.
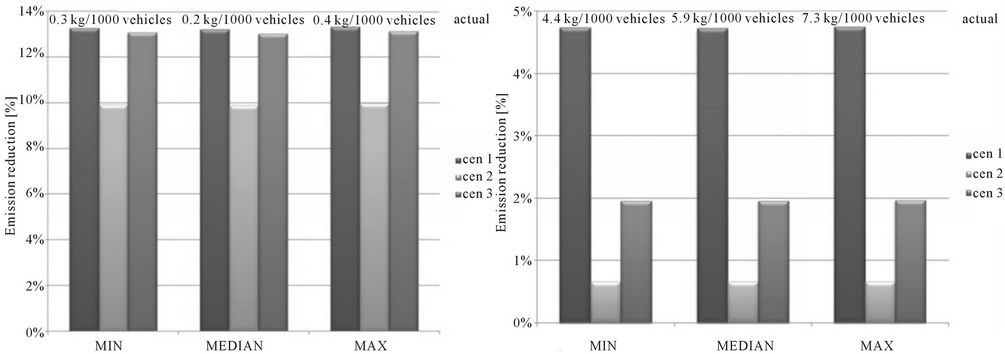
Figure 11. Minimum, median and maximum daily PM10 (left) and NOx (right) emissions (in kg/1000 vehicles) from the light duty vehicles in Lisbon and corresponding emissions reductions associated to each scenario.
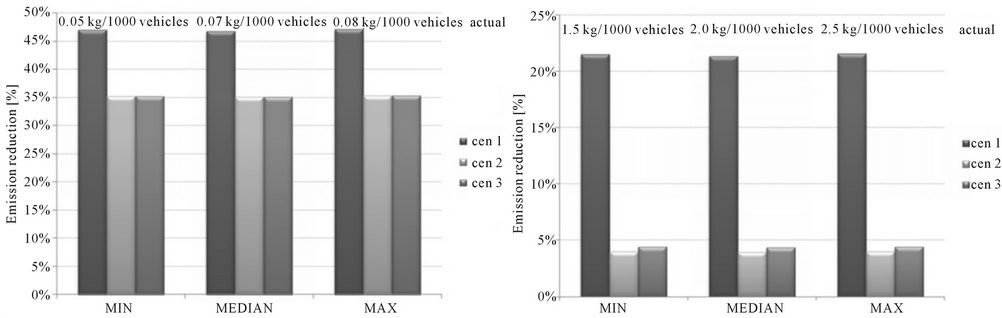
Figure 12. Minimum, median and maximum daily PM10 (left) and NOx (right) emissions (in kg/1000 vehicles) from the motorcycles in Lisbon and corresponding emissions reductions associated to each scenario.
significant as expected by the vehicle manufacturers and the European Commission [27]. The improvement of Euro 3 to Euro 5 did not deliver emission reductions as high as in the case of PM emissions. Scenario 2 showed extremely low reductions in terms of NOx emissions with values of less than 1% in the case of passenger cars and light duty vehicles.
The total reduction of PM10 and NOx emissions associated to each scenario is shown in Figure 14. Median PM10 emission reductions vary between 6 ton∙year−1
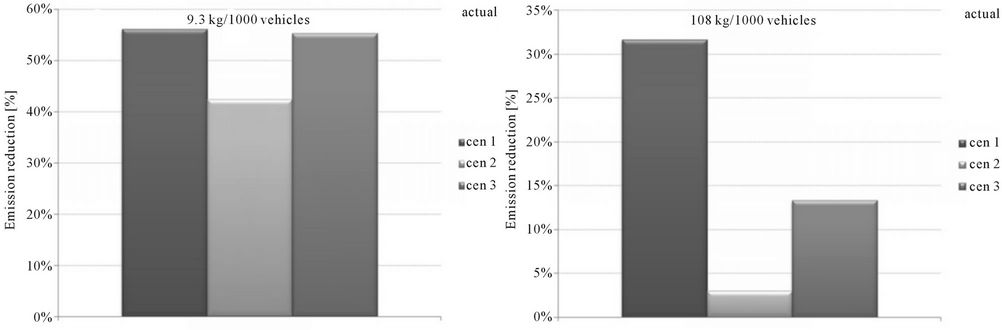
Figure 13. DailyPM10 (left) and NOx (right) emissions (in kg/1000 vehicles) from the taxi fleet in Lisbon and corresponding emissions reductions associated to each scenario.
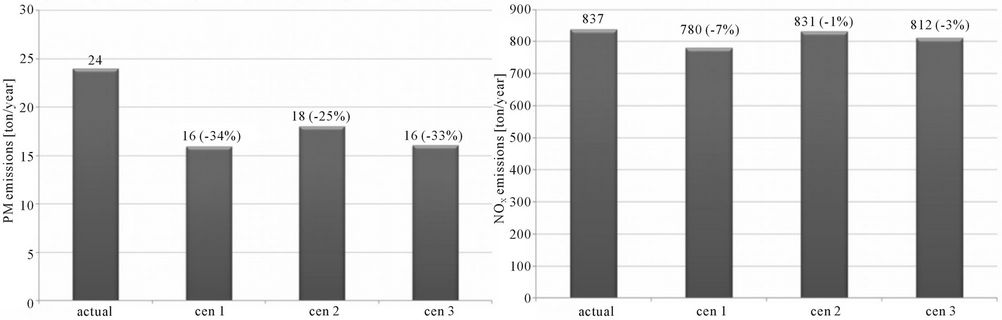
Figure 14. Reductions in total PM10 emissions (left) and total NOx emissions (right) in tonnes/year, resulting from the implementation of each scenario.
(scenario 2) and 8 ton∙year−1 (scenario 1), which correspond to 25% and 34% less emissions, respectively. In terms of NOx emission reductions vary between 6 ton∙year−1 (scenario 2) and 57 ton∙year−1 (scenario 1), which correspond to 1% and 7% less emissions, respectively. It is thus clear that the Lisbon LEZ is much more efficient in reducing PM10 emissions compared to NOx. The latter shows only minimal improvements with the implementation of the LEZ, even with the assumption that all pre-Euro and Euro 1 vehicles stop circulating inside its boundaries.
4. Final Remarks
Since 2011, a LEZ has been implemented in Lisbon, as part of the city’s Air Quality Plan to tackle air pollution by PM10 and NOx. The scope of present work was to estimate the impact of this measure in the emission reductions, assessing three different scenarios of fleet adaptation. The results show that the LEZ might achieve PM10 reductions between 6 and 8 tonnes·year−1 (25% to 34%) whereas NOx reductions were estimated between 6 and 57 tonnes∙year−1 (1% to 7%). In each scenario the disparities are attributed not only to the number of vehicles affected, but also to the share of each specific fleet, distance travelled and speed distribution.
From the results obtained it is clear that, in spite of its relatively low share in the total vehicles circulating in Lisbon, the taxi fleet has a disproportionately large impact in terms of PM10 emissions, whereas buses have a high influence on NOx emissions. Future and more stringent LEZ standards must be applied to buses, banning Euro 3 and older or increasing the share of natural gas vehicles in the bus fleet. In order to reduce PM10 emissions significantly a fiscal/economic effort must be done to accelerate scrapping of the older taxis and the subsequent replacing by Euro 5 vehicles.
For even greater emission reductions, an increase of dedicated public transport lanes should be implemented simultaneously, because of the subsequent increase of speed of buses and taxis. NOx emissions from buses might be reduced between 20% and 30% increasing the average speed from 14 km∙h−1 to 20 - 25 km∙h−1. PM10 emissions from taxis might also be reduced between 6% and 13% with a speed increase, from 26 km∙h−1 to 30 - 35 km∙h−1. These calculations were made but not presented because they were not in the main scope of this study.
5. Acknowledgements
The authors gratefully acknowledge the students of the discipline of Environmental Systems Monitoring 2011’ from FCT/UNL, without which part of the traffic inquiries were virtually impossible to do in such a short term, the Municipality of Lisbon for providing relevant data on traffic counting, the Comissão de Coordenação e Desenvolvimento Regional de Lisboa e Vale do Tejo (CCDRLVT) for providing air quality data from monitoring stations, and Pedro Torres for its personal communication on speed vehicles distribution in Lisbon city, acquired on previous studies but not published.
REFERENCES
- The World Bank, “Urban Population (% of Total),” 2012. http://data.worldbank.org/indicator/IS.VEH.ROAD.K1/countries/1W-PT-EU?display=graph
- European Environmental Agency, “Ensuring Quality of Life in Europe’s Cities and Towns. Tackling the Environmental Challenges Driven by European and Global Change,” EEA Report, 2009.
- European Environmental Agency, “The European Environment State and Outlook 2010—Urban Environment,” 2010.
- European Commission, “Communication from the Commission to the Council and the European Parliament on Thematic Strategy on the Urban Environment,” 2006.
- European Commission, “Thematic Strategy on Air Pollution,” 2005.
- European Commission, “Communication from the Commission to the European Parliament, the Council, the European Economic and Social Committee of the Regions—Action Plan on Urban Mobility,” 2009.
- Tender No. TREN/A4/103-2/2009, “Study on Urban Access Restrictions,” 2010. http://ec.europa.eu/transport/urban/studies/doc/2010_12_ars_final_report.pdf
- M. Browne, J. Allen and S. Anderson, “Low Emission Zones: The Likely Effects on the Freight Transport Sector,” International Journal of Logistics Research and Applications: A Leading Journal of Supply Chain Management, Vol. 8, No. 4, 2004, pp. 269-281.
- National Society for Clean Air (NSCA), “Low Emission Zones 2003 NSCA Special Report,” 2003.
- H. Wolff and L. Perry, “Keep Your Clunker in the Suburb: Low Emission Zone and Adoption of Green Vehicles,” 2012. http://faculty.washington.edu/hgwolff/LEZ.pdf
- F. Costabileand and I. Allegrini, “A New Approach to Link Transport Emissions and Air Quality: An Intelligent Transport System Based on the Control of Traffic Air Pollution,” Environmental Modelling& Software, Vol. 23, No. 3, 2008, pp. 258-267 doi:/10.1016/j.envsoft.2007.03.001
- M. Li, “Estimating Congestion Toll by Using Traffic Count Data—Singapore’s Area Licensing Scheme”, Transportation Research Part E, Vol. 35, No. 1, 1999, pp. 1- 10.
- Low Emission Zones in Europe, 2012. http://www.lowemissionzones.eu
- F. Kelly, B. Armstrong, R. Atkinson, H. R. Anderson, B. Barratt, S. Beevers, D. Cook, D. Green, D. Derwent, I. Mudway and P. Wilkinson, “The London Low Emission Zone Baseline Study. Investigator’s Report, in the London Low Emission Zone Baseline Study with a Critique by the HEI Health Review Committee,” Research Report 163, Health Effects Institute, Boston, 2011.
- Directive 2008/50/EC of the European Parliament and of the Council of 21 May 2008 on Ambient Air Quality and Cleaner Air for Europe.
- “Air Pollution: Commission Starts Legal Action against 10 Member States over Airborne Particles,” 2009. http://europa.eu/rapid/pressReleasesAction.do?reference=IP/09/174
- “Parliamentary Questions: Answer Given by MrPotočnik on Behalf of the Commission,” 2012. http://www.europarl.europa.eu/sides/getAllAnswers.do?reference=E-2011-011869&language=DA
- Portaria n. 715/2008, Diário da República, 2.ª Série, N. 151, 6 de Agosto de 2008, pp. 34959-34968.
- Despacho n. 20763/2009, Diário da República, 2.ª Série, N. 180, 16 de Setembro de 2009, pp. 37809-37866.
- “Zona de Emissões Reduzidas. Cidade de Lisboa,” 2002. http://www.cm-lisboa.pt/archive/doc/ZER-seg_fase_MapaZER_2aFase.pdf
- V. Góis, H. Maciel, P. Torres, S. Mesquita, F. Ferreira, C. Almeidaand and L. Nogueira, “A Detailed Urban Road Traffic Emissions Inventory Model Using Aerial Photography and GPS Survey,” 16th Annual International Emission Inventory Conference—Emission Inventories: Integration, Analysis, and Communications, Raleigh, 2007. http://www.epa.gov/ttn/chief/conference/ei16/session9/gois.pdf
- “EMEP/EEA Air Pollutant Emission Inventory Guidebook—2009. Parte B: Sectorial Guidance Chapters, Energy, Combustion, Road Transport,” European Environment Agency, 2010. http://www.eea.europa.eu/publications/emep-eea-emission-inventory-guidebook-2009/part-b-sectoral-guidance-chapters/1-energy/1-a-combustion/1.a.3.b-road-transport-gb2009-update.pdf
- H. Brás, “Avaliação dos Benefícios da Implementação de Zonas de Emissões Reduzidas em Lisboa,” Master Thesis, Universidade Nova de Lisboa, Lisboa, 2012.
- P. Torres, “Velocidade méDia de Circulação de veÍculos Ligeiros na Cidade de LISBOA. 28 de Fevereiro de 2012,” Comunicaçãoescrita (Average Speed of Circulation for Passenger Cars in Lisbon. Personal Communication).
- “EMEP/EEA Emission Inventory Guidebook 2009, Parte B: Sectorial Guidance Chapters, Energy, Combustion, Road Transport,” European Environment Agency, 2012. http://www.eea.europa.eu/publications/emep-eea-emission-inventory-guidebook-2009/part-b-sectoral-guidance-chapters/1-energy/1-a-combustion/1.a.3.b-road-transport-gb2009-update.pdf
- “EMEP/EEA Emission Inventory Guidebook 2009, Parte B: Sectorial Guidance Chapters, Energy, Combustion, Road Transport,” Annex Files for Heavy Duty Vehicles Emission Estimation, European Environment Agency, 2009. http://www.eea.europa.eu/publications/emep-eea-emission-inventory-guidebook-2009/part-b-sectoral-guidance-chapters/1-energy/1-a-combustion/1.a.3.b-road-transport-annex-hdv-files.zip
- R. Hagman, K. I. Gjerstad and A. H. Amundsen, “NO2 Emission from the Fleet of Vehicles in Major Norwegian Cities—Challenges and Possibilities towards 2025,” 2011.
Annex
The Emission factors used on the emission estimation over Lisbon are included as an annex to be highlight among the multitude of values given by the EMEP/EEA air pollutant emission inventory guidebook (URL3). Details are given for the vehicle type considered in the main text, Passenger cars, taxis, light duty vehicle, motorcycle and buses.
Passenger cars, taxis, light duty vehicle
Passenger cars, taxis, light duty vehicle emission factors for PM and NOx according to the EURO emission standard
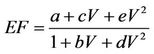 [g∙km−1].(1)
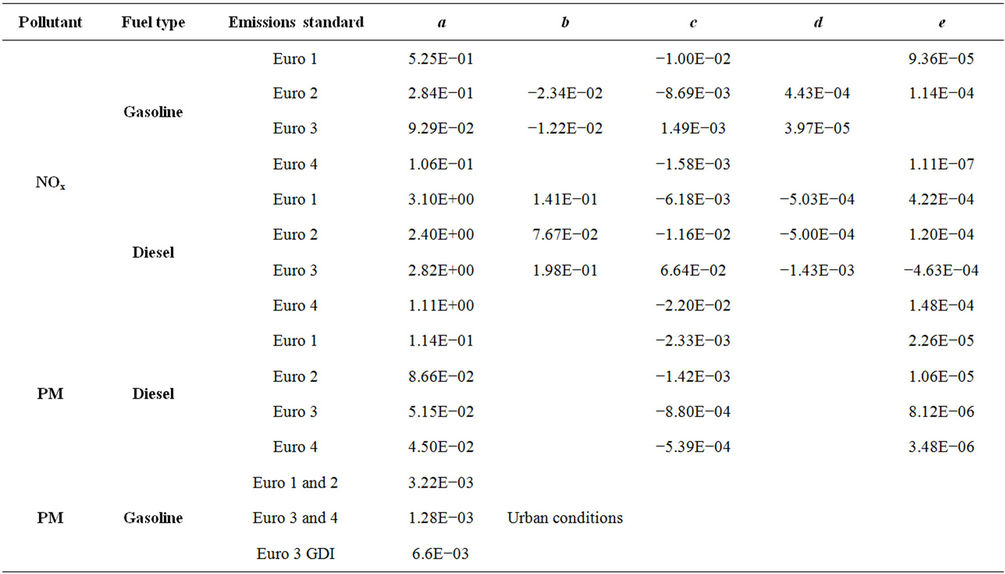
Table 3. Euro 1 to 4 emission standard coefficients to be applied to Equation (1) for light vehicles emission factors estimation’ and for particulate matter gasoline’.
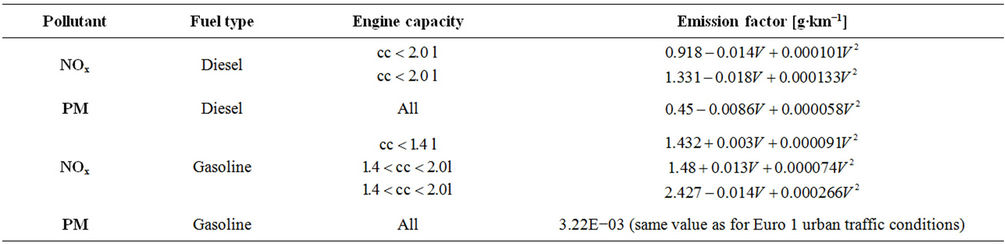
Table 4. Pre-Euro 1 emission factors estimation’, for all vehicles capacities, speed ranges of 10 - 130 km·h−1.
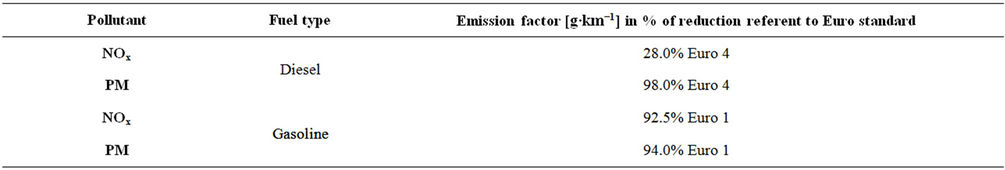
Table 5. Euro 5 emission factors estimation’.
Motorcycles
To estimate emissions from motorcycles between 50 and 250 cm3 the applied equation was:
 [g∙km−1].
The motorcycles NOx emission factors coefficients used in the above equation, for the allowed velocities are presented in Table 6.
The emission factors used on the PM emissions estimation of four-stroke conventional and post-Euro motorcycles of engine displacement between 50 and 250 cm³ are 2.0E−2 g∙km−1 for Pre-Euro and Euro 1 emission standards and are 5.0E−2 g∙km−1, applied in the speed range between 10 and 110 km∙h−1.
Buses
Passenger cars, taxis, light duty vehicle emission factors for PM and NOx according to the EURO emission standard. Three street slopes were considered according to the Lisbon city topography, 0%, −2% and + 2%. The equations presented here regard only the standard emissions according to the city fleet. Bus passenger load capacity was fixed in 50%.
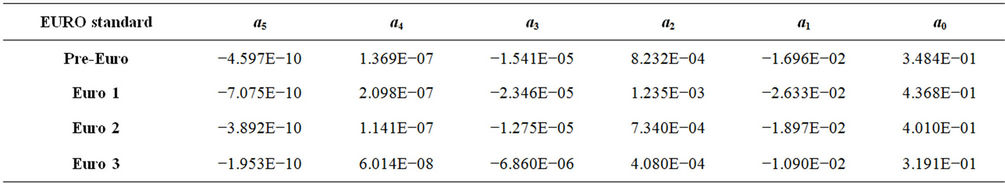
Table 6. Motorcycle NOx emission factors estimation’.
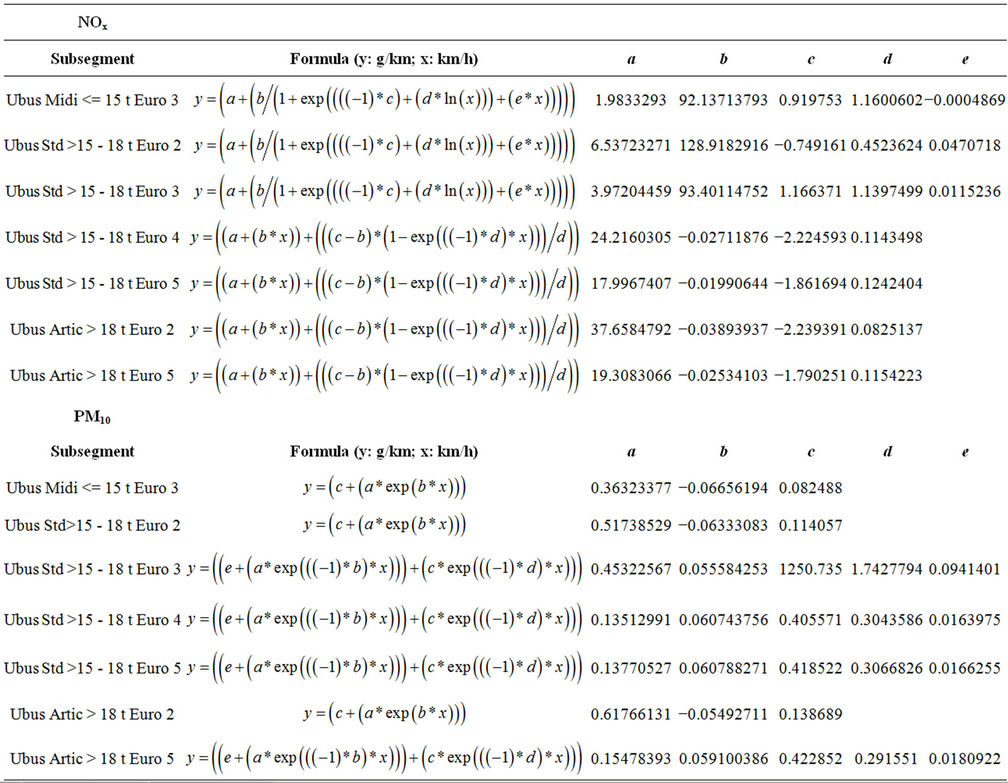
Table 7. NOx and PM emission factors for a bus in a 0% slope and a passenger load of 50%.
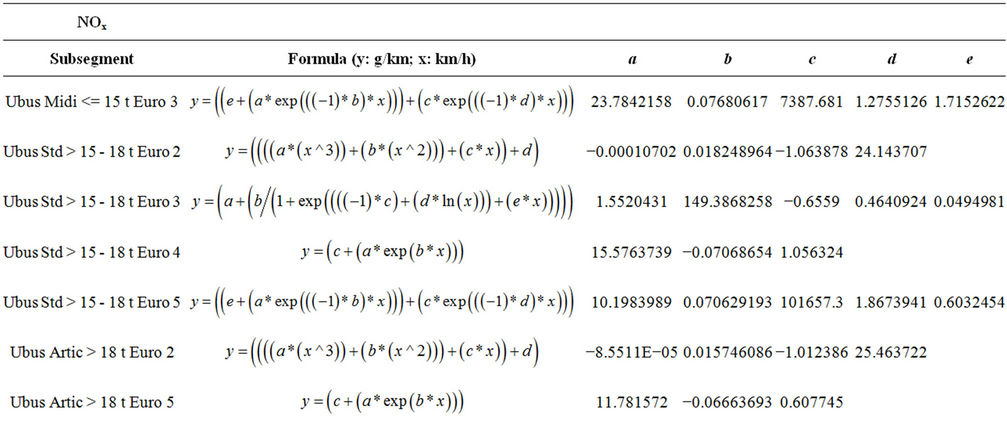

Table 8. NOx and PM emission factors for a bus in a 2% slope with a passenger load of 50%.
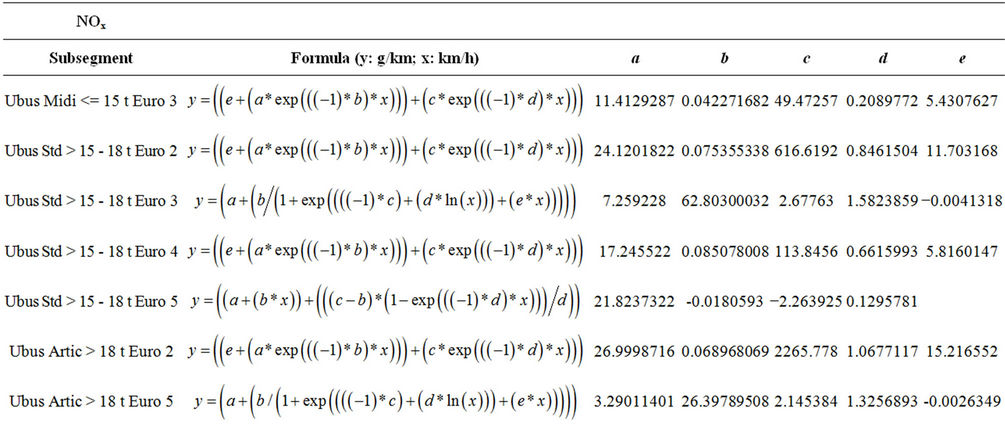
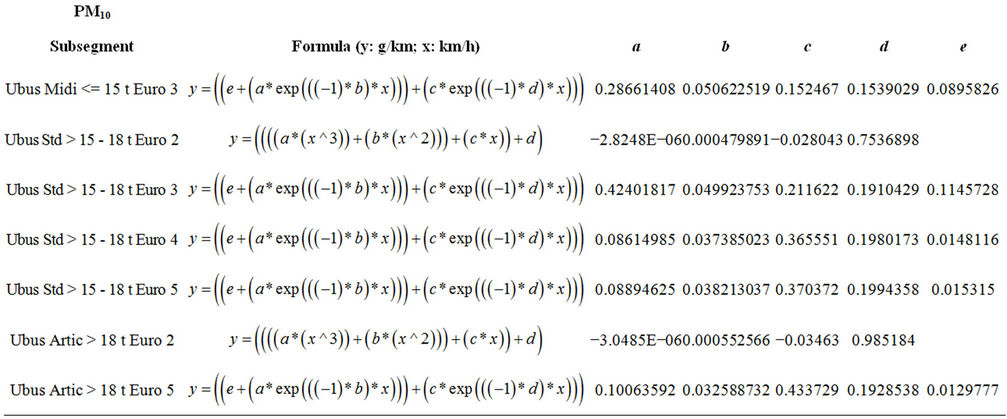
Table 9. NOx and PM emission factors for a bus in a 2% slope with a passenger load of 50%.