Journal of Environmental Protection
Vol. 3 No. 7 (2012) , Article ID: 21132 , 7 pages DOI:10.4236/jep.2012.37075
Trace Element Concentrations in Some Traditional Diets Consumed in Selected Parts of Eastern Province of Kenya
![]()
1Institute of Nuclear Science and Technology, University of Nairobi, Nairobi, Kenya; 2Department of Chemistry, School of Physical Sciences, University of Nairobi, Nairobi, Kenya.
Email: dmaina@uonbi.ac.ke, muchori27@yahoo.com
Received March 9th, 2012; revised April 8th, 2012; accepted May 9th, 2012
Keywords: Trace Elements; diets; semi-arid; Kenya
ABSTRACT
Dietary quality is vital in maintaining sound nutritional status. The ecological conditions thus influence the type of diets and their nutritional quality. The purpose of this study was to determine the trace element/mineral content of some of the commonly consumed diets in Machakos, Kitui, Makueni and Mwingi districts. Decorticated maize, beans and finger millet flour samples were purchased from the local markets. For each category, a total of ten samples were collected from each district. The samples were put in plastic bags, sealed and transported to the laboratory in the Institute of Nuclear Science & Technology, University of Nairobi for preparation and analysis. The cooking of the samples was carried out according to local traditional methods. In the decorticated samples, mean copper concentrations were observed to be below 20 μg∙g−1; mean zinc concentrations ranged from 34 to 63 μg∙g−1 and mean manganese concentrations were in a similar range of 34 to 78 μg∙g−1. The mean iron concentrations were significantly high with a range of 161 μg∙g−1 to 287 μg∙g−1. A similar trend was observed in the beans where the mean copper concentrations varied from 11 to 33 μg·g−1, mean zinc concentrations ranged from a low value of 24 μg·g−1 to a high value of 35 μg∙g−1, mean manganese concentrations varied from 33 μg∙g−1 to 98 μg∙g−1 and the mean iron concentrations ranged from 227 μg∙g−1 to 647 μg∙g−1. The cooked Muthokoi samples from Machakos district had relatively high mean trace element concentrations: manganese—109 μg∙g−1; iron—280 μg∙g−1; copper—19 μg∙g−1; and zinc—41 μg∙g−1. The only exception was mean iron concentrations which were extremely high in samples from Mwingi District where the concentrations varied from 73 μg∙g−1 to 1597 μg∙g−1. In finger millet flour, the mean manganese concentrations varied from 95 to 290 μg∙g−1, whereas the mean iron concentrations ranged from 127 μg∙g−1 to 259 μg∙g−1. In contrast, the mean copper and zinc concentrations were low in comparison to the manganese and iron concentrations. As a whole, the mean copper concentrations in the diets are significantly low compared to the other three trace elements. However, the total content is not necessarily a reflection of the amount assimilated in the body. Finger millet was found to be an excellent source of manganese and iron whereas beans were observed to be good sources of iron. All the food crops were observed to poor sources of copper.
1. Introduction
Trace elements play an important role in human health because they participate in biological functions that contribute to growth and good health. The trend roles of metal ions in health and disease range from the requirement for intake of essential trace elements to toxicity associated with metal overload. One of the major sources of trace elements is the diet consumed. Therefore, it is important to ensure that the consumed diet contains the essential minerals in adequate quantities. Inadequate nutrition of these elements compromises immune function, causes impaired physical and mental growth in children, affects reproductive performance, and reduces work productivity and consequently affects a country’s economy [1-3]. According to WHO, deficiency in iron, vitamin A, and zinc rank among the top ten leading causes of death in the developing countries [4]. Most of the people affected by trace elements deficiency do not show any clinical symptoms nor are they aware of the deficiency; this is a phenomenon referred to as hidden hunger. In most African rural areas the composition of their diets is influenced by the geographic and climatic conditions as well as cultural practices. Maziya-Dixon et al. [5] have reported that most societies in the sub-Saharan Africa consume diets which are mainly plant-based and the intake of animal products is low. As such in these regions deficiencies of vitamin A, iron and zinc are widespread. According to Vasal [6], maize is one of the world’s three primary cereal crops. In Africa, it provides a large proportion of the daily intake of energy and other nutrients including micronutrients. Other food crops typical for Africa are beans, cassava, yams, sorghum and finger millet. Cereals have been reported to be good sources of iron, copper and manganese where they contribute 20 - 30 mg∙kg−1 manganese while whole grain provides 30 - 50 mg∙kg−1 zinc [7]. Analysis of cereals by Hemalatha et al. [8], reported zinc content of 1.082.24 ± 0.07 mg per 100 g and 6.51 ± 0.17 mg per 100 gm iron in sorghum; 1.73 ± 0.04 mg∙gm−1 zinc and 2.13 ± 0.05 mg∙g−1 iron in finger millet, and 1.48 ± 0.12 mg∙gm−1 zinc and 3.21 ± 0.12 mg∙gm−1 Fe in maize. Edeogu et al. [9] reported values of iron, zinc and copper in Nigerian maize to be 44.00 ± 0.60, 25.23 ± 0.03, 2.75 ± 0.00 μg∙g−1 respectively while in beans they reported 48.00 ± 0.30 μg∙g−1 Fe, 26.00 ± 0.00 μg∙g−1 Zn and 4.83 ± 0.12 μg∙g−1 Cu.
Although some work have been carried out by Munene [10] and Okoth [11] on the trace elements in some foodstuffs consumed in Central and Western provinces, very little work has been done to investigate the levels of trace elements in the food consumed by the Kamba community who reside mainly in the Eastern province. This work was carried out to fill this gap by analysing trace element levels in food crops grown in the Southern part of the Eastern province of Kenya. This area is described as arid and a semi-arid (ASAL) with the main food crops being maize, beans, and finger millet.
2. Materials and Methods
2.1. Study Area
The study area included Machakos, Makueni, Kitui and Mwingi districts which constitute the Kamba land in Eastern province of Kenya as shown in figure 1. Kitui district is the largest measuring 20,436 km2 and lies on the southeast bordering the Coast province. Mwingi is the second largest measuring almost 10,000 km2 and borders North Eastern province and parts of Coast province. Makueni district measures 8161 km2 and lies on the southwest bordering the Rift valley province while Machakos district is the smallest measuring 6015 km2 and borders Nairobi and Central provinces.
2.2. Sampling
The following samples were collected: decorticated maize (Zea mays), locally known as Muthokoi, beans (Phaseolus vulgaris) and finger millet flour (locally known as Wimbi). Ten samples of each category were purchased from each district headquarters during a market day when farmers and consumers come from different parts of the district for trade. During the purchase, questionnaires were used to obtain information on the food origin, ingredients used in the staple foods, the proportions of these ingredients, the preparation methods and the cooking time. Samples were put in plastic bags, sealed and transported to the laboratory for analysis.

Figure 1. Map of Kenya on the right and of the Eastern Province on the left.
2.3. Preparation of Staple Food (Muthokoi)
Preparation of muthokoi was done according to the practice normally used by the Kamba community. Properly decorticated maize grain were sorted, mixed with beans in the ratio of 2:1 respectively and washed. Cooking was done by boiling in a clay pot for 2.5 hours at a temperature of 97˚C. At this temperature and time the food was well cooked. No water was discarded after preparation.
2.4. Preparation of the Samples for the Total Trace Element Determination
Samples of decorticated maize, beans and muthokoi (Cooked food) were dried for 48 hours at 75˚C in an oven. Each sample was then ground separately using a mortar and pestle until the sample was relatively fine. For finger millet flour, it was dried for 12 hours at 75˚C. The ground material was further pulverized to its finest form such that it passed through a 75 mm sieve. For each sample, three pellets, each weighing between 100 - 200 mg∙cm−2 and 2.5 cm in diameter were made using a pellet-pressing machine by applying 10 - 20 tonnes of pressure. In case the pellet did not bind well, starch or cellulose was added as a binder, then the sample and cellulose homogenized using mortar and pestle after which pellets were made. The composition of the sample and the cellulose was determined so that the dilution factor could be calculated.
3. Results
The results of trace element mean concentrations in raw decorticated maize samples collected from the four districts are presented in Table 1. The manganese concentrations ranged from 24 µg∙g−1 in Kitui district to 122 µg∙g−1 in Machakos district. The mean manganese con- centrations were lowest in samples from Mwingi district (34 µg∙g−1) and highest (78 µg∙g−1) in samples from Machakos. The iron concentrations in the samples from Kitui, Mwingi and Makueni districts are all almost in the same ranges: 92 - 244 µg∙g−1, 67 - 207 µg∙g−1 and 75 - 222 µg∙g−1 respectively with mean values around 160 µg∙g−1. In contrast, the iron concentrations in samples from Machakos district are all above 149 µg∙g−1, a value close to the mean concentration of the other three districts. In addition, the iron concentrations in samples from Machakos district ranged from 149 - 397 µg∙g−1 with a mean of 279 µg∙g−1. Copper concentrations in 80% of all the samples from the four districts were below the detection limits (11 µg∙g−1), an indication of the low levels of copper in the samples. Only eight samples had concentrations above the detection limits and the range was 14 to 24 µg∙g−1. The samples from Mwingi and Makueni districts had almost the same zinc concentration all within the range of 16 ± 5 to 46 ± 8 µg∙g−1 and having a mean concentrations of 34 µg∙g−1 in Mwingi district and 36 µg∙g−11 in Makueni district. On the other hand, the samples from Machakos were observed to contain zinc
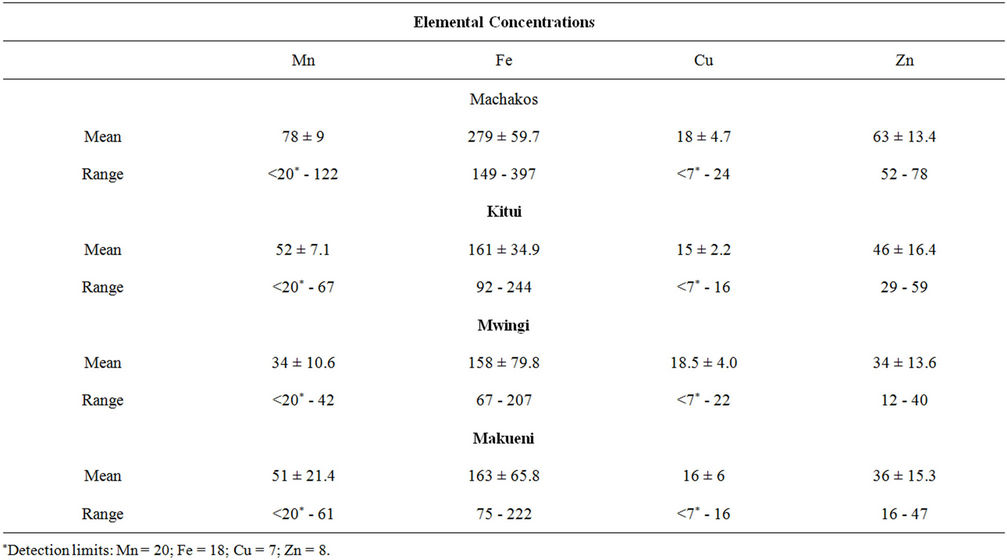
Table 1. Trace elements in decorticated maize (μg∙g−1).
concentrations in the range of 52 to78 µg∙g−1 and a mean concentration of 63 µg∙g−1.
Beans are a common constituent of many Kenyan diets. Their use is versatile in that they can be cooked on their own, can be mixed with undecorticated or decorticated maize. In the former it is referred to as Githeri while in latter it is Muthokoi. Three types of beans are grown in the four districts: Nyayo beans, yellow beans and brown beans. The trace element concentrations determined in bean samples obtained from the four districts are presented in table 2. The manganese concentrations ranged from 33 to 98 µg∙g−1 while the iron concentrations ranged from 227 to 647 µg∙g−1 with yellow beans having the highest concentration in three of the four districts. Among the four trace element analyzed in beans, iron was found to be the highest with a mean ranging from 366 ± 33 to 446.00 ± 151 µg∙g−1. The mean copper concentrations ranged from 17 ± 5.1 to 28 ± 6.2 µg∙g−1 whereas the mean zinc concentrations varied from 22 - 42 µg∙g−1.
Muthokoi is a common food among the Akamba community. The decorticated maize is mixed with beans and as a result of the decortication the food cooks faster. The results of the trace element mean levels in samples from the four districts are presented in Table 3. In all the districts, the iron concentrations was the highest ranging from 42 ± 4 to 911 µg∙g−1 and a mean value range of 91 ± 31.8 to 443 ± 191 µg∙g−1. Samples from Makueni had the lowest mean iron content of 91 ± 31.8 µg∙g−1 while samples from Mwingi contained the highest, having a range of 73 ± 13 µg∙g−1 to 911 ± 105 µg∙g−1. The mean manganese concentrations varied from 44 ± 13.2 µg∙g−1 in samples from Makueni to 109 ± 19.5 µg∙g−1 in samples from Machakos district. Just slightly over half of all the samples had copper concentrations which were above the detection limits. The mean copper concentrations ranged from 8 ± 2.0 µg∙g−1 in Kitui district to 19 ± 5.7 µg∙g−1 in Machakos district. The zinc concentrations were highest in samples from Machakos district whereas the concen- trations in the other districts were similar in range having mean concentrations of 27 µg∙g−1, 23 µg∙g−1 and 23 µg∙g−1 in Kitui, Mwingi and Makueni districts respectively.
Finger millet is a crop usually grown in the semi-arid areas and is therefore a strong component of the diets of this region. Its flour is frequently used for preparing porridge for the children and the elderly. The mean concentration values determined in the finger millet samples are presented in Table 4. Unlike all the other samples finger millet was found to have the highest manganese concentration with a range of 95 ± 46 to 245 ± 85 µg∙g−1. Iron was also found to be high and it showed the same trend observed in other samples. Just as observed in the other food crops, copper content was also found to be low in finger millet. Most of the samples had zinc concentrations which were between 11 ± 2 and 29 ± 6 µg∙g−1 with one sample having a value of 52 ± 7 µg∙g−1.
4. Discussion
In all the foodstuff analysed, iron recorded the highest
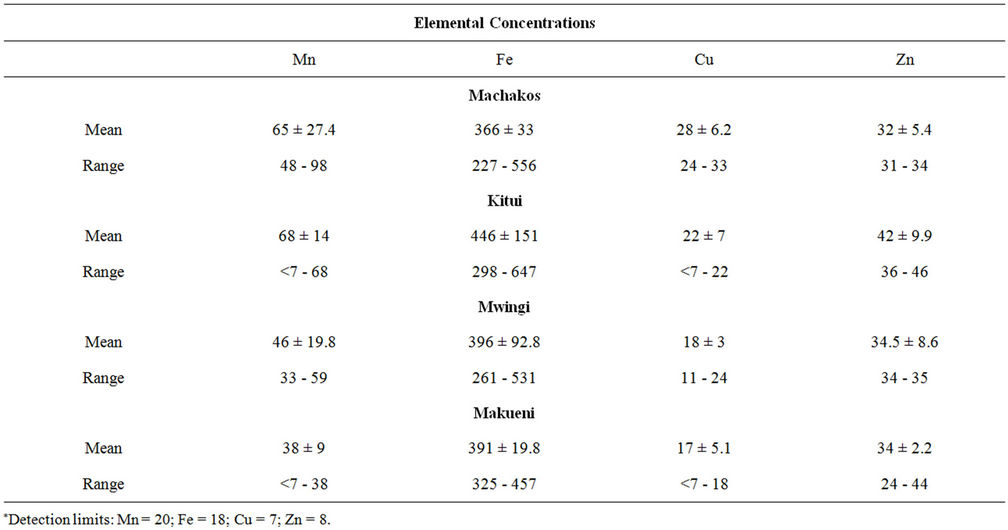
Table 2. Trace elements in beans (μg∙g−1).
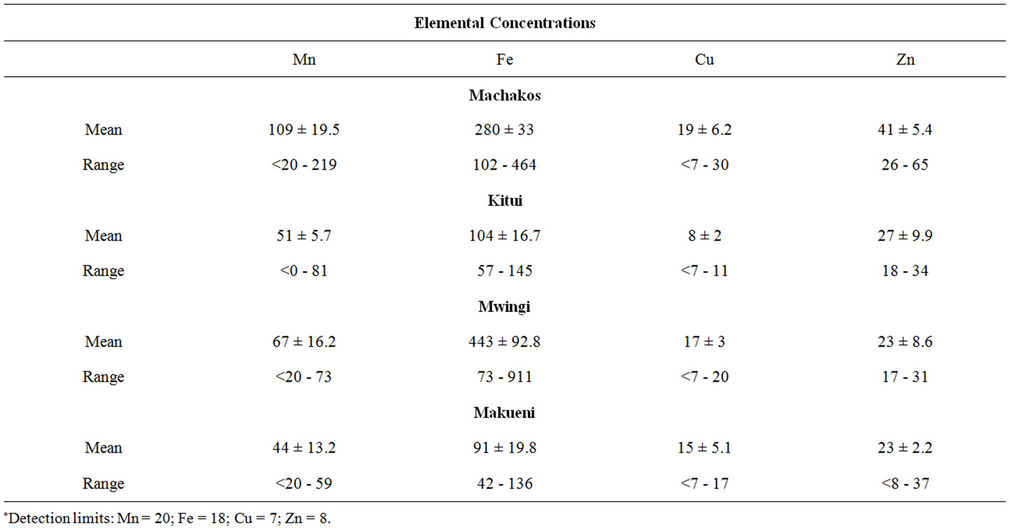
Table 3. Trace elements in muthokoi (μg∙g−1).
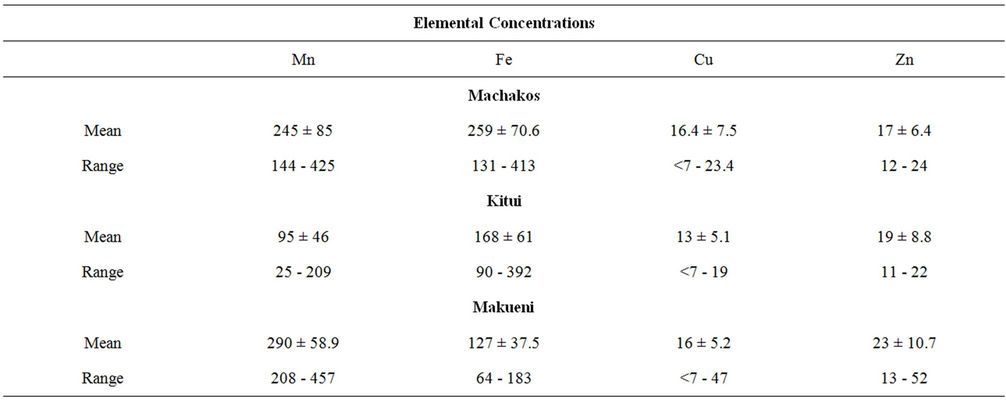
Table 4. Trace elements in finger millet (Wimbi) (μg∙g−1).
values ranging from 91 - 559 µg∙g−1. On average, beans registered the highest iron content in all the four district among all other foodstuffs. Okoth has reported iron content in maize, beans and finger millet from western province of Kenya as 69, 184, and 127 µg∙g−1 respectively; these values have been found to be lower than that found in the present work [11]. But the trend of iron content in the three foodstuffs is the same in both studies where beans have the highest and maize the lowest. Mamiro et al. [12] also reported iron content in finger millet and kidney beans to be 5.48 mg per 100 g and 9.84 mg per 100 g dry matter (DM) respectively while a value of 6.53 mg per 100 g iron in finger millet and 5.16 mg per 100 g iron in bean have been reported [13].
The data shows that decorticated maize had the highest mean total zinc content. The zinc content in the three foodstuffs from four districts did not show any significant variation. According to Sandstrom [14] whole grains, pulses, legumes and lean meat provide the highest total zinc content of 25 - 50 µg∙g−1. The mean zinc content found in this work ranges from 17 - 63 µg∙g−1. Finger millet has also been found to contain 2.05 mg per 100 g zinc dry matter (DM) while kidney beans were found to have a total of 3.25 mg per 100 g zinc DM [12]. Anthony and Chondra [13] also reported values of 2.02 mg per 100 g zinc DM in finger millet and 3.1 mg per 100 g zinc DM from beans.
Finger millet had the highest mean manganese content (95.00 ± 46 - 290.0 ± 58.9 µg∙g−1) in all the districts in comparison to decorticated maize, beans and muthokoi. Kabata and Pendis [15] have reported that there is little variation of manganese levels ranging from 15 - 80 µg∙g−1 throughout the world. Apart from finger millet which recorded high values than those given by Kabata and Pendis [15], manganese values for other samples fall within the reported values. Sankara and Deosthale [16] also reported manganese content in finger millet to range from 11.5 - 55.9 µg∙g−1 while Munene reported manganese values ranging from 46 - 250 µg∙g−1 [10]. The manganese values obtained in this work are close to those obtained by Munene [10].
Copper content in samples from the four districts is relatively low in comparison to the other samples. The finger millet recorded the lowest values ranging from 11.00 - 16.40 µg∙g−1 while beans from Machakos recorded the highest with a mean value of 28.00 µg∙g−1. Work done by Munene [12] reported that the manganese levels in maize and finger millet from different parts of the country to be 6.3 µg∙g−1 and 6.7 µg∙g−1 respectively. According to Baker and Sneft [17], soil is usually deficient of copper, an indication that very little copper is bioavailable for plants and hence low levels of copper in food samples.
5. Conclusion
From the values obtained, finger millet was found to be an excellent source of manganese and iron. Beans have also been observed to be good sources of iron. Further, it is noted that levels of iron and zinc are relatively high in all the food crops. On the other hand maize is a poor source of manganese and all the food crops are very poor sources of copper.
6. Acknowledgements
The authors acknowledge the financial assistance provided by the University of Nairobi and the International Science Programme (ISP) of Sweden.
REFERENCES
- B. A. Underwood, “Perspectives from Micronutrient Malnutrition Elimination/Eradication Programmes. The Morbidity and Mortality Weekly Report (MMWR),” Centers for Disease Control and Prevention, Vol. 48, Suppl. 1, 1999, pp. 37-42.
- K. Weinberger, “The Impact of Micronutrients on Labor Productivity: Evidence from Rural India,” Proceedings of the 25th International Conference of Agricultural Economists (IAAE), 16-22 August 2003, Durban.
- I. Darnron-Hill, P. Webb, P. W. J. Harvey, J. M. Hunt, N. Dalmiya, M. Chopra, M. J. Ball, M. W. Bloem and B. de Benoist, “Micronutrient Deficiencies and Gender: Social and Economic Costs,” The American Journal of Clinical Nutrition, Vol. 81, No. 5, 2005, pp. 1198S-1205S.
- WHO, “The World Health Report,” Geneva, 2002.
- B. Maziya-Dixon, J. G. Kling, A. Menkir and A. Dixon, “Genetic Variation in Total Carotene, Iron, and Zinc Contents of Maize and Cassava Genotypes,” Food and Nutrition Bulletin, Vol. 21, No. 4, 2000, pp. 419-422.
- S. K. Vasal, “Quality Protein Maize Story. Improving Human Nutrition Through Agriculture: The Role of International Agriculture Research,” Proceedings of a Workshop Organized by the International National Food Policy Research Institute, 5-7 October 1999, Los Banos, pp. 771-778.
- S. Fairweather-Tait and R. F. Hurrell, “Bioavailability of Minerals and Trace Elements,” Nutrition Research Reviews, Vol. 9, 1996, pp. 295-324. doi:10.1079/NRR19960016
- S. Hemalatha, K. Platel and K. Srinivasan, “Zinc and Iron and Their Bioaccessibility in Cereals and Pulses Consumed in India,” Food Chemistry, Vol. 102, No.4, 2007, pp. 1328-1336. doi:10.1016/j.foodchem.2006.07.015
- C. O. Edeogu, C. E. Ekuwa, A. N. C. Okaka, F. C. Ezerou, C. J. Uneke and S. O. I. Ehom, “Public Health Significance of Metals Concentration in Soils, Water, Stable Foods in Abakaliki South Eastern Nigeria,” Trends and Applied Science Research, Vol. 2, No. 5, 2007, pp. 439- 444. doi:10.3923/tasr.2007.439.444
- R. W. Munene, “Characterization by Energy Dispersion X-Ray Fluorescence (EDXRF) Analysis of Interspecific Variation in Trace Element Micronutrient Density in Germplasm of Selected Indigenous Vegetables, Cereals and Fruits,” Master Thesis, University of Nairobi, Nairobi, 2005.
- J. K. Okoth, “Bioavailability of Iron and Zinc in Some Commonly Consumed Diets in Kenya,” Master’s Thesis, Jomo Kenyatta University of Agriculture and Technology, Kiambu County, 2005.
- P. R. S. Mamiro, J. Van Camp, S. M. Mwikya and A. Huyghebaert, “In Vitro Extractability of Ca, Fe, and Zn in Finger Millet and Kidney Beans during Processing,” Journal of Food Science, Vol. 66, No. 9, 2001, pp. 1271- 1275. doi:10.1111/j.1365-2621.2001.tb15200.x
- U. Anthony and T. S. Chondra, “Antinutrient Reduction and Enhancement in Protein, Starch and Mineral Availability in Fermented Flour of Finger Millet,” Journal of Agricultural and Food Chemistry, Vol. 46, No. 7, 1998, pp. 2578-2582. doi:10.1021/jf9706639
- B, Sandstrom, “Dietary Pattern and Zinc,” In: C. F. Mills, Ed., Zinc in Human Biology, Springer-Verlag, Berlin, 1989, pp. 350-363.
- A. P. Kabata and H. Pendias, “Trace Elements in Soils and Plants,” 2004.
- R. D. J. Sankara and Y, G. Deosthale “Mineral Composition, Ionisable Iron and Soluble Zinc in Malted Grain of Pearl Millet and Ragi,” Food Chemistry, Vol. 11, No. 3, 1983, pp. 217-223. doi:10.1016/0308-8146(83)90104-8
- D. E. Baker and J. P. Sneft Copper, “Heavy Metals in Soils,” 2nd Edition, Blackie Academic and Professional, Glasgow, 1995.