Communications and Network
Vol.5 No.2(2013), Article ID:31177,6 pages DOI:10.4236/cn.2013.52020
Soft Handover Probability Determination Considering New Direction of Motion
1Department of Electronics and Communication Engineering, Motilal Nehru National Institute of Technology, Allahabad, India
2Department of Electronics Engineering, Institute of Technology, Banaras Hindu University, Varanasi, India
Email: singhbasant@mnnit.ac.in, pathak.shashwat@gmail.com, amohan@bhu.ac.in
Copyright © 2013 Basant Kumar et al. This is an open access article distributed under the Creative Commons Attribution License, which permits unrestricted use, distribution, and reproduction in any medium, provided the original work is properly cited.
Received December 20, 2012; revised January 21, 2013; accepted February 21, 2013
Keywords: Handover Threshold; Soft Handover; Soft Handover Probability; WCDMA Networks
ABSTRACT
This paper presents prior determination of soft handover probability considering new direction of motion of mobile station (MS) coinciding with gravitation point of cells. Our simulation results for 3-cell scenario and considered new direction of MS motion can be potentially used as advance input to soft handover algorithms to minimize number of handovers.
1. Introduction
The hard handover algorithms used in earlier GSM networks [1] are fairly simple but they can not be used to support multimedia services due to high blocking probabilities. This motivated development of lower blocking probability soft handover algorithms [2,3] for CDMA/ WCDMA 3G mobile systems along with power control algorithm to eliminate near-far effect. However, growing demand for supporting higher multimedia data rate, streaming video, and Internet services on 3G networks has been demanding further minimization of soft handover and its failure. As the soft handovers become inevitable over cell boundaries of a cellular mobile network when a MS penetrates into the new cell (target cell) and number of handovers determines the quality of service (QoS) of the network, therefore minimizing number of soft handovers has been an important consideration in development of handover algorithms [4-9]. A good handover algorithm is expected to meet both the bounds—1) minimum number of handovers for maintaining QoS and 2) low probability of handover failures due to limited target cell resources. Minimizing number of soft handovers as well as their failure has been predominant QoS factor for 3G universal mobile telecommunication systems (UMTS) [4] which has been prime focus in development of soft handover algorithms. This becomes even more crucial in the case of smaller 3G cells due to requirement of increased frequency of handovers without failures. As a result there has been continued motivation for improving soft handover algorithms to meet the QoS requirements of modern 3G networks having relatively smaller cell size.
Different handover schemes [8,9] have already been proposed considering different directions of MS motion and network scenarios. However, determination of soft handover probability considering MS motion coinciding gravitation point of cells is comparatively little investigated. The soft handover probability and MS parameter settings have been mostly studied through simulation studies [10-15].
This paper describes determination of soft handover probability depending upon the direction of motion of MS in CDMA/WCDMA 3G networks considering constant speed linear motion of the MS. Our analysis is based on determining soft handover probability as function of soft handover threshold (Tadd ~ Tdrop) at a fixed value of drop timer (Tdt), where Tadd and Tdrop are add threshold and drop threshold respectively. The signal strength exceeding Tadd and its value less than Tdrop are used by MS to enter and delete a base station (BS) in the active set respectively. The results presented provide the prior estimation of soft handover probability which can be potentially used in adaptive soft handover algorithm development to achieve desired QoS.
Section II describes analysis of soft handover algorithms for WCDMA networks. Section III describes mathematical model to calculate the soft handover probability based on the distance between BS and MS and the direction of motion of MS from a reference point. Section IV presents simulation of two and three cell scenarios along with results indicating the effect of direction of MS motion on soft handover probability. Section V contains conclusions.
2. Analysis of Soft Handover
Soft handover are the CDMA specific handover types implemented in the UMTS networks and form important characteristic of the WCDMA access [5]. It occurs when a MS lies in the overlapping coverage area of two or more adjacent cells resulting more than one simultaneous connection to the access network using different air interface channels concurrently. Soft handover process consists of two main functions 1) acquiring and processing measurements and 2) executing the handover algorithm. The handover algorithm uses “set” (consisting list of all cells or Node B’s), “active set” (list of cells having a connection with the MS), and “monitored set” (list of neighbouring cells whose pilot signal  is continuously measured but not added to the active set; where
  and
and 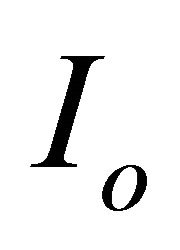 are signal strength and noise power respectively expressed in dB).
2.1. Measurements
The soft handover decisions are taken based on radio resource control (RRC) report which is obtained by accurate measurement of  of the common pilot channel (CPICH). This
  is determined from the measured value of the received signal code power (RSCP) and the received signal strength available from received signal strength indicator (RSSI). RSCP gives the power carried by the decoded pilot channel and RSSI provides the total wideband received power within the channel bandwidth. The
  is defined as:
 (1)
(1)
Typically a 200 ms window is chosen for filtering the handover measurement data to eliminate effect of fast fading for avoiding unnecessary handovers. A trade-off is made between number of allowed handovers and its delay because longer averaging duration increases handover delay. Further, minimizing the effect of fast fading through averaging becomes difficult.
2.2. Soft Handover Algorithm
The WCDMA handover algorithm differs slightly from IS 95A algorithm used for North American cellular system also based on CDMA. A good insight into the WCDMA handover algorithm can be obtained considering the network scenario example of the original 3GPP specifications [16]. In WCDMA handover algorithm the decision to add (“radio link addition”), remove (“radio link removal”) or replace (“combined radio link addition and removal”) a BS (called “node B”) in the active cell is taken on the basis of 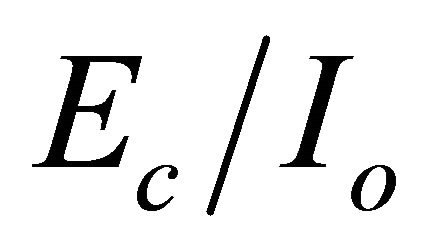 measurements of the set of cells monitored.
2.3. Channel Modeling
The signal strength between the BS and MS depends on three parameters i.e. path loss, shadow fading and the multipath component. The path loss between the BS and MS is given by Okumura-Hata model [17] at 900 MHz as below.
 (2)
(2)
where,  is carrier frequency (900 MHz), hb is height of the base station antenna, hm is height of the mobile antenna, d is the distance between BS and MS. The shadow fading occurs due to variations in the environmental conditions and the given by the Gaussian probability density function with zero mean and constant variance.
 (3)
(3)
where d0 is decay factor, v is velocity of the MS, and 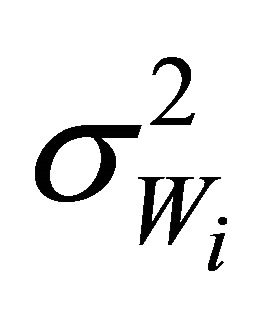 is the variance. The mutlipath fading is due to the multiple paths that exist between BS and MS because of reflections from tall buildings and trees which can be eliminated by averaging function given below.
 (4)
(4)
where dav is averaging distance. Therefore the signal strength between the BS and Ms can be calculated considering different number of BSs and using Equations (2)-(4).
3. Soft Handover Probability
3.1. Soft Handover Probabilities
Optimization of soft handover is essential to achieve higher QoS by minimizing call handling overheads of the network which greatly depends upon soft handover probability of a user. The user’s soft handover probability in a network scenario is mainly governed by soft handover threshold and the distance of moving MS from BSs in the active set at any given time; and thus the speed of MS. Therefore this section presents analysis of the effect of these parameters through MATLAB simulations of the geometrical network model and computing signal strength values using Equations (2)-(4). Although our analysis method for determining the effect of soft handover probability on the handover is applicable to any 3G network scenario but this paper presents the results considering 200 ms time window, 150 meters height of BS and 10 meters height of MS for two and three cell scenarios of Figure 1 as an illustrative example.
Considering users moving at constant speeds, the ratio of time they are in soft handover to the total time they are moving in the system gives a good measure of soft handover probability.
The soft handover threshold  is used by WCDMA soft handover algorithm and it is commonly referred as soft handover margin indicating the maximum difference between the two pilot channel signal strengths that can be accommodated in the active set of a MS. Therefore an increase in this value for a given call shall add more BSs into the active set of a MS. Therefore minimizing soft handover probability requires optimization of soft handover margin which necessitates analysing the effect of threshold and the distance between a moving MS and different BSs in the active set.
3.2. Soft Handover Probability Determination
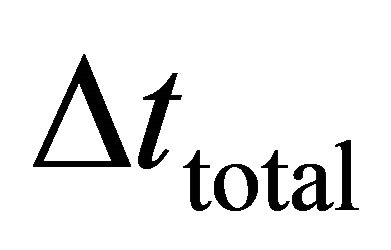
The soft hand over probability can be calculated either by computing the ratio of the users in soft handover to the total number of users in a cell or finding the ratios between the time a user is in soft handover to the total time for which the user communicates. Considering that the user is moving with constant speed the soft handover probability  can be expressed by Equation (5) below.
 (5)
(5)
where  and
and  are the soft handover time and distance travelled by the user during soft handover and
  and
and  are the total call time and distance covered by the user during call at speed ν.
Considering scenario in Figure 2(a) as an illustrative example the soft handover probability can be computed using Equation (6).
 (6)
(6)
where W is the soft handover window and 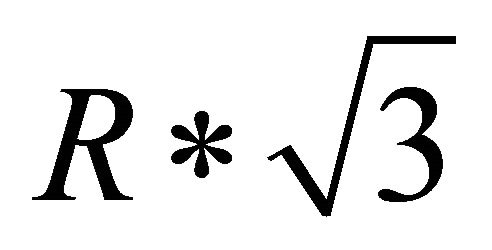 is the distance between the two base stations considering cell size with radius
 .
.
3.3. Calculation of the Soft Handover Window
Figure 2(b) shows the simulation results indicating variation in received signal strength at the MS from three different BSs during motion of MS shown in Figure 2(a) where BS1 and BS3 are placed at 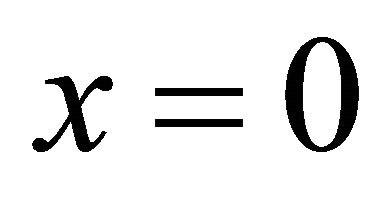 and
and  respectively. The signal strengths received at MS from BS1 and BS3 can be expressed by Equations (7) and (8) respectively.
 (7)
(7)
 (8)
(8)
where  and
and  are the received power at MS and BS transmitted power respectively and
 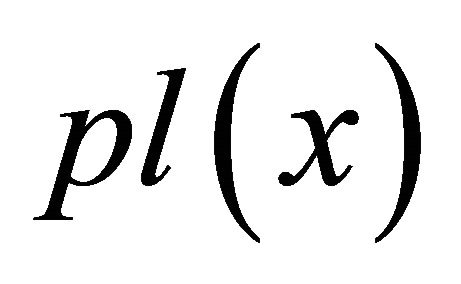 represents the channel path loss.
The variation in BS1 transmitted power with distance 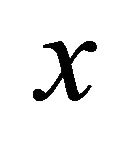 when it is placed at
 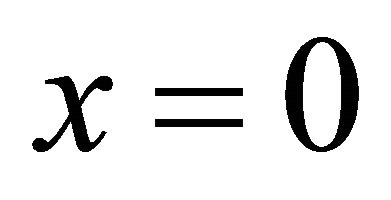 can be expressed by Equation (9).
 (9)
(9)
where Po is the signal power at 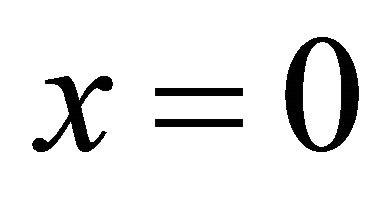 and path loss as function of
  i.e.
i.e.  is given by the ITU vehicular path loss model [18]. Now the ratio between the soft handover threshold and soft handover window i.e.
 at
at 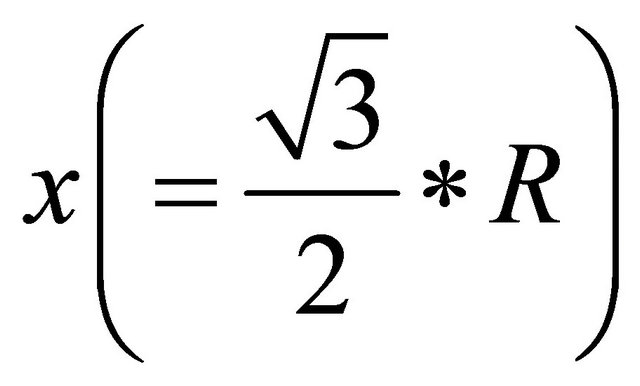 near the cell edge of
 (a)
(a) (b)
(b) (c)
(c)
Figure 1. Soft handover probability calculation for the above three scenarios.
 (a)
(a) (b)
(b)
Figure 2. (a) MS movement for fixed BSs for analysis of WCDMA algorithm; (b) Soft handover probability calculation.
BS1 and BS2 can be obtained by differentiating Equation (9) and using linear approximation as in Equation (10).
 (10)
(10)
where A is a constant. Therefore soft handover probability can be expressed in terms of soft handover threshold by substituting the value of  from Equation (10) into Equation (6) as given by Equation (11).
 (11)
(11)
The signal strength between the BS and MS considering BS1, BS2, and BS3 can be calculated for fixed values of add threshold (Tadd), drop threshold (Tdrop), handover margin, and drop timer (Tdt) by eliminating multipath fading through averaging and taking into account the path loss and shadow fading effects. Now as MS moves further away from BS1 toward BS3 it perceives an increase in signal strength from BS3 and decreased signal strength from BS1. At a certain distance x at time t when the received signal power by MS due to BS3 reaches Tadd, the mobile requests a connection with BS3. If this request is accepted then the mobile goes into a soft handover mode and communicates with both base stations BS1 and BS3. If the MS moves further away from BS1, it stops the connection to BS1 when received signal power from BS1 drops below Tdrop. This soft handover probability can be computed for the network scenario in Figure 2(b) by using Equation (11).
4. Network Simulation & Results
Our present study is based on MATLAB simulation of the network scenarios shown in Figures 1(a)-(c) and assuming constant speed of MS as illustrated in Figure 2(a). Figure 3 shows the variation in the received signal strength at the MS for scenario in Figure 1(a) where a MS moves in a straight line from the cell vertex towards the opposite vertex and continues along the edge of the two neighbouring cells. In this case the received power initially increases when MS moves closer towards BS1 and later decreases when it moves away from the BS1. Subsequently, the MS has two identical simultaneous connections while moving along the cell edge between BS2 and BS3 because of its symmetric position. When MS reaches the gravitation point of the triangle formed by the three base stations, the MS has three simultaneous connections. This increases the handover probability due to active set size becoming three for some time depending on the value of soft handover threshold and the distance to the gravitation point.
Variation of signal strength with distance for all the three scenarios is shown in Figures 4-5 using Eqations (7)-(9).The soft handover probabilities have been determined Equation (11) and its variation as function of soft handover threshold (Tadd ~ Tdrop) is shown in Figures 6-8. Variation in soft handover probability as function of soft handover threshold for scenario in Figure 1(a) is shown in Figure 6 from which it is seen that the soft handover probability increases linearly with nearly constant slope for soft handover threshold ≤ 8 dB. However, when the soft handover threshold is > 8 dB, there is sharper rise in the soft handover probability. Scenario in Figure 1(b) shows the MS movement along the line join-

Figure 3. Signal strength variation for scenario 1(a).
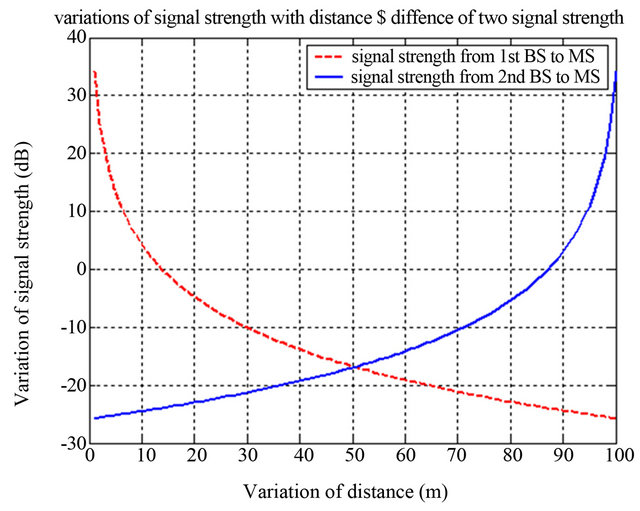
Figure 4. Signal strength variation for scenario 1(b).

Figure 5. Signal strength variation for scenario 1(c).
ing the two cell centres and the variation in the signal strength received by MS is shown in Figure 4 assuming that MS moves from BS1 to BS2. Figure 7 shows the variation in soft handover probability as function of soft handover threshold. It is evident from Figure 7 that soft handover probability is linearly dependent on the soft handover threshold up to 12 dB. Figure 1(c) is three-cell scenario with the trajectory coinciding with three cell points, path of MS coincides with the gravitation point of the imaginary triangle formed by the three BSs, and makes a right angle with the cell edges. Figure 5 shows the variation in the received signal by the MS which increases as MS comes near to BS2 and BS3. In this case the MS has three simultaneous connections at the gravitational point of the triangle and thus enters into soft handover mode. Figure 8 shows the variation in the handover probability as function of the soft handover threshold from which it is observed that although the soft handover probability is linearly dependent on soft handover threshold but it has five slope sectors.
Comparing the simulation results in Figures 6-8 it is clear that scenario in Figure 1(c) requires more frequent and adaptive selection of soft handover thresholds (Tadd ~ Tdrop) to achieve a required soft handover probability as compared to scenarios in Figures 1(a) and (c). The simulation results can be used for determination of num-

Figure 6. Soft handover probability vs soft handover threshold for scenario 1(a).

Figure 7. Soft handover probability vs soft handover threshold for scenario (b).

Figure 8. Soft handover probability vs soft handover threshold for scenario 1(c).
ber of handovers, handover initiation points, and the limit of the active set size for different values of (Tadd ~ Tdrop) for different network scenarios.
5. Conclusions
This paper presents determination of soft handover probabilities as function of soft handover threshold (Tadd ~ Tdrop) for different network scenarios and considering constant speed motion of MS. The simulation results can be potentially useful to determine the range of soft handover threshold for achieving a guaranteed QoS for a given network scenario.
The usefulness of this paper can be extended to the practical cases where variable speed for motion is considered. A slight modification by introducing an algorithm for the estimation of average speed from samples, during period of observation. A more realistic scenario can be generated by considering obstacles in the channel and their contribution to fading and multipath reflections.
REFERENCES
- N. D. Tripathi, J. H. Reed and H. F. VanLandinoham, “Handover in Cellular Systems,” IEEE Personal Communications, Vol. 5, No. 6, 1998, pp. 26-37. doi:10.1109/98.736475
- N. Zhang and J. M. Holtzman, “Analysis of CDMA Soft Handover Algorithm,” Proceedings of Personal, Indoor and Mobile Radio Communications, Toronto, 27-29 September 1995, pp. 819-823.
- A.E.Leu, B.L.Mark, “Discrete Time Analysis of Soft Handoff in CDMA Cellular Networks,” IEEE Transactions on Communications, 2002, pp. 3222-3227.
- Zhang and J. M. Holtzman, “Analysis of CDMA Soft Handoff Algorithm,” IEEE Transactions on Vehicular Technology, Vol. 47, No. 32, 1998, pp. 710-714. doi:10.1109/25.669108
- J. Shapira, “Microcell Engineering in CDMA Cellular Networks,” IEEE Transactions on Vehicular Technology, Vol. 43, No. 4, 1994, pp. 817-825.
- S. Chia and R. J. Warburton, “Handover Criteria for City Microcellular Radio Systems,” IEEE Proceedings of Ve- - hicular Technology Conference, May 1990, pp. 276-281.
- G. P. Pollini, “Trends in Handover Design,” IEEE Communications Magazine, Vol. 34, No. 3, 1996, pp. 82-90. doi:10.1109/35.486807
- 3GPP TS 23.009, Handover Procedures.
- P. Marichamy, S. Chakrabarti and S. L. Maskara, “Overview of Handover Schemes in Cellular Mobile Networks and Their Comparative Performance Evaluation,” IEEE Proceedings of Vehicular Technology Conference, Vol. 3, 1999, pp. 1486-1490.
- P. Seite, “Soft Handoff in a DS-CDMA Cellular Network,” IEEE Proceedings of Vehicular Technology Conference, Stockholm, June 1994, pp. 530-534.
- S. W. Wang and I. Wang, “Effects of Soft Handoff, Frequency Reuse and Non Ideal Antenna Sectorization on CDMA System Capacity,” IEEE Proceedings of Vehicular Technology Conference, Vol. 1, 1993, pp. 850-854.
- S. J. Hong and I.-T. Lu, “Effect of Various Threshold Settings on Soft Handoff Performance in Various Propagation Environments,” IEEE Proceedings of Vehicular Technology Conference, 2000, pp. 2945-2949.
- S. J. Hong and I.-T. Lu, “Soft Handoff Parameter Optimization in Various Propagation Environments,” IEEE Proceedings of Vehicular Technology Conference, Vol. 4, 2001, pp. 2549-2553.
- B. Homnan, V. Kunsriruksakul and W. Benjapolakul, “A Comparative Evaluation of Soft Handoff between IS-95A and IS-95B/cdma2000,” IEEE Proceedings of Vehicular Technology Conference Fall, Vol. 1, 2000, pp. 34-37.
- O. E. Kelly and V. V. Veeravalli, “A Locally Optimum Handoff Algorithm,” IEEE Proceedings of Personal, Indoor and Mobile Radio Communications, Toronto, 27-29 September 1995, pp. 809-813.
- 3rd Generation Partnership Project, Technical Specification Group RAN, Working Group 2 (TSG RAN WG2), “Radio Resource Management Strategies,” 3G TR 25.922, V2.0.0, December 1999.
- A. Medeisis and A. Kajackas, “On the Use of the Universal Okumura-Hata Propagation Predication Model in Rural Areas,” Vehicular Technology Conference Proceedings, Vol. 3, 2000, pp. 1815-1818.
- Recommendation ITU-R M.1225, “Guidelines for Evaluation of Radio Transmission Technologies for IMT-2000,” 1997.

