World Journal of Condensed Matter Physics
Vol.3 No.1(2013), Article ID:28322,8 pages DOI:10.4236/wjcmp.2013.31010
Determination of Phase Transitions of p,n-Alkyloxy Benzoic Acid Mesogens Using Legendre Moments and Image Analysis
![]()
1Department of Physics, Acharya Nagarjuna University, Nagarjuna Nagar, India; 2Department of Electronics and Communcation Engineering, K. L. University, Greenfields, Vaddeswaram, India; 3Department of Chemical Science, Faculty of Science, UniversitiTunku Abdul Rahman, Jalan Universiti, Bandar Barat, Kampar, Malaysia.
Email: *sreeharisastry@yahoo.com, cnrao.physics@gmail.com, mallika.k@dcemail.com, drslakshminarayana@gmail.com, hast_utar@yahoo.com
Received October 7th, 2012; revised November 23rd, 2012; accepted December 8th, 2012
Keywords: Alkyloxybenzoic Acids; Homeotropic Alignment; Phase Transitions; Textures; Legendre Moments; Image Analysis
ABSTRACT
Phase transition temperatures of p,n-alkyloxy benzoic acids (nOBA, n = 3 to 10 and 12) are investigated basing on the textural image analysis of liquid crystal. The analysis is carried out by the computation of Legendre moments. Textures of the homeotropically aligned compounds are recorded as a function of temperature using POM in arthroscopic mode attached to the hot stage and high resolution camera. A recurrence formula is used to compute the liquid crystal textures based on Legendre polynomial. The discontinuities and fluctuations in the values of Legendre moments as a function of temperature are related to the phase transition temperatures of the sample. This method is successful in conforming or detecting the phase transition temperatures and the present findings are comparable with literature.
1. Introduction
Research and development on liquid crystals has been growing steadily in last decades resulting better and cheaper displays by discovering new types of liquid crystals [1]. Liquid crystals exhibit the rich variety of phase structures and phase transitions in the materials. The structure of liquid crystal phases is easily influenced by external conditions e.g., temperature, pressure, electric field, magnetic field, etc. [2,3]. For the planar alignment of liquid crystals, the phases possess complex structures and properties which are studied from several decades. Recently, homeotropic alignment of liquid crystals has got worldwide applications in liquid crystal displays such as high information display devices, LCD TV’s and digital display devices in medical field like medical imaging. Still, the investigations for the properties of homeotropically aligned liquid crystals components are at a nascent stage, especially when the more complex and different phase types are considered. However, the basic study of any liquid crystal compound involves the identification of phase transition temperatures. There are several techniques to identify the mesophases or phase transitions of liquid crystals, such as Polarizing Optical Microscope (POM), Differential Scanning Calorimetry (DSC), Differential Thermal Analysis (DTA), X-ray Diffraction (X-RD), Raman Spectroscopy etc. [4,5]. The most widely used techniques in identification of phase transition temperatures is POM. DSC and DTA inform the presence of phase transitions in a material by detecting enthalpy and entropy changes that are associated with each phase transition. However, precise phase identification could not easily be made. The phase transitions causing small enthalpy and entropy changes are not identified in the procedures of DSC and DTA. Hence, DSC or DTA is used in conjunction with POM to determine the phase transitions temperatures of the samples as POM is a standard tool in identification of liquid crystals phases. In 1998, firstly some researchers proposed an image processing and analysis methodology in conjunction with POM to investigate the phase transitions of liquid crystals [6,7].
The optical intensities are very sensitive both in spatial and frequency domains for an image of any object or material. The material exhibits the apparent variations in radiated intensities when they undergo phase transitions either in the form and shape/orientation and even at the slightest transition occurs in the material form due to the reorientation of the atomic/molecular adjustments. The sensitive variations in the textural or transitional phases of the material in response to the temperature changes are measured or recorded using POM attached to the high resolution camera. The analysis of the recorded textural images basing on the radiation intensities in three primary spectral bands red, green and blue at the matrix of pixels has been used to identify the phase transition temperatures of the liquid crystals. Image analysis is the method used to extract the meaningful information from images by means of applying computational techniques and algorithms on image data. The computations of statistics and measurements in the image analysis method are done on considering the gray level intensities of image pixels. The statistical methods will analyze the spatial distribution of gray levels by computing the local and global features at each intensity value in the image and derive a set of statistical parameters from the distribution of these features [8,9]. A few researchers used the statistical parameters derived from the local features to identify the phase transitions temperatures of liquid crystals [10,11]. Recently, a novel approach [12] of statistical measure called image moment which is derived from the global features of the liquid crystal textures is applied to identify the phase transitions temperatures.
Image moments are weighted average intensities of the images and are calculated from the computational analysis of images. These will give meaningful information about image objects [13]. Generally in liquid crystal field, the orientation distribution function is expressed in terms of Legendre polynomial and the coefficients will represent the order parameter of the samples
2. Theory
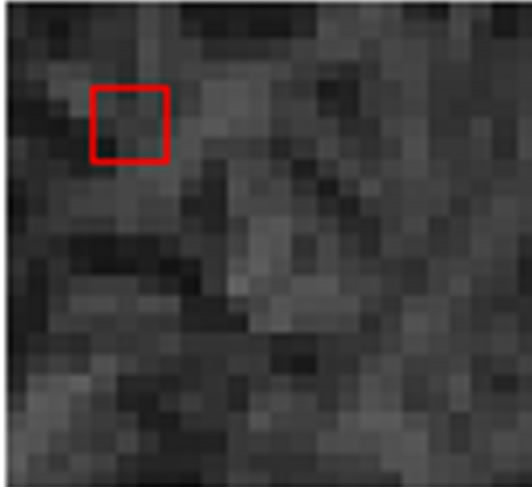
In general, the image of an object is represented in the form of matrix and the elements of the matrix represent the intensity values at the respective positions of the object.
Ex:
|
|
| |||||||||
| Panchromatic image (Grey scale) | Elements of matrix represent the intensities of radiation in marked area. |
Here, Legendre moments of the textures are obtained by mapping the image intensity values on Legendre polynomial. A recurrence formula is used to compute the Legendre moments of the Liquid crystal textures based on Legendre polynomial using MATLAB software [15].
Legendre Moments
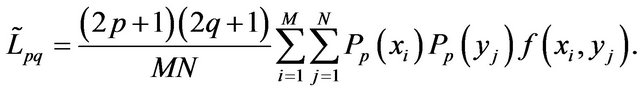
The Legendre moments are obtained by projecting an image f(x, y) on a 2D Legendre polynomial basis. Legendre moments of order (p + q) for an image with intensity function f(x, y) are defined as [13,16,17].
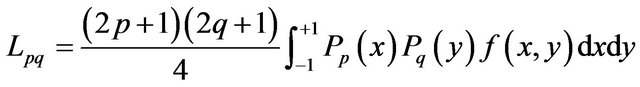 (1)
(1)
where 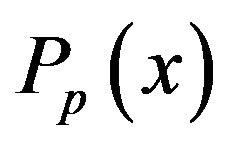 is the pth order Legendre polynomial and defined as
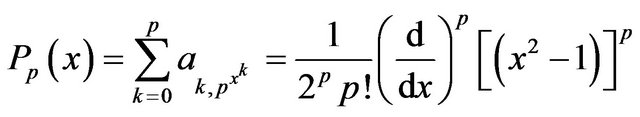 (2)
(2)
where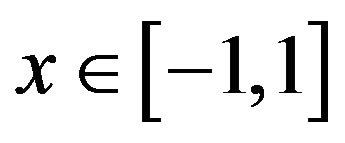 , and the Legendre polynomial
  obeys the following recursive relation
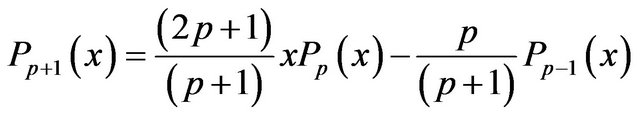 (3)
(3)
With 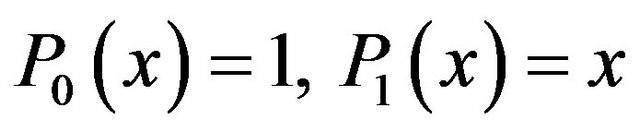 and p > 1. The set of Legendre polynomials
  forms a complete orthogonal basis set on the interval
 . The orthogonal property is defined as
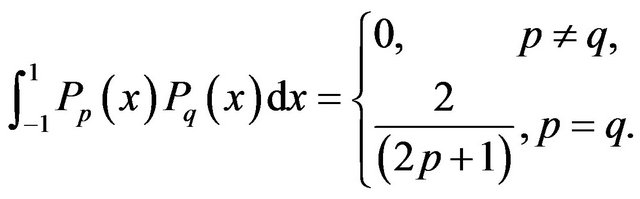 (4)
(4)
An image of size M × N is an array of pixels. Centers of these pixels are the points (xi, yj), where the image intensity function is defined only for this discrete set of points .
.
 are sampling intervals in the x-direction and y-directions respectively. In the literature of digital image processing the intervals
  and
and  are fixed at constant values
 , and
, and , respectively. Therefore, the points (xi, yj) will be defined as follows
 (5)
(5)
 (6)
(6)
with  and
and . for the discrete space version of the image, Equation (1) is usually approximated by
 (7)
(7)
This Equation (7) is called direct method for Legendre moments computations.
3. Materials and Method
Thermotropic liquid crystals of homologous series p,nalkyloxybenzoic acids (nOBA where n = 3 to 10 and 12) are obtained from M/s Frinton laboratories, Inc., USA. Homeotropic alignment (90˚ alignment) of Indium Tin Oxide coated cells having area of 5 mm × 5 mm with 6 mm spacing (tolerance is ± 0.2 µm) are obtained from M/s Instec Inc., USA. Temperature dependent textural investigations are carried out by Meopta polarizing optical microscope attached to hot stage as described by Gray [18] and the high resolution Canon camera. p,nalkyloxybenzoic acid mesogens are injected in the liquid crystal cells by heating the sample in its isotropic state through capillary action. The flowing direction of the liquid crystal during cell filling is found to influence the molecular alignment in the resultant liquid crystal layer. Better alignment of liquid crystal layer with few defects can be produced when the liquid crystal is allowed to flow into the cell toward the direction in which the surface is aligned.
A high resolution Canon colour digital camera is used for recording the observations. The colour image recorded by the camera has a resolution of 1936 × 1288 pixels which representing a total of 24 bit true coloured tones which are ranging from 0 to 255 in individual R, G, and B spectral images. In the present work, the translated gray scale image is used for analysis. The program has been coded using MATLAB software (implemented on P4 1.6 GHz with 2 GB RAM) for computational analysis of textures which is an efficient tool for calculating the Legendre moments [19].
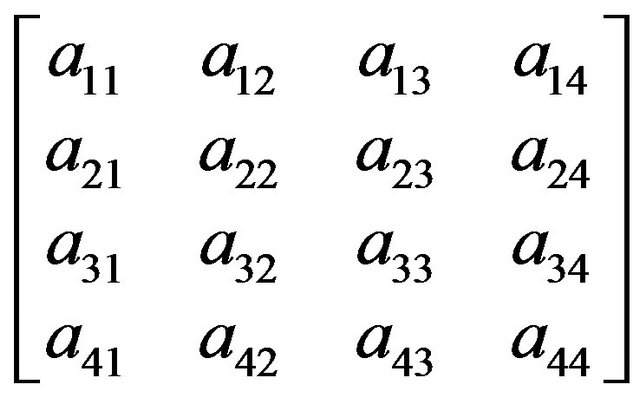
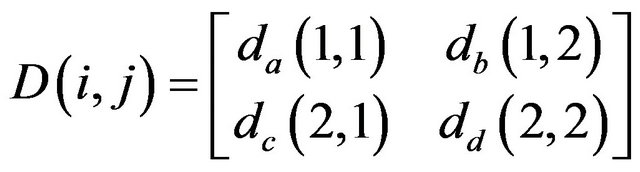
Textures of the thermotropic liquid crystals for homologous series of alkyloxybenzoic acids are recorded using POM in arthroscopic mode attached by the hot stage and camera. The textures are recorded from the solid phase of the sample to the isotropic liquid phase, as a function of temperature. The images of textures of the samples are stored in computer for further processing. MATLAB (implemented on P4 1.6 GHz with 2 GB RAM computer) is used to read and translate the image into gray scale version, and to compute the Legendre moments. Initially the Legendre polynomial basis is generated according to Equation (2). Then, the Legendre moments are computed using recursive relation given in Equations (3)-(6). The Legendre moments of the image are obtained in the form of square matrix of size ((maximum polynomial order or moment order) + 1). i.e., for polynomial or moment of order 3, the matrix of size 4 × 4, and shown [20] below.
At each temperature recording of the liquid crystal sample, there is one Legendre moment matrix and for different temperature recordings there are different Legendre moment matrices. For drawing a plot, the moment values derived from all these matrices at the same coordinate position and its corresponding temperatures are considered. This is explained in the following way and the total procedure presented in a flow chart given in Figure 1.
Let B, C, D,∙∙∙, be the Legendre moment matrices of (2 × 2) dimensions of sample textures recorded at temperatures 30˚C, 40˚C, 50˚C,∙∙∙.
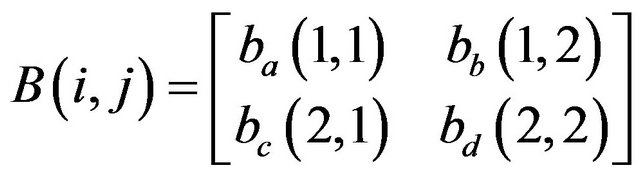 at 30˚C,
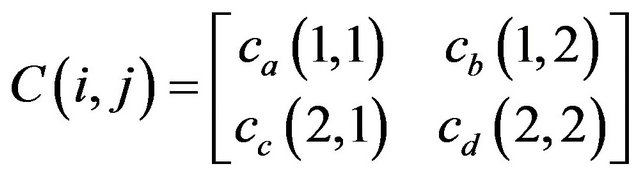 at 40˚C and
 at 50˚C,∙∙∙.
where (i, j) is the co-ordinate position of Legendre moment matrix and i = 1, 2; j = 1, 2.
The plot is drawn for moment values , at the co-ordinate position (1,1) as a function of temperature 30˚C, 40˚C, 50˚C,∙∙∙ Similarly the plots are drawn for remaining co-ordinate positions (1,2), (2,1), (2,2). The number of Legendre moment plots to be derived is dependent in accordance with dimensions (size) of Legendre moment matrix. In the given example, the Legendre moment matrix dimension is 2 and there are four coordinate positions {(1,1), (1,2), (2,1), (2,2)} resulting in four ((dimensions)2: 22 = 4) Legendre moment plots.
4. Results and Discussion
In a similar way, the plots are drawn for moment values
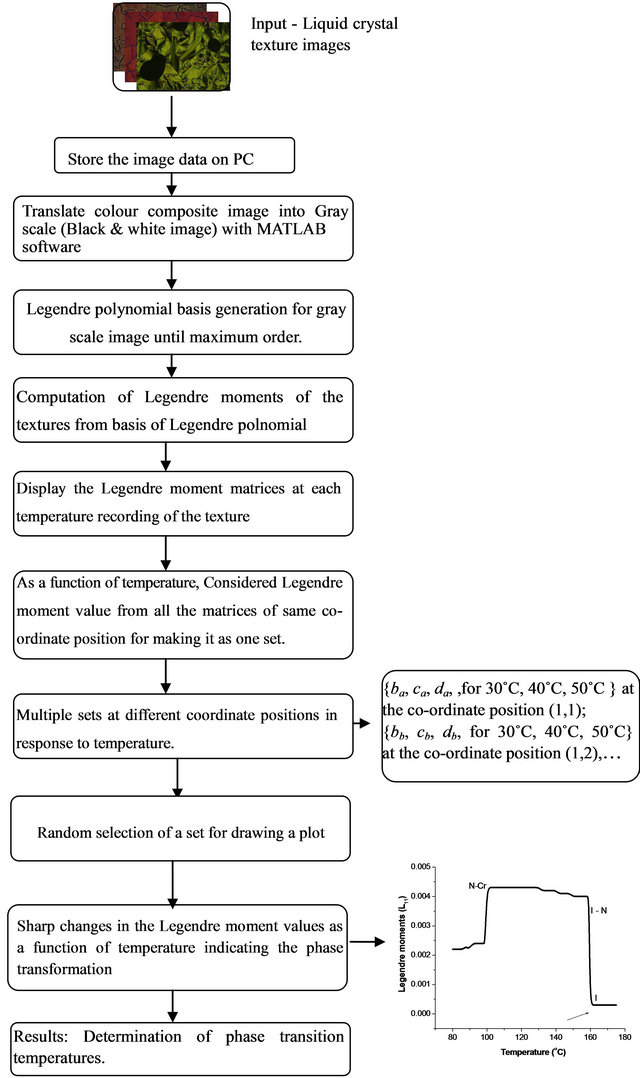
Figure 1. Flow chart showing the procedure for determination of transition temperatures.
of the thermotropic liquid crystal textures as a function of temperature. The plots can draw for all co-ordinate positions of the Legendre moment matrix of liquid crystal textures. In all plots, the behavior of the Legendre moment curves is similar for the same sample and different for different compounds. In this work maximum moment of order 3 is used. However, any order of the moment yields similar results. To draw a plot, any co-ordinate position is to be selected since each co-ordinate position would yield a single plot. Hence, in the present work, co-ordinate position (1,1) is selected as a representative case to draw a plot. The plots are drawn for both heating and cooling cycles, as a representative case only cooling cycle plots are shown here to avoid the paramorphotic defects. They are shown in Figures 2-10.
The plots shown in Figures 2-10 has indicated there are abrupt changes at certain temperatures in the Legendre moment curves, indicating the consequential changes in textural features of the samples corresponding to the phase transformation of sample. Therefore, the temperature corresponding to abrupt changes in the curve
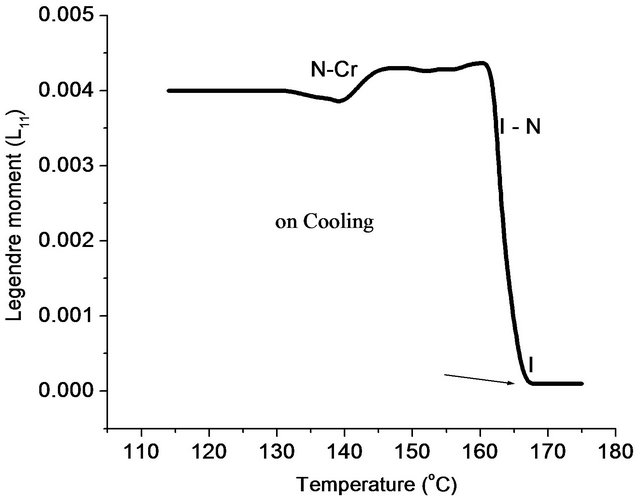
Figure 2. Temperature dependence of Legendre moments for nOBA where n = 3.
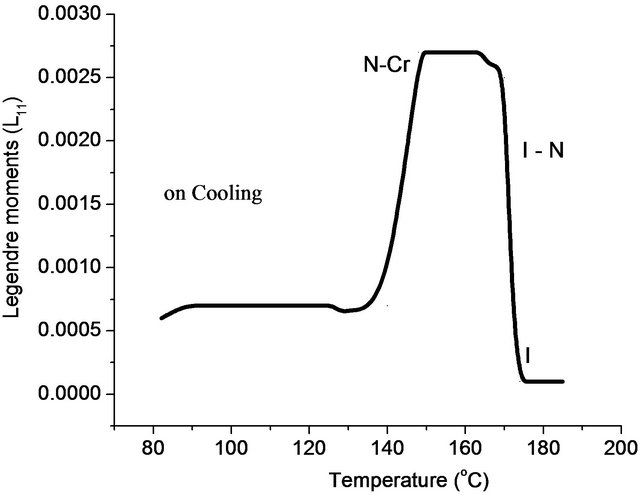
Figure 3. Temperature dependence of Legendre moments for nOBA where n = 4.
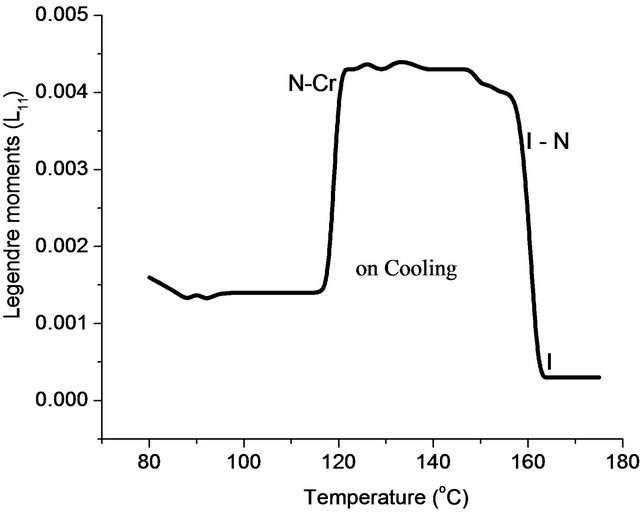
Figure 4. Temperature dependence of Legendre Moments for nOBA where n = 5.
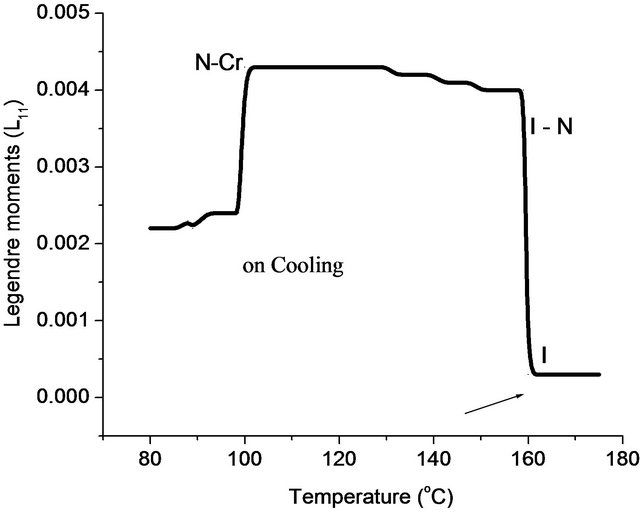
Figure 5. Temperature dependence of Legendre moments for nOBA where n = 6.
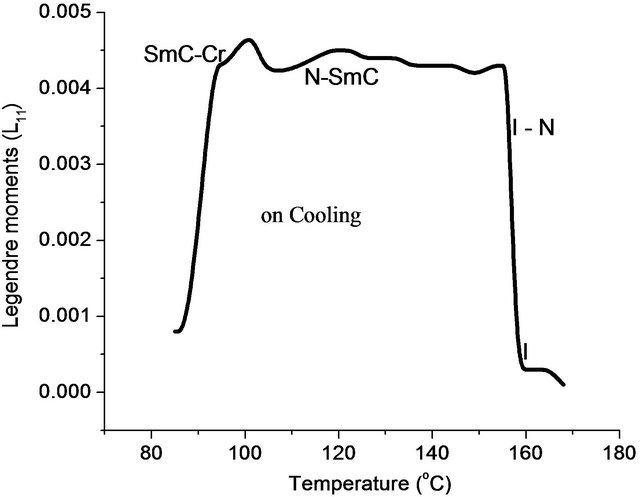
Figure 6. Temperature dependence of Legendre moments for nOBA where n = 7.
is representing the transition temperature of sample. This confirms that the present methodology is useful in investigations for the phase transitions of liquid crystals.
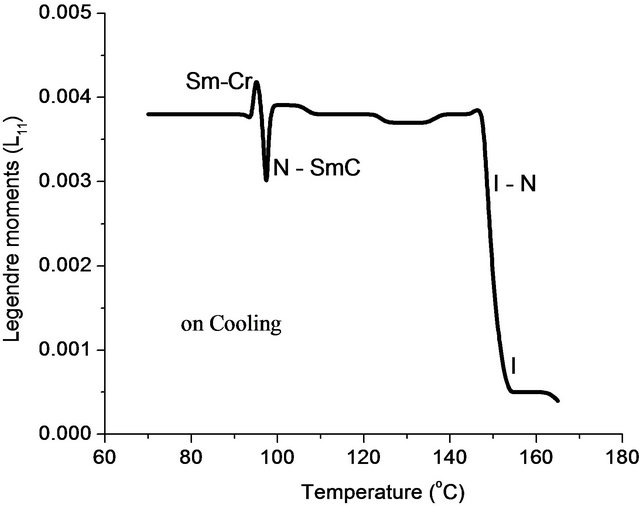
Figure 7. Temperature dependence of Legendre moments for nOBA where n = 8.
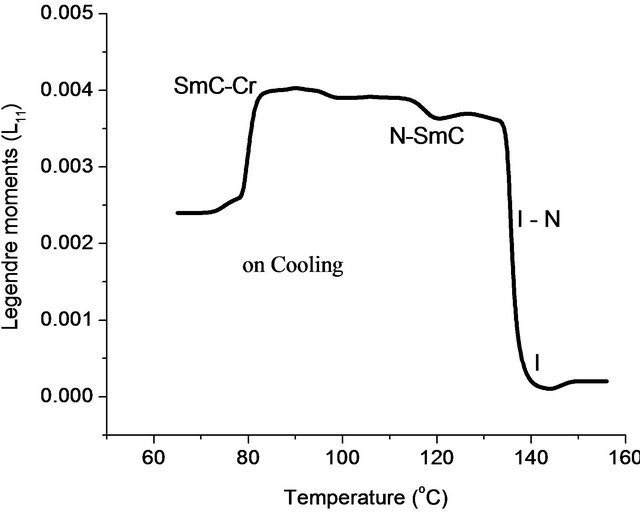
Figure 8. Temperature dependence of Legendre moments for nOBA where n = 9.
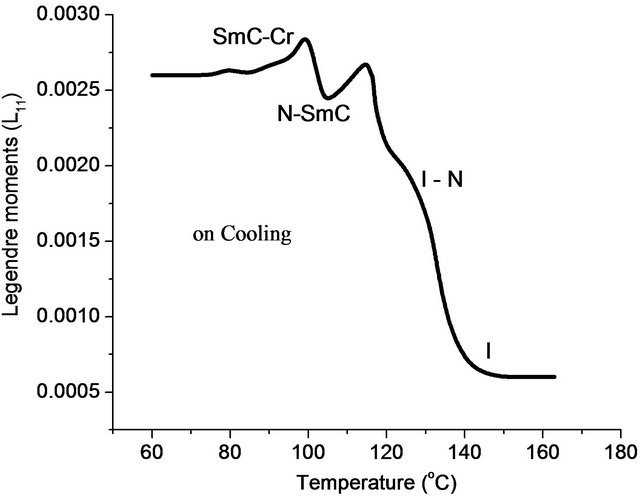
Figure 9. Temperature dependence of Legendre moments for nOBA where n = 10.
The compounds of nOBA where n = 3 to 6 have exhibited the nematic mesophase in the temperature ranges of 95˚C - 175˚C. In the case of homogeneous alignment
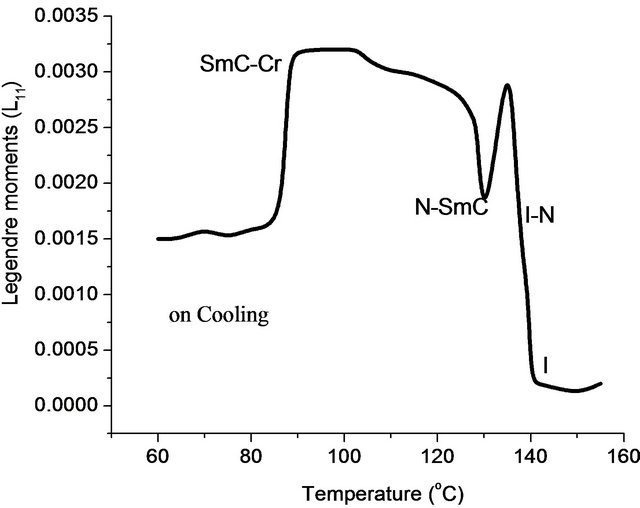
Figure 10. Temperature dependence of Legendre moments for nOBA where n = 12.
the temperatures are in between 105˚C - 160˚C. Compounds of nOBA where n = 7 to 10 and 12 have shown both nematic and smectic C phases in the interval of temperature 80˚C - 160˚C, where for smectic C mesophase the range is high when compared to nematic phase. In the case of homogeneous alignment the recorded temperatures are in between 90˚C - 150˚C. This indicating the rate of crystallization or the rate of isotropic phase from the liquid crystal phase that are influenced by anchoring effect in the homeotropic alignment of liquid crystal samples. The measured values of transition temperatures have ±2˚C difference is noticed when compared with the literature data [21] as shown in Table 1.
The difference is high for the samples that are exhibitting only nematic phase than the samples showing both nematic and smectic C phases. Here the samples showing only nematic phase have the asymmetric arrangement of the molecules containing only orientational order in spite of anchoring or alignment is imposed. The asymmetric orientational order (like isotropic liquid) of nematic phases for the homologues series of n = 3 to 6 (lower carbon chain length) do not have sufficient flexibility for thermal stability of the samples and unambiguously storing thermal energy over the entire liquid crystal cell. The homologues series n = 7 to 10 and 12 which contain larger alkyloxy chain have shown smectic C mesomorphism with broader mesomorphic range. The chain length is influencing the stabilization of the mesophases. The homologue with a larger alkyloxy chain (12 carbon atoms) is the unique derivative which displays Smectic C phase with an extra broad range mesomorphic behaviour of 20˚C relative to the same compound in planar alignment. Perhaps, the length of the terminal chain might increase of the complex flexibility which in turn influences the interactions are an influence on mesophase arrangement to favour the formation of smectic phase [22].
Table 1. Textures and Phase transition temperatures of homeotropically aligned p,n-alkyloxybenzoic acid (nOBA) mesogens.
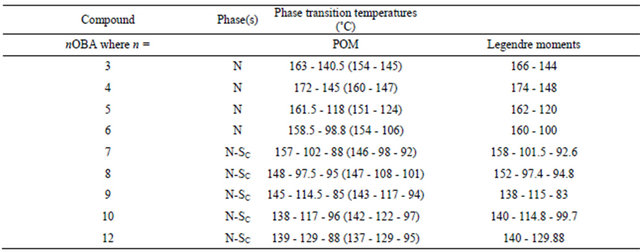
*The bracket () is the literature work done in planar alignment by Robert Pavlis [21]. (SmC-SmecticC, N-Nematic).
5. Conclusion
The radiated intensities from the optical textures of samples exhibit apparent variations as a function of temperature. Therefore immense useful information extracted from textures would deal with the phases and transition temperatures of liquid crystals by applying the image analysis technique and it is proved as a sophisticated and efficient method. The Legendre moments i.e., the polynomial statistical measure of the optical texture used to determine the phase transitions in response to temperature has in fact considered the radiation intensities (gray level) recorded in the three spectral bands at respective pixels. The scale range applied for Legendre moments while drawing the plots is a testimony for showing the high precision variations in the data. Thermo dynamical parameters which are the properties used in DSC, DTA to measure the phase transitions of the samples are not sensitive like parameters measured from optical intensities.
6. Acknowledgements
The authors gratefully acknowledge UGC DRS LEVEL III program No.F.530/1/DRS/2009 (SAP-I), dated 09-02- 2009 and DST FIST program No DST/FST/ PSI-002/ 2011dated 20-12-2011, New Delhi, to the department of Physics, ANU for providing financial assistance.
REFERENCES
- N. V. Madhusudana, “Recent Advances in Thermotropic Liquid Crystals”, Current Science, Vol. 80, No. 8, 2001, pp. 1018-1025.
- S. Chandrasekhar, “Liquid Crystals,” Cambridge University Press, Cambridge, 1992. doi:10.1017/CBO9780511622496
- P. G. de Gennes and J. Prost, “The Physics of Liquid Crystals,” Clarendon Press, Oxford, 1993.
- S. Singh, “Liquid Crystals Fundamentals,” World Scientific, Singapore, 2002.
- D. Demus and L. Richter, “Textures of Liquid Crystals,” Verlag Chemie, New York, 1978.
- B. Montrucchio, A. Sparavigna and A. Strigazzi, “A New Image Processing Method for Enhancing the Detection Sensitivity of Smooth Transitions in Liquid Crystals,” Liquid Crystal, Vol. 24, No. 6, 1998, pp. 841-852. doi:10.1080/026782998206669
- B. Montrucchio, A. Sparavigna, S. I. Torgova and A. Strigazzi, “A Novel Order Transition inside the Nematic Phase of Trans-4-Hexylcyclohexane-1-Carboxylic Acid Discovered by Image Processing,” Liquid Crystal, Vol. 25, No. 5, 1998, pp. 613-620. doi:10.1080/026782998205903
- F. Albregtsen, “Statistical Texture Measures Computed from Gray Level Coocurrence Matrices,” Image Processing Laboratory, Department of Informatics, University of Oslo, Oslo, 2008.
- A. Rosenfeld, “Image Analysis and Computer Vision 1988,” Computer Vision, Graphics and Image Processing, Vol. 46, No. 2, 1989, pp. 196-250.
- A. Sparavigna, A. Mello and B. Montrucchio, “Texture Transitions in the Liquid Crystalline Alkyloxybenzoic Acid 6OBAC,” Phase Transitions, Vol. 79, No. 4-5, 2006, pp. 293-303. doi:10.1080/01411590600748132
- J. Eccher, A. R. Sampaio, R. C. Viscovin, G. Conte, E. Westphal, H. Gallardo and I. H. Bechtold, “Image Processing as a Tool for Phase Transitions Identification,” Journal of Molecular Liquids, Vol. 153, No. 2-3, 2010, pp. 162-166. doi:10.1016/j.molliq.2010.02.010
- S. S. Sastry, K. Mallika, B. G. S. Rao, S. T. Ha and S. Lakshminarayana, “Novel Approach to Study Liquid Crystal Phase Transitions Using Legendre Moments,” Phase Transitions, Vol. 85, No. 8, 2012, pp. 735-749. doi:10.1080/01411594.2012.664275
- R. Mukundan and K. R. Ramakrishnan, “Moment Functions in Image Analysis: Theory and Applications,” World Scientific, Singapore, 1998.
- E. B. Priestley, P. J. Wejtowicz and P. Sehg, “Introduction to Liquid Crystals,” RCA Laboratories, Princeton, 1974.
- K. M. Hosny, “Exact Legendre Moment Computation for Gray Level Images,” Pattern Recognition, Vol. 40, No, 12, 2007, pp. 3597-3605. doi:10.1016/j.patcog.2007.04.014
- F. L. Alt, “Digital Pattern Recognition by Moments,” Journal of the Association of Computing Machinery, Vol. 9, No. 2, 1962, pp. 248-259. doi:10.1145/321119.321122
- J. Flusser, T. Suk and B. Zitova, “Moments and Moment Invariants in Pattern Recognition,” Wiley & Sons Ltd., London, 2009. doi:10.1002/9780470684757
- G. W. Gray, “Molecular Structure and the Properties of Liquid Crystals,” Academic Press, New York, 1962.
- R. C. Gonzalez, R. E. Woods and S. L. Eddins, “Digital Processing Using MATLAB,” Gatesmark Publishing, Knoxville, 2009.
- K. M. Hosny, “Refined Translation and Scale Legendre Moment Invariants,” Pattern Recognition Letter, Vol. 31, No. 7, 2010, pp. 533-538. doi:10.1016/j.patrec.2009.12.008
- R. Pavlis, “Kansas USA Edition of Micscape Magazine,” Microscopy UK, 2006.
- M. Parra, S. Hernández, J. Alderete and C. Zúñiga, “New Schiff’s Bases Containing 1,3,4-Thiadiazole and 1,3,4-Oxadiazole Units: A Study of the Effect of the Heterocyclic Ring and the Position of the Lateral Alkoxy Group on Liquid Crystalline Properties,” Liquid Crystal, Vol. 27, No. 8, 2000, pp. 995-1000. doi:10.1080/02678290050080715
NOTES
*Corresponding author.