Atmospheric and Climate Sciences
Vol.4 No.3(2014), Article ID:48254,25 pages
DOI:10.4236/acs.2014.43044
Temperature Trend on Makkah, Saudi Arabia
Abdellatif Esawy A. Abdou
Environment and Health Researches Department, The Custodian of the Two Holy Mosques Institute for Hajj and Umrah Research, Umm Al-Qura University, Makkah, Saudi Arabia
Email: aeabdou@uqu.edu.sa, abdellatif_abdou@yahoo.com
Copyright © 2014 by author and Scientific Research Publishing Inc.
This work is licensed under the Creative Commons Attribution International License (CC BY).
http://creativecommons.org/licenses/by/4.0/


Received 28 May 2014; revised 25 June 2014; accepted 27 July 2014
ABSTRACT
The main objective of this study is to investigate temperature trend and distribution over 29 years period (1985 to 2013) in Makkah, Saudi Arabia, the holiest city for all Muslims. Monthly mean, maximum, and minimum temperature levels and their trends are investigated using Regression analysis and Theil-Sen nonparametric test. Also, trends in deviations from the reference period (1985-2013) are analyzed. The results showed that the number of hot days and nights increased annually by 1.5966 and 1.832, respectively, while the number of cold nights decreased annually by 0.4054 nights. Both Regression analysis and Theil-Sen test demonstrated positive trends in mean, minimum and maximum temperature levels. Trends are determined for various seasons and months of the year. The annual mean of daily mean, maximum and minimum temperature increased by 0.0398˚C, 0.0552˚C, 0.0398˚C per year, respectively. The minimum value of monthly mean temperature (Tmmean = 23.98˚C) was found in January, whereas the maximum value of the mean temperature (Tmmean= 35.95˚C) was found in July. Maximum value of monthly mean of daily maximum temperature (Tmmax = 43.88˚C) was found in June and minimum (30.54˚C) in January. The monthly mean of the daily minimum temperature (Tmmin) varied between a minimum of 18.82˚C in January and a maximum of 29.59˚C in August. From the above analysis it can be concluded that Makkah is suffering from a considerable warming temperature trend which is confirmed by the Theil-Sen non-parametric test and there is potentially an increasing medical risk from heat waves that will be more intense. This requires specific attention toward: the energy demands for extra cooling, water resources, draughts, and medical preparedness by the decision makers in order to minimize these risks to residents, pilgrims who gather annually to perform hajj rituals and other visitors.
Keywords:Extreme Temperature, Heat Waves, Temperature Trends, Makkah, Saudi Arabia

1. Introduction
Global warming is the most significant environmental problem the world is experiencing today as concluded by the four IPCC Reports [1] -[4] . Following these reports, several long-term temperature studies have been done on different scales which show that there is a temperature increase globally [5] [6] . They showed that the rate of annual warming for global land areas over the 1901-2000 period was 0.078˚C per decade, and as in [7] which showed that the surface temperature of the Earth increased by 0.6˚C - 0.8˚C during the 20th century. According to the satellite measurements, the lower Tropospheric air temperatures have increased by 0.13˚C to 0.22˚C per decade since 1979 [8] .
Other regional studies over the south Mediterranean [9] showed that the summer temperatures had increased during the last 3 decades of the 20th century while the mean annual temperature records had a warming trend over the 1939 to 1989 period over Turkey [10] and a significant warming trend after the years 1957 and 1967 for the minimum and maximum temperatures in Jordan [11] . Also, a study over Kuwait [12] showed that the maximum yearly temperature was persistently exceeding its mean value during the last two decades and a considerable warming temperature trend and the rainfall decrease were the main reasons of the aridity in the Middle East which should be considered for rural development and water resources management in KSA [13] .
Another study [14] showed that there was a statistically significant temperature increase of 0.07˚C/decade over Kuwait during the period 1950-1990. The Variability of winter time surface air temperature (SAT) of 24 observing sites in the KSA based on time series over thirty one years (1978-2008) [15] showed that there was a warming trend in winter temperature during the last 2 decades at most sites and there was a significant warming trend after the year 1997 with a rate of 0.03˚C/year.
A recent seasonal climate study of temperature in the Arabian Peninsula [16] showed that temperature over Saudi Arabia had increased significantly in the rate 0.72˚C per decade in the dry season (June to September) against 0.51˚C per decade in the wet season (November to April) during 1979-2009. Also, it showed that maximum (Tmax), mean (Tmean) and minimum temperature (Tmin) had increased by 0.67˚C, 0.51˚C and 0.34˚C per decade in the wet season and by 0.8˚C, 0.72˚C and 0.63˚C in the dry season.
The extreme temperature trends over Jeddah, 70 km away of Makkah, had been analyzed by [17] for 40 years (1970 to 2006), reporting that that there was a significant increase in hot days per year and relatively smaller decrease in hot nights. They also confirmed that the increase in summer time temperatures and maximum temperatures was greater than that in the mean and minimum temperatures.
The surface air temperature data of 19 meteorological stations distributed through the KSA using cumulative sum, cumulative annual mean, and the Mann-Kendall rank statistical test for the period of 1978-2010 had showed that there was a negative temperature trend (cooling) with 0.03˚C/year for all stations during the first period (1978-1997), followed by a positive trend (warming) 0.06˚C/year in the second period (1998-2010) with reference to the entire period of analysis [18] .
Kingdom of Saudi Arabia (KSA) occupies about 86% of the area of the Arabian Peninsula (AP) [19] and is spread throughout AP, hence the climate of KSA can be representative for the AP climate [20] . Makkah is a very famous city, located around 70 km away from eastern coast of the Red Sea and is the capital of Makkah Province.
Makkah (latitude: 21.4 degree North, longitude: 39.85 degree East) has an area of 153,128 km2 [21] . It is a narrow valley at a height of 277 m above the sea level. Its population in 2013 was 7.7 million [21] , and increased year by year. Makkah is the birthplace of the prophet Mohammad (peace be upon him), and the place of the revelation of the Holy Quran. Makkah is regarded as the holiest city in the Muslim world and Muslims are required to visit it at least once in their life-time to perform a pilgrimage. In the modern times, Makkah has seen tremendous expansion in size and infrastructure. Currently, more than 15 million Muslims have visited Makkah annually, including several millions of pilgrims during the Hajj period. As a result of that, Makkah has become one of the most cosmopolitan and diverse cities in the Muslim world.
In Makkah the outdoor temperature may exceed 45˚C in summer. Exposes to high outdoor temperatures can result in heat exhaustion or heat stroke to many pilgrims, especially those who are not acclimatized [22] . In the current study, the trends in observed daily mean, minimum and maximum temperatures over Makkah have been investigated using 29 years (1985 to 2013) data collected at the Presidency of Meteorology and Environment (PME) monitoring station in Makkah, Saudi Arabia. The temperature issue in Makkah has special importance since the Hajj takes place every year on the 9th to 12th of the lunar month of Dhu Al Hijjah (Figure 1) referring to the Arabic, Islamic, Hejra Calendar (The Islamic Calendar began on the year 662 AD, the year in which the

Figure 1. Pilgrims in Arafat during the 9th lunar month of Dhu Al Hijjah.
Prophet Mohammed travelled to Medina). During that annual event, a drastic increase occurred in the numbers of Pilgrims to Makkah, approximately four millions in 2013. Muslims of more than 80 different nationalities come to Makkah to perform hajj every year [23] . So, the knowledge of the temperature trends may help the decision makers to make the right precautions in order to minimize or avoid the possible impacts of the extreme heat. Since the extreme temperatures can affect many areas of the society, it raises the powerful demand for air conditioning, increases water consumptions, and creates dangerous conditions for human health in terms of protection from heat waves [24] [25] .
The extreme hot weather is usually named as heat waves. However there is no universal definition for the heat waves, which is measured relative to the usual weather in the area and relative to the normal temperature for the season. Temperature that people from a hotter climate (acclimatized People) consider normal can be termed a heat wave in a cooler area for (non-Acclimatized). But during the pilgrimage season, most of the visitors belong to different nationalities and some of them who are not acclimatized surly are vulnerable to the temperature increase.
2. Site Description, Data and Methodology
Makkah is located in the south western part of Saudi Arabia (Figure 2). It comprises the Holy Mosque (Al-Haram Masjid) for the Muslims all over the world and has a rapid and continuous growth in population and infra-structure. Makkah has a large number of new buildings, large shopping malls and other supporting facilities. The temperature data used in this study covers 29 years from 1985 to 2013 and were recorded at Um Aljud station (latitude: 21.43˚N, longitude: 39.79˚E, Altitude: 273 m) which belongs to the Presidency of Meteorology and Environment (PME) in Saudi Arabia. The study incorporates daily mean, daily maximum and daily minimum values of temperature in the current analysis. The following figure shows the geographical location of Makkah city on the map of Saudi Arabia.
The effect of urbanization on the air temperature rise has been investigated by [26] in Saudi Arabia and found that the rise in air temperature is not likely to be due to urbanization changes resulting from population increase.
Quality Control of the Dataset
“Quality Control” is all methods used to detect and remove or reduce errors, loss, incompletion, redundancy, misidentification, misattribution and contamination in the data in the process of recording, manipulating, formatting, transmitting and archiving data to have higher quality, more efficiently and more consistently observation dataset [27] .
Following [27] -[29] , the applied QC procedures were:
Check of plausibility: to reject those values which never can exist; for example; the negative values of temperature in Makkah; the daily maximum temperature which is less than daily minimum temperature etc.
Calculating the mean climatological value N (norm) of the temperature, and the standard
deviation from the norm (s); If the ratio
 is too large, the datum M is rejected, or at least suspected.
Gross error limit checks: to determine whether the temperature values fall within a physically realistic range, this ranges is considered to be the mean of the value for the day plus (in case of maximum limit) or minus (in case of minimum limit) four times the standard deviation of the value for the day (s):
Maximum limit = mean + 4(s)
Minimum limit = mean – 4(s)
So the temperature value should fall between the Minimum limit and Maximum limit:
Minimum limit < Temperature Value < Maximum limit.
The daily temperature values outside of these thresholds are marked as potentially problematic; they are manually checked and corrected.
The probability distribution of the minimum, maximum and mean data are assessed using an R-based program and the results shown in Figure 3, Figure 4 and Figure 5.
Figure 1, Figures 3-5 summarize the daily minimum, maximum and mean temperature in (˚C) recorded from 1st of Jan 1985 to 31st of December 2013 at PME station in Makkah, the x-axis represents the temperature and the y-axis represents the frequency of occurrence.
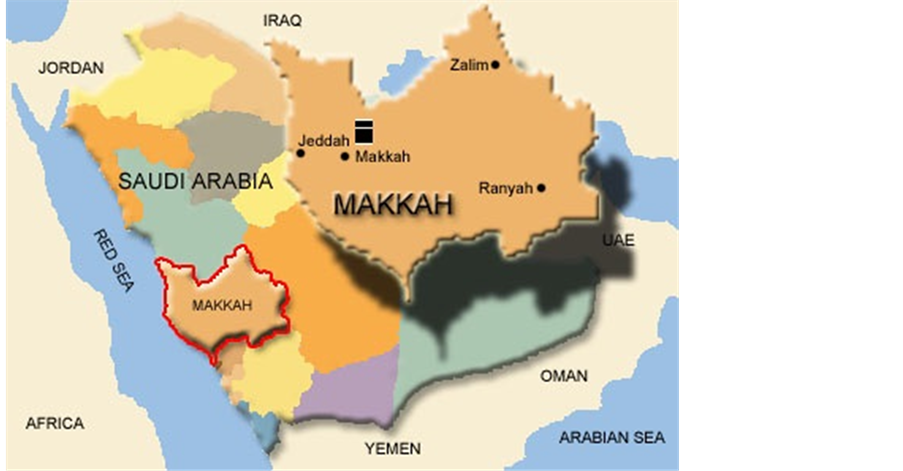
Figure 2. Location of Makkah on Saudi Arabia map.

Figure 3. Histogram of the daily minimum temperature (˚C).
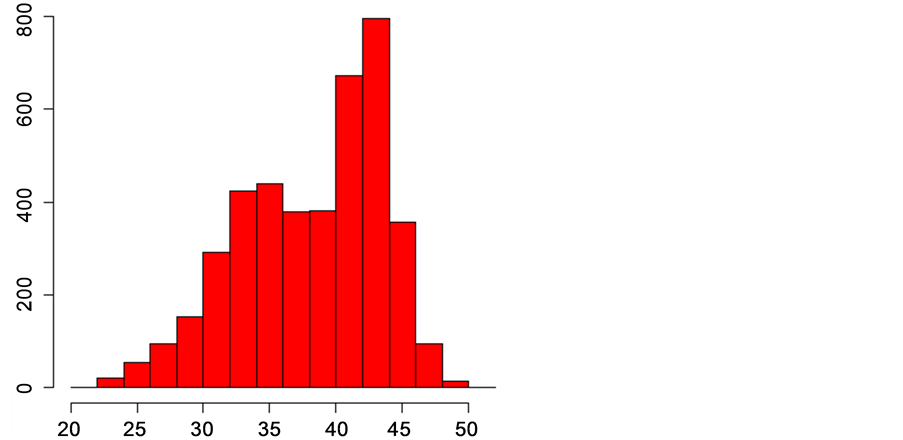
Figure 4. Histogram of the daily maximum temperature (˚C).
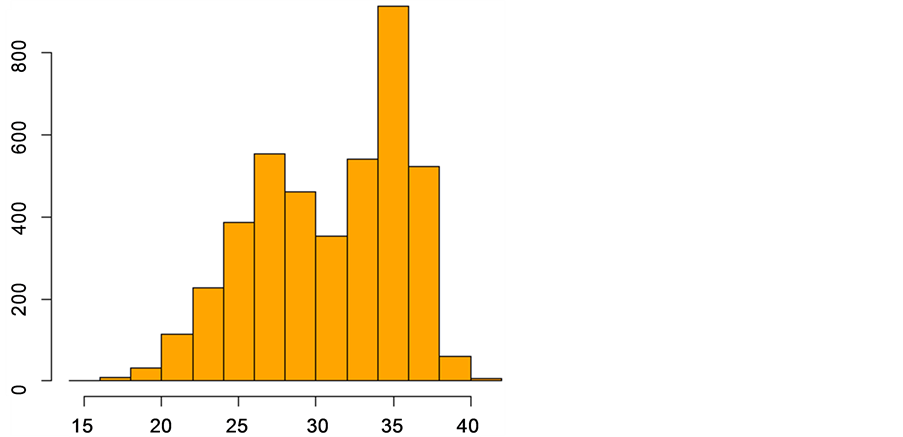
Figure 5. Histogram of the daily mean temperature (˚C).
(Figure 3) Represents a Bimodal histogram, it summarizes a dataset containing daily minimum temperatures observed in the period 1985-2013 and the bimodality is due to the fact that the dataset is heterogeneous. Also, it concludes that the probability of finding minimum temperatures less than 14˚C is very low and most of minimum temperatures lie between 20˚C and 30˚C. Also the probability of finding minimum temperatures more than 32˚C is also low.
(Figure 4) Represents a negatively (left) skewed histogram and summarizes a dataset containing daily maximum temperatures observed in the period 1985-2013. It shows that the probability of finding maximum temperatures less than 23˚C is very low and most of maximum temperatures lie between 32˚C and 44˚C. Also there is a probability of finding maximum temperatures greater than 45˚C.
(Figure 5) shows a bimodal histogram and summarizes a dataset containing daily mean temperatures observed in the period 1985-2013. It shows that the probability of finding mean temperatures less than 13˚C is very low and most of mean temperatures lie between 24˚C and 37˚C. Also there is a probability of finding mean temperatures greater than 38˚C.
The magnitude of the trends of increasing or decreasing temperature were derived from the slopes of the regression line using the least square method and the nonparametric Theil-Sen [30] , [31] statistical approach which is commonly used for trend quantification [32] . The Theil-Sen test calculates slopes between all pairs of points and the median of the slopes is selected as Theil-Sen estimate, which is taken as the trend of the Temperature for the given period. Furthermore, Theil-Sen test tends to yield accurate confidence intervals even with non-normal data and non-constant error variance (homoscedasticity) and is resistant to outliers, as it is based on the median of the slopes. Theil-Sen test was conducted in statistical software R, using package “openair” [33] .
(Figure 6) shows the daily minimum (blue), maximum (red) and mean (green) temperatures and show that daily maximum temperatures range between 20.8˚C and 51.4˚C, the daily minimum temperatures range between 10.6˚C and 37˚C and the daily mean temperatures range between 15.6˚C and 45˚C From (Table 1), it is clear that the daily maximum temperature have increased by 0.0002˚C/day and the daily minimum temperature has increased by 0.0003˚C/day, while the daily mean temperature has increased by 0.0001˚C/day during the whole period (1985-2013).
The number of hot and cold nights and days were estimated using daily maximum and minimum temperatures recorded during different year. Days are considered hot if the maximum daily temperature exceed 35˚C (Tdmax ³ 35˚C), nights are defined hot when daily min temperature reaches 20˚C (Tdmin ³ 20˚C), the days are defined as cold when Tdmax £ 20˚C and finally nights are classified as cold when Tdmin £ 15˚C [17] . The monthly and annual standard deviations were calculated. The temperature range has obtained by taking the difference between the maximum and minimum temperatures of the daily mean values.
3. Results and Discussion
The data of daily maximum (Tdmax), daily mean (Tdmean) and daily minimum (Tdmin) levels of temperature, monthly mean of maximum (Tmmax), monthly mean of daily mean(Tmmean) and monthly mean of minimum (Tmmin) values of temperatures and annual mean of maximum (Tamax), mean (Tamean) and minimum(Tamin) values of temperatures are analyzed and discussed in the coming sections.
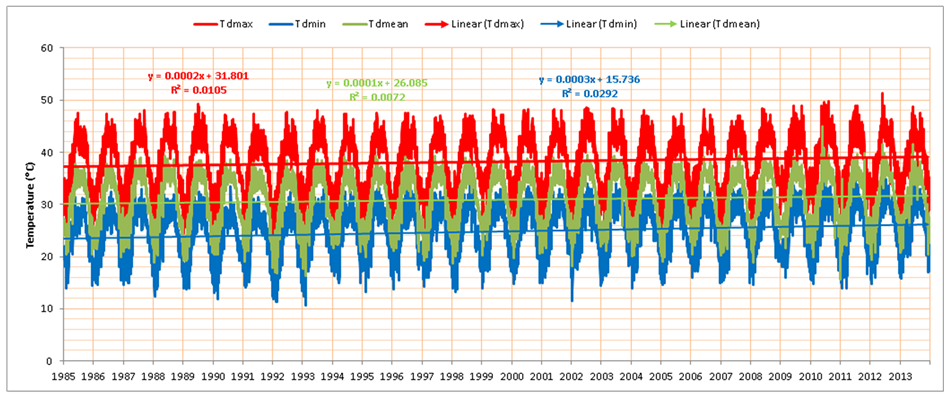
Figure 6. Daily maximum, minimum and mean temperatures during the period (1985-2013) over Makkah.

Table 1 .Linear regression equation for the daily maximum, minimum and mean temperature.
3.1. Temperature Data Summary
The overall variations of maximum, mean and minimum levels of daily maximum, daily mean and daily minimum temperature during 1985-2013 are summarized in Table2 The maximum, mean and minimum of daily maximum temperature (Tdmax) were 51.4˚C, 38.26˚C and 20.8˚C, respectively with standard deviation of 5.31˚C. Similarly the maximum, mean and minimum of daily mean temperature (Tdmean) were 45.0˚C, 30.91˚C and 15.6˚C with standard deviation of 4.76˚C and daily minimum temperature (Tdmin) varied between 37.0˚C and 10.6˚C while the overall mean was 24.84˚C with standard deviation of 4.48˚C as given in Table2
3.2. Frequency of Hot/Cold Days and Nights
The number of hot days (Tdmax ³ 35˚C) and hot nights (Tdmin ³ 20˚C) and cold days (Tdmax £ 20˚C), and cold nights (Tdmin £ 15˚C) during the period of study (1985-2013) were calculated and depicted in (Figure 7). It is shown that the number of hot nights and the number of hot days per year have positive trends. The regression lines of best fit show that the frequency of the hot nights has increased by 1.832 nights per year and that of hot days increased by 1.597 days each year. Also, the number of cold nights per year shows negative trend, whereas the number of cold days per year shows no variations. The regression lines of best fit show that the frequency of the cold nights has decreased by 0.405 nights per year.
3.3. Variation of Daily Mean Temperature (Tdmean)
The long term monthly mean (Tmmean) temperature were calculated using daily average values during the period 1985 to 2013 and were shown in (Figure 8). The monthly minimum and maximum of daily mean values are also displayed in this figure. The minimum mean temperature of 23.98˚C was found in January while a maximum mean temperature of 35.95˚C in July. This means that the ratio of hottest and coldest months was 1.499.
Table 2. Mean temperature data summary for Makkah during 1985-2013.
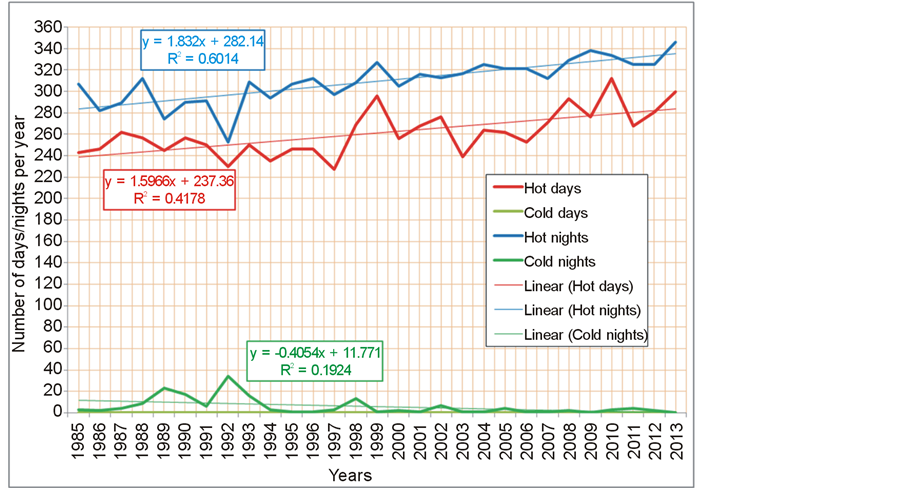
Figure 7. Annual frequency of hot days and nights and cold days and nights.
Higher values of mean temperature were observed from May to September, as shown in (Figure 8). The monthly maximum of 37.68˚C and minimum of 20.49˚C of the daily average temperatures were also observed in July and February, respectively. In this case the ratio between the hottest and cold temperature months was 1.84. Also, the same trend was followed by the monthly minimum values of the daily average temperature with hottest to coldest month’s temperature ration of 1.613.
The monthly mean temperature (Tmmean), the corresponding standard deviations, difference between the monthly maximum and minimum temperature of daily mean values (range) and the covariance are given in Table3
It is found that the higher values of covariance (COV) correspond to higher standard deviations (SD) and smaller values of covariance to smaller standard deviations.
Higher values of COV and SD were observed for the winter months and the lower values for summer which is an indicative for relatively more stable temperatures in summer. COV varied between 0.19% and 8.02% corresponding to September and February during the year. This shows that the temperature is most stable in September and least in February.
3.4. Trend Analysis of Monthly Mean of Daily Mean Temperatures (Tmmean)
The trends of monthly mean values of daily mean temperature over different years were obtained using linear regression best fit lines. The linear regression trends for all the months from January to December are shown in (Figures 9(a)-(i)), respectively and the corresponding best fit equations along with coefficient of determination are summarized in Table4
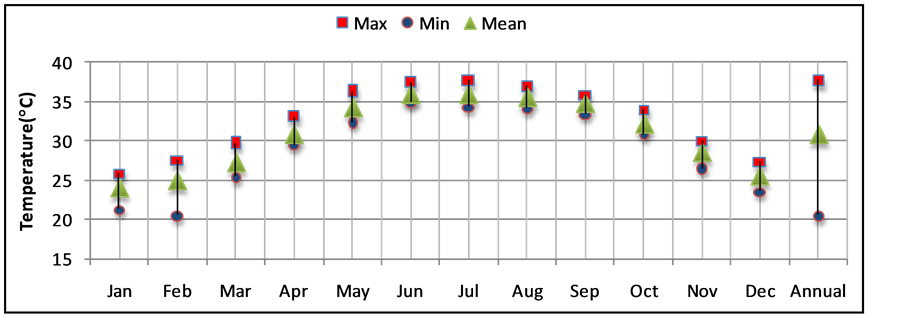
Figure 8. Variations of monthly mean, maximum and minimum of daily mean temperature.
Table 3. Statistical summary of monthly mean temperature of daily mean values.
Table 4. Linear regression equation for all the months (Tmmean).
It is clear from (Figures 9(a) to (c)) that monthly mean of daily mean temperature had increased during the whole months and the annual increases were shown in (Figure 10), it is clear from this figure that the major increase occurred in February, June, December, October, July and April with annual increase of 0.1145˚C, 0.0478˚C, 0.0437˚C, 0.0429˚C, 0.0385˚C and 0.0306˚C, respectively, which implies that the months February, June, December, October, July and April Tmmean increased by 3.3205˚C, 1.3862˚C, 1.2673˚C, 1.2441˚C, 1.1165˚C, 1.073˚C during the last 29 years (Figure 11).
3.5. Trend Analysis of Annual Mean of Daily Mean Temperatures (Tamean)
From (Figure 12) it is clear that annual mean of daily mean temperature is increasing by 0.0398˚C per year. This implies that over the last 29 years the annual mean temperature of Makkah has increased by 1.1542˚C.
As shown in (Figure 13) the annual deviations from overall mean temperature show major decreasing trends during the period (1985 to 1997) and major increasing trends during the period (1998 to 2013).
3.6. Variation of Daily Maximum Temperature (Tdmax)
The long term monthly mean (Tmmax) of the daily maximum temperatures (Tdmax) were calculated during the years 1985 to 2013 and shown in (Figure 14). As it is clear, the higher mean of Tmmax of 43.88˚C was found in June while a lower of 30.54˚C in January. Also, it is clear that the Tmmax is greater than 30˚C most of the time during the year.
(Figure 15) shows the daily maximum temperatures which exceed 44˚C which affects the Humidex value and hence the human activities and health [33] . The extreme (51.3˚C) temperature has been recorded on 6 June 2012. There are three cases on 3 July 1989, 21 June 2010 and 7 August 2010 that have recorded maximum temperatures 49.2˚C, 49.9˚C, 49.3˚C, respectively. The best fit regression line show an increase of 0.0002 days of extreme temperatures per year. The extreme heat is well connected to the cause of Heat Stroke, Sun Stroke, Heat Syncope, Heat Cramps, Cardiovascular Diseases, Epilepsy, Diabetes, Breathing Disorders, Dehydration, Sunburn, Blisters, Syncope, Viral Infection, Bacterial Infections, Gastrointestinal Diseases, Respiratory Diseases, Falls-Sprains/Strains, Cuts and Abrasions, Burns, Crush Injuries, Bone Fractures [34] and exacerbates many pre-existing health conditions. The extreme heat specially with increasing humidity conditions are more stressful to human health more than isolated hot days [35] [36] .
The monthly mean temperature (Tmmax), their corresponding deviations from overall means and standard deviations and COV are given in (Table 5). Higher mean values of COV and standard deviations were observed for winter months (January, February and December) while lower for summer months (May to October). This indicated that the temperature in summer was relatively more stable.
3.7. Trend Analysis of Monthly Mean of Daily Maximum Temperatures (Tmmax)
(Figure 16) shows the linear regression trends of monthly mean of daily maximum temperature from January to December. As shown in (Figure 17), the monthly mean of daily maximum temperature have increased in all months with annual increase of, 0.0494, 0.1387, 0.0481, 0.0585, 0.041, 0.0412, 0.042, 0.0278, 0.0087, 0.0594, 0.060, 0.0619 for the months January to December, respectively. This implies that the monthly mean of daily maximum temperature have increased by 1.4326˚C, 4.0223˚C, 1.3949˚C, 1.6965˚C, 1.189˚C, 1.1948˚C, 1.218˚C, 0.8062˚C, 0.2523˚C, 1.7226˚C, 1.74˚C and 1.7951˚C during the last 29 years (Figure 18). It is noticed that the most significant increase was in February. The corresponding best fit equation and the determination coefficient are mentioned in (Table 6).
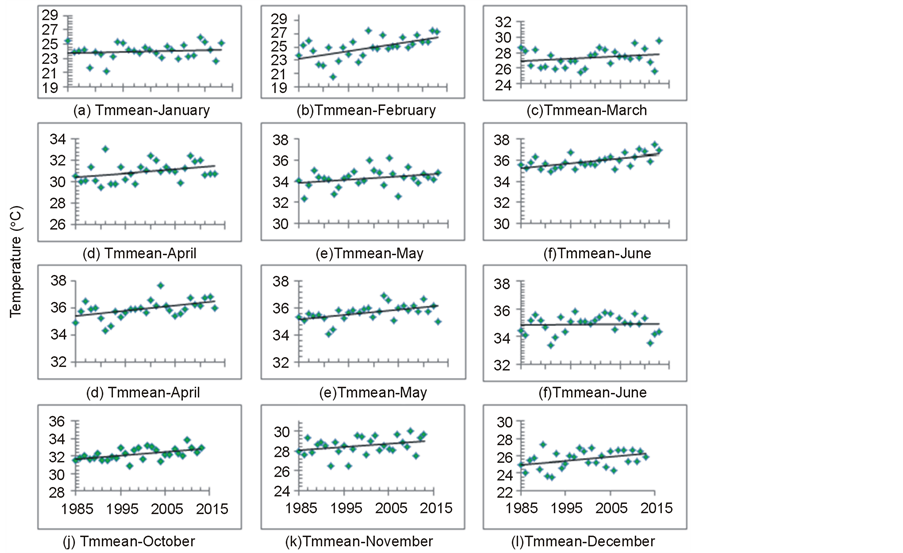
Figure 9. Linear regression trends of monthly mean of daily mean temperatures.
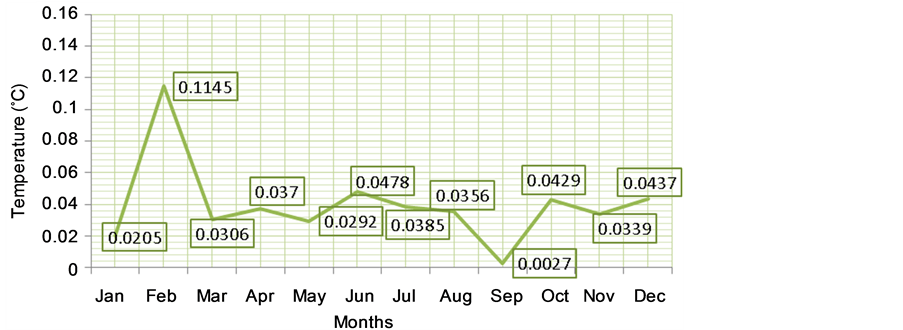
Figure 10. The annual increase in monthly mean of the daily mean temperature (Tmmean).
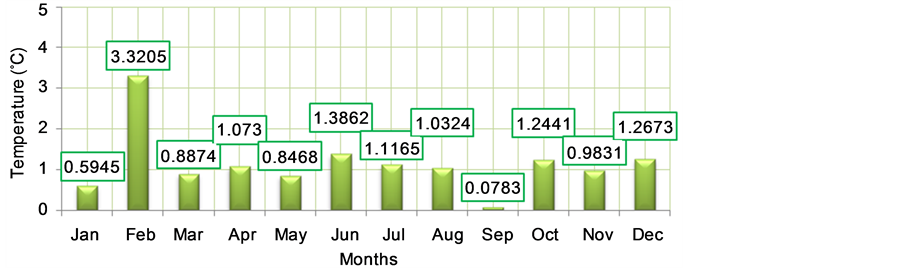
Figure 11. Tmmean total increase in the last 29 years.
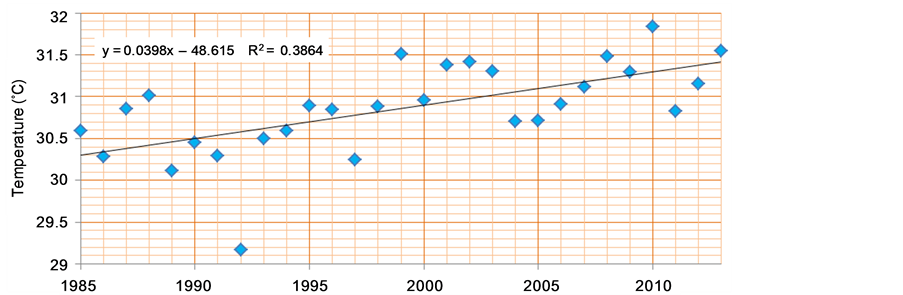
Figure 12. Trend of annual mean of daily mean temperature (Tamean).
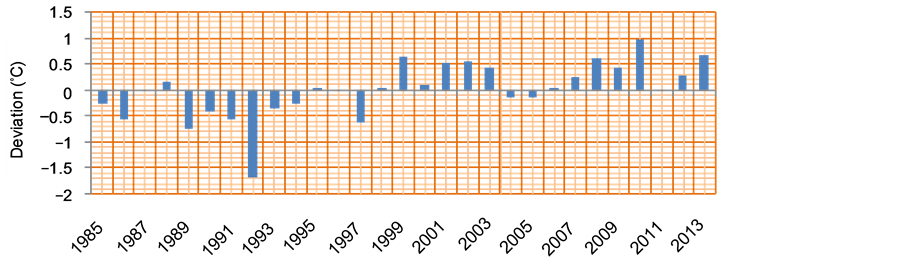
Figure 13. Trend of annual deviation from overall mean (Tamean).

Figure 14. Variation of monthly mean, maximum and minimum temperature of daily maximum values.
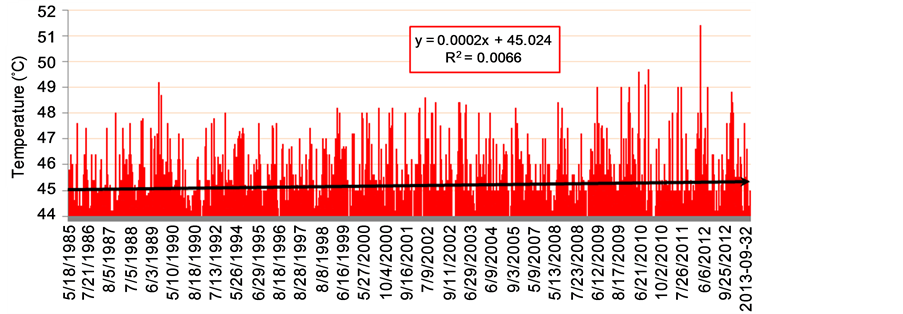
Figure 15. Recorded daily Maximum Temperature which is greater than 44˚C.
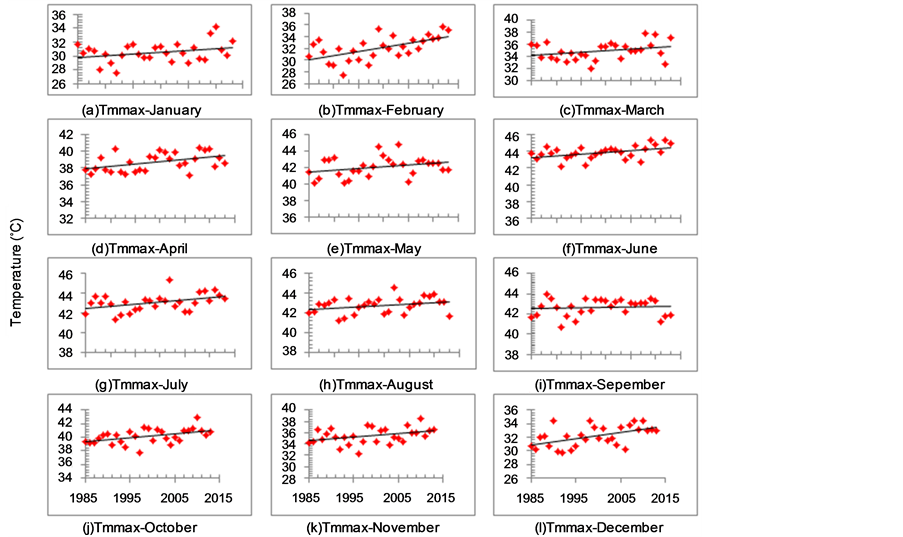
Figure 16. Linear regression trends of monthly mean of daily maximum temperature.
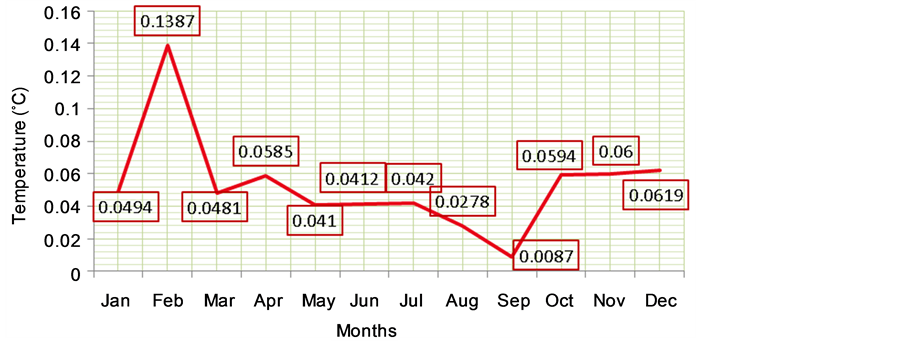
Figure 17. Annual increment in the mean of monthly mean of daily maximum temperature (Tmmax).
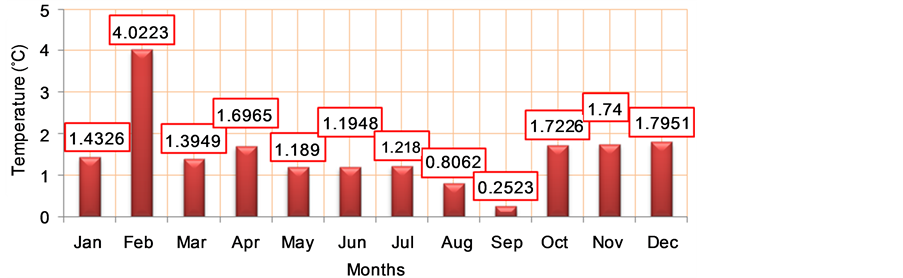
Figure 18. Tmmax total increase in the last 29 years.
Table 5 .Statistical summary of monthly mean temperature of daily maximum values.
Table 6. Linear regression equation for all the months (Tmmax).
3.8. Trend Analysis of Annual Mean of Daily Maximum Temperatures (Tamax)
As shown in (Figure 19), the annual mean of daily maximum temperature shows an increasing trend with an annual rise of 0.0552˚C, which implies that over the last 29 years the annual mean of daily maximum temperature of Makkah has increased by 1.6008˚C.
(Figure 20) shows that the annual deviation from overall mean temperature shows major negative trends during the interval (1985 to 1997) and major positive trends during the period (1998 to 2013) except. The maximum cooling was found in the year 1992 while the maximum warming was recorded in the year 2010.
3.9. Variation of Daily Minimum Temperature (Tdmin)
The monthly mean temperatures along with the monthly maximum and minimum of daily minimum (Tmmin) values during the period 1985 to 2013 are shown in (Figure 21). The Tmmin varied between a minimum of 18.82˚C in January and a maximum of 29.59˚C in August. This means that the ratio between the hottest to the coldest Tmmin is 1.572. Tmmin is found to be greater than 20˚C during the whole year except for January and February.
The monthly maximum of daily minimum temperatures (37˚C) was recorded on the 2nd of June 2012 while the monthly minimum of daily minimum temperature (10.6˚C) was recorded on the 8th of February 1993 as shown in (Figure 22). This means that the ratio of hottest to lowest minimum temperature was 3.49.
The monthly mean of daily minimum temperature (Tmmin), the corresponding standard deviations from overall mean, the range, and the COV are given in (Table 7). Again higher values of COV and standard deviation were observed for February.
The deviations of monthly mean temperature from overall mean show negative values for all months the highest values were observed in January −0.0000586207˚C and lowest in July −0.000931034˚C.
The maximum range of 7.54˚C was observed for February and minimum of 3.45˚C in September.
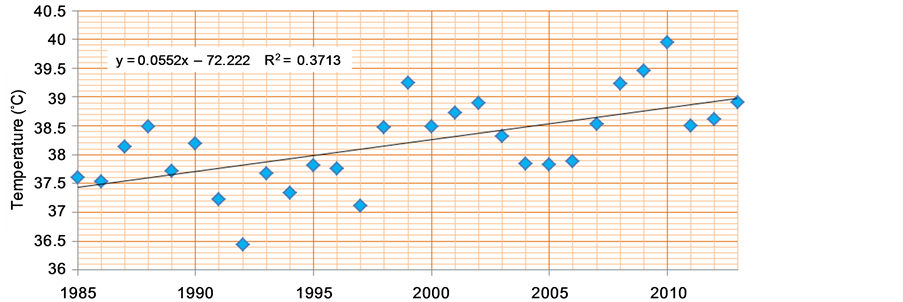
Figure 19. Trend of annual mean of daily mean temperature (Tamax).
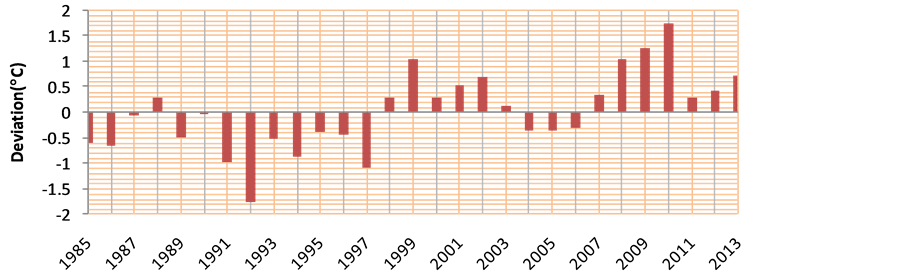
Figure 20. Trend of annual deviation from overall mean (Tamax).

Figure 21. Variation of monthly mean, maximum and minimum temperature of daily minimum values.
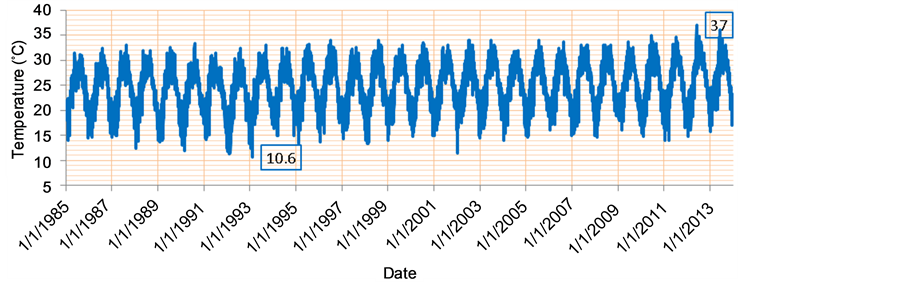
Figure 22. Variability of daily minimum temperature during the period 1985 to 2013.
Table 7 .Statistical summary of monthly mean temperature of daily minimum values.
3.10. Trend Analysis of Monthly Mean of Daily Minimum Temperatures (Tmmin)
The linear regression trends of monthly mean of daily minimum temperatures from January to December are shown in (Figures 23(a) to (i)), the corresponding best fit equations in (Table 8). The increasing trends in the values of Tmmin were observed in all months of the year with an annual increase (Figure 24), 0.0556˚C, 0.1491˚C, 0.07˚C, 0.0774˚C, 0.0677˚C, 0.1215˚C, 0.1075˚C, 0.105˚C, 0.0459˚C, 0.0833˚C, 0.0667˚C and 0.0619˚C for January to December, respectively. This implies that in Makkah the Tmmin has increased during the last 27 years with 1.6124˚C, 4.3239˚C, 2.03˚C, 2.2446˚C, 1.9633˚C, 3.5235˚C, 3.1175˚C, 3.045˚C, 1.3311˚C, 2.4157˚C, 1.9343˚C and 1.7951˚C (Figure 25), for January to December, respectively.
3.11. Trend Analysis of Annual Mean of Daily Minimum Temperatures (Tamin)
The annual mean of daily minimum temperature, as shown in (Figure 26), showed significant increasing trend with an annual rise of 0.0398˚C which implied that over the last 29 years the annual mean of daily minimum temperature of Makkah had increased by 1.1542˚C. As shown in (Figure 27) the annual deviations from overall mean temperature showed major negative trends during the periods (1985 to 1997) and positive trends in the period (1988 to 2013).
3.12. Using the Theil-Sen Nonparametric Statistical Approach
Temporal trends of the observed daily minimum, maximum and mean temperature in Makkah have been analyzed for the last 29 years to determine how they are changed over the time using the Theil-Sen nonparametric statistical approach. The advantage of using the Theil-Sen estimator is that it tends to yield accurate confidence intervals even with non-normal data and heteroscedasticity (non-constant error variance). It is also resistant to outliers [37] . All trends expressed in (˚C/year).
3.12.1. Annual Trend in Daily Mean Temperature (Using Theil-Sen Method)
(Figure 28) shows the annual trend in the daily mean temperature in Makkah. The solid redline shows the trend estimate and the dashed red lines show the 95% confidence intervals for the trend based on resampling methods. The overall trend is shown at the top-left as 0.05˚C per year and the 95% confidence intervals in the slope from 0.05˚C/year - 0.06˚C/year. The *** shows that the trend is significant to the 0.001 level. The significance level in this case is very high providing very strong evidence that the annual mean temperature increased over the period.
3.12.2. Seasonal Trend in Daily Mean Temperature (Using Theil-Sen Method)
(Figure 29) shows four panels for the seasonal trend in the daily mean temperature at Makkah. The solid red line shows the trend estimate and the dashed red lines show the 95% confidence intervals for the trend based on resampling methods. The spring (MAM) season (top left panel) trend is 0.06˚C per year and the 95% confidence intervals in the slope from 0.05˚C/year - 0.08˚C/year
Table 8. Linear regression equation for all the months (Tmmin).
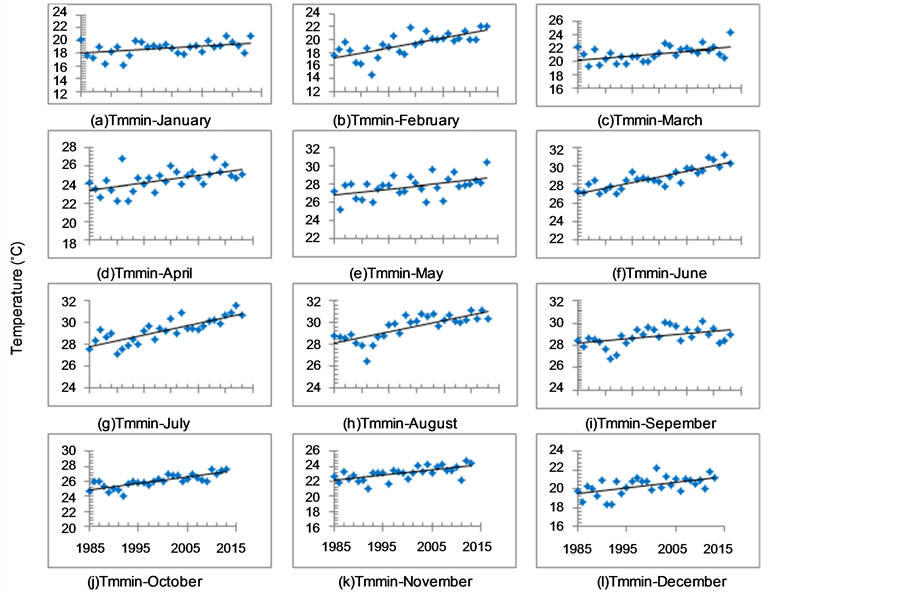
Figure 23. Linear regression trends of monthly mean of daily minimum temperature.
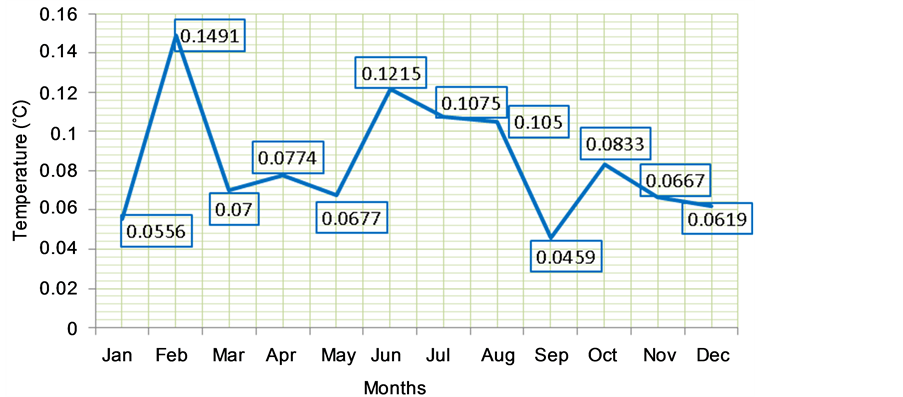
Figure 24. Annual increment in the monthly mean of daily minimum temperature (Tmmin).
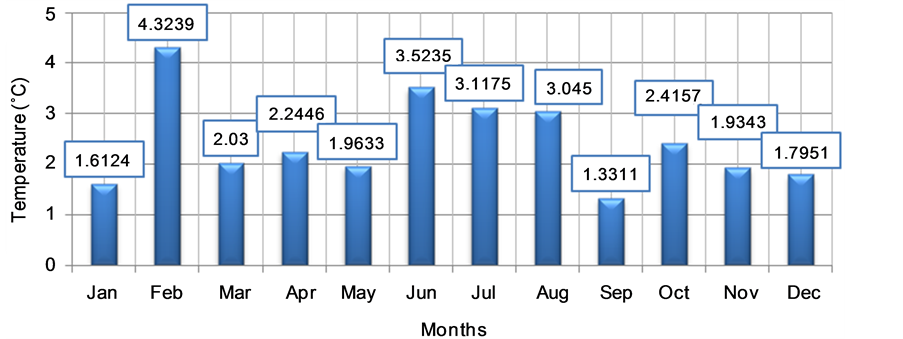
Figure 25. Tmmin total increase in the last 29 years.
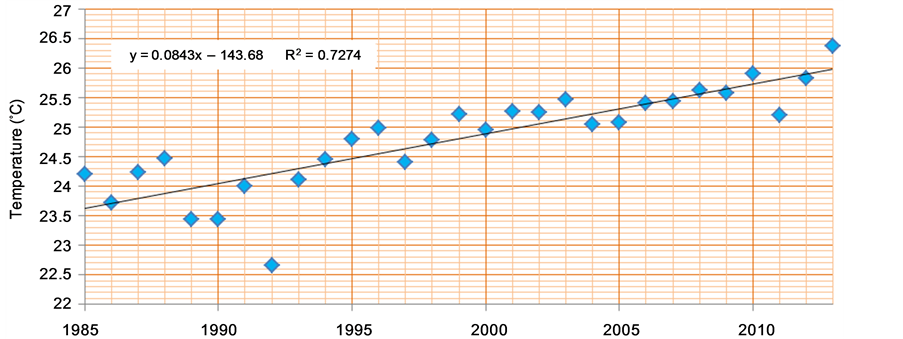
Figure 26. Trend of annual mean of daily minimum temperature (Tamin).
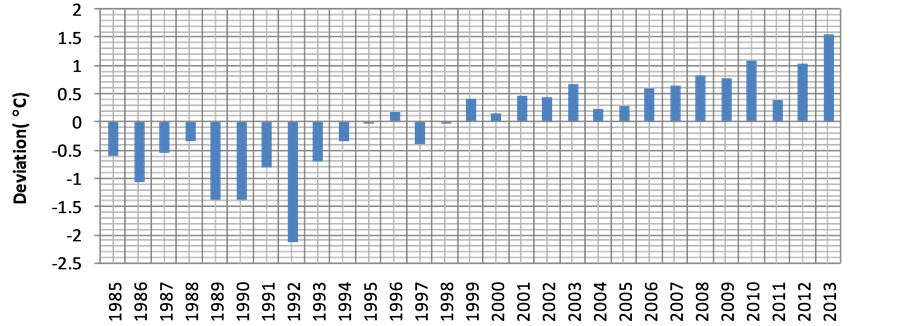
Figure 27. Trend of annual deviation from overall mean (Tamin).
The summer (JJA) season (top left panel) trend is 0.05˚C per year and the 95% confidence intervals in the slope from 0.04˚C/year - 0.06˚C/year. The autumn (SON) season (bottom left panel) trend is 0.05˚C per year and the 95%confidence intervals in the slope from 0.04˚C/year - 0.07˚C/year. The winter (DJF) season (bottom right panel) trend is 0.04˚C per year and the 95% confidence intervals in the slope from 0.02˚C/year - 0.06˚C/year. In all panels, the *** show that the trend is significant to the 0.001 level. The significance level in this case is very high providing very strong evidence that the seasonal mean temperature increased over the period.
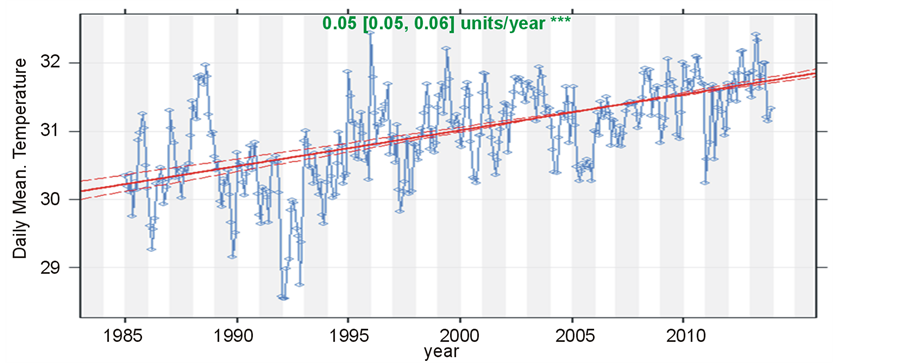
Figure 28. Annual trend in daily mean temperature.
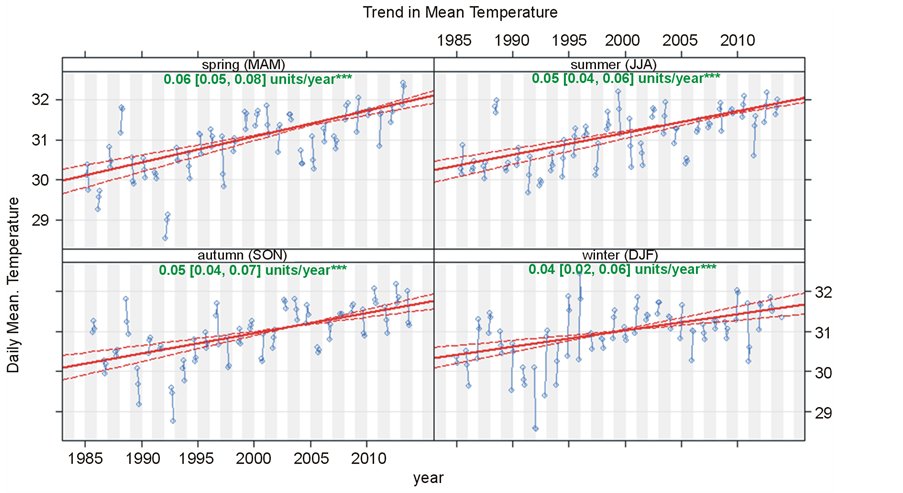
Figure 29. Seasonal trend in daily mean temperature.
3.12.3. Monthly Trend in Daily Mean Temperature
Figure 30 shows that the monthly trends increase in the daily mean temperature at Makkah with the values; 0.03˚C, 0.04˚C, 0.04˚C, 0.07˚C, 0.08˚C, 0.05˚C, 0.06˚C, 0.05˚C, 0.06˚C, 0.05˚C, 0.05˚C, 0.05˚C for Jan., Feb., Mar., Apr., May., Jun., Jul., Aug., Sep., Oct., Nov. and Dec. during the period 1985-2013 and the trend is significant to the 0.001 level (***) providing very strong evidence that the monthly mean temperature increased over the period. This confirms the increasing trend obtained from regression in Figure 9.
3.12.4. Annual Trend in Daily Maximum Temperature (Using Theil-Sen Method)
(Figure 31) shows the annual trend in the daily maximum temperature at Makkah. The solid red line shows the trend estimate and the dashed red lines show the 95% confidence intervals for the trend based on resampling methods. The overall trend is shown at the top-left as 0.07˚C per year and the 95% confidence intervals in the slope from 0.06˚C/year - 0.08˚C/year. The *** shows that the trend is significant to the 0.001 level. The significance level in this case is very high providing very strong evidence that the annual maximum temperature increased over the period.
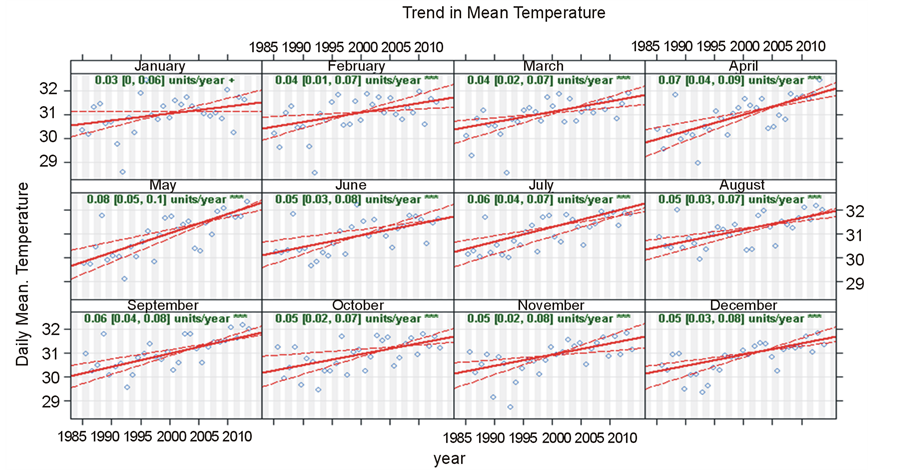
Figure 30. Monthly trend in daily mean temperature.
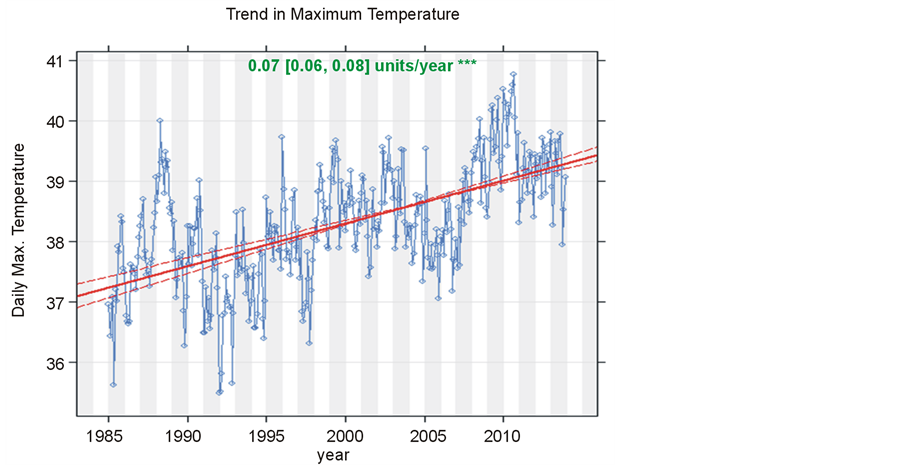
Figure 31. Annual trend in daily maximum temperature.
3.12.5. Seasonal Trend in Daily Maximum Temperature (Using Theil-Sen Method)
(Figure 32) shows four panels for the seasonal trend in the daily maximum temperature as follows: 0.06˚C, 0.08˚C, 0.06˚C and 0.06˚C per year for the spring (MAM) season (top left panel), the summer (JJA) season (top left panel), the autumn (SON) season (bottom left panel) and the winter (DJF) season (bottom right panel), respectively. All panels show that the trend level is significant to the 0.001 level (***) providing very strong evidence that the seasonal minimum temperature increased over the period.
3.12.6. Monthly Trend in Daily Maximum Temperature (Using Theil-Sen Method)
(Figure 33) shows that the monthly trends increase in the daily mean temperature at Makkah with the values 0.05˚C, 0.07˚C, 0.06˚C, 0.08˚C, 0.11˚C, 0.07˚C, 0.08˚C, 0.07˚C, 0.08˚C, 0.06˚C, 0.04˚C and 0.07˚C for Jan., Feb., Mar., Apr., May., Jun., Jul., Aug., Sep., Oct., Nov. and Dec. during the period 1985-2013 and the trend is significant to the 0.001 level (***) providing very strong evidence that the monthly maximum temperature increased over the period. This confirms the increasing trend obtained from regression in Figure 13.
3.12.7. Annual Trend in Daily Minimum Temperature (Using Theil-Sen Method)
(Figure 34) shows the annual trend in the daily minimum temperature at Makkah. The solid red line shows the trend estimate and the dashed red lines show the 95% confidence intervals for the trend based on resampling methods. The overall trend is shown at the top-center as 0.09˚C per year and the 95% confidence intervals in the
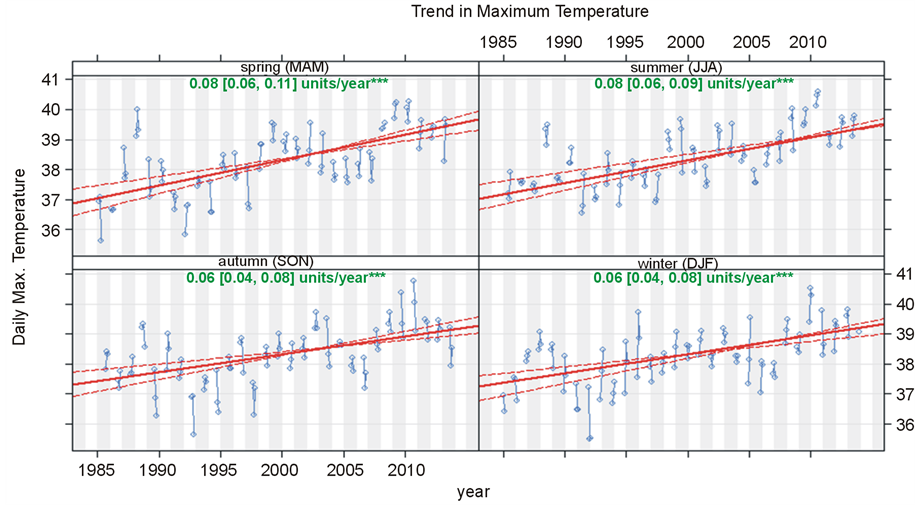
Figure 32. Seasonal trend in daily maximum temperature.
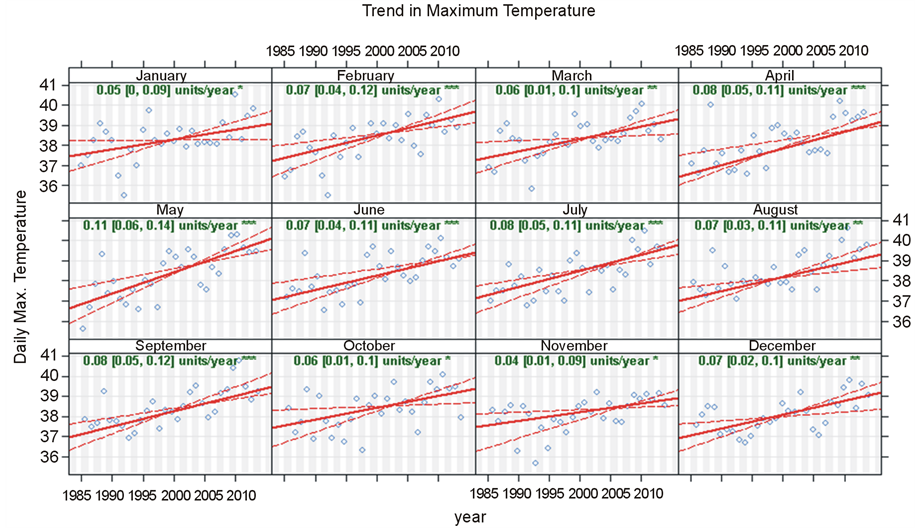
Figure 33. Monthly trend in daily maximum temperature.
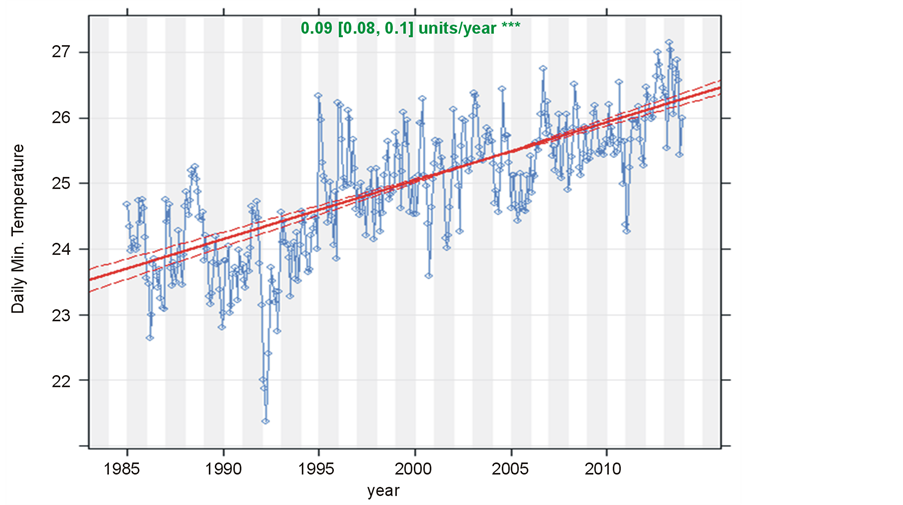
Figure 34. Annual trend in daily minimum temperature.
slope from 0.08˚C/year - 0.1˚C/year. The *** shows that the trend is significant to the 0.001 level. The significance level in this case is very high providing very strong evidence that the annual minimum temperature increased over the period.
3.12.8. Seasonal Trend in Daily Minimum Temperature (Using Theil-Sen Method)
(Figure 35) shows four panels for the seasonal trend in the daily maximum temperature as follows: 0.09˚C, 0.09˚C, 0.09˚C and 0.08˚C per year for the spring (MAM) season (top left panel), the summer (JJA) season (top left panel), the autumn (SON) season (bottom left panel) and the winter (DJF) season (bottom right panel) respectively. All panels show that the trend level is significant to the 0.001 level (***) providing very strong evidence that the seasonal minimum temperature increased over the period.
3.12.9. Monthly Trend in Daily Minimum Temperature (Using Theil-Sen Method)
(Figure 36) shows that the monthly trends increase in the daily minimum temperature at Makkah with the values; 0.06˚C, 0.07˚C, 0.07˚C, 0.1˚C, 0.1˚C, 0.1˚C, 0.09˚C, 0.08˚C, 0.1˚C, 0.09˚C, 0.08˚C and 0.11˚C for Jan., Feb., Mar., Apr., May., Jun., Jul., Aug., Sep., Oct., Nov. and Dec. during the period 1985-2013 and the trend is significant to the 0.001 level (***) providing very strong evidence that the minimum temperature increased over the period. This confirms the increasing trend obtained from regression in Figure 20.
4. Results Summary
The main findings of this study could be summarized in the following points:
• The number of hot days/nights increased annually by 1.5966/1.832 days and during the period 1985 to 2013 and during the last 29 years the hot days/nights have increased by 45.30/53.128 days and confirmed by [38] [39] [28]
• The number of cold nights decreased annually by 0.4054 which implies that the number of cold nights were decreased with 11.7566 days during the last 29 years.
• The regression trend analysis of monthly mean temperatures Tmmean, Tmmax and Tmmin showed positive trend in temperature in Makkah and the covariance values indicated more stable temperature patterns in summer.
• The minimum value of the monthly mean of the daily mean temperature (Tmmean) of 23.98˚C was found in January while a maximum value of 35.95˚C was recorded in July.
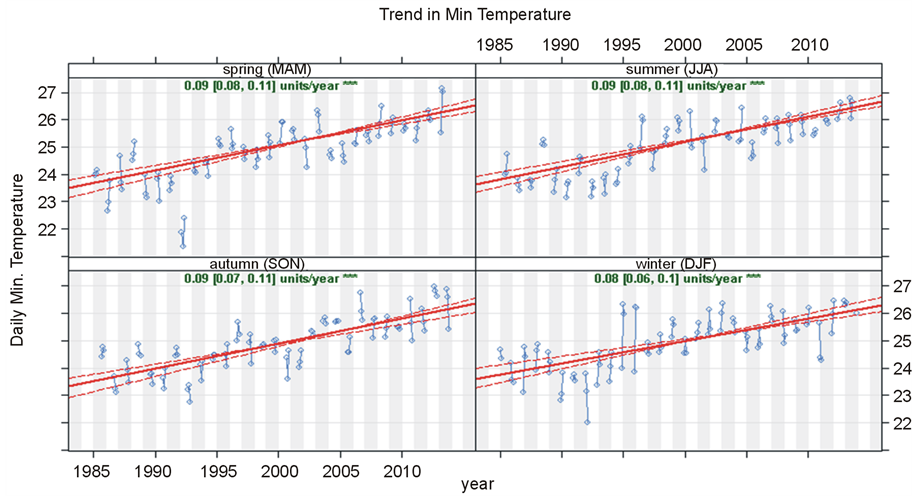
Figure 35. Seasonal trend in daily minimum temperature.
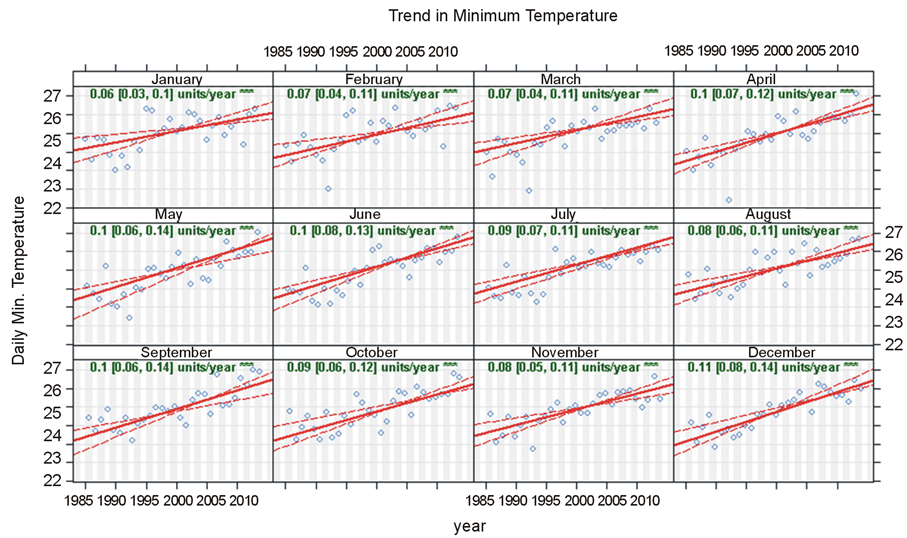
Figure 36. Monthly trend in daily minimum temperature.
• The monthly mean of daily mean temperature have increased during the whole months.
• Tmmean increased by 3.3205˚C, 1.3862˚C, 1.2673˚C, 1.2441˚C, 1.1165˚C, and 1.073˚C during the months February, June, December, October, July and April of the whole period.
• The trend of the annual mean of daily mean temperature increased by 0.0398˚C per year, which implies that over the last 29 years the annual mean temperature of Makkah has increased by 1.1542˚C.
• The maximum value of Tmmax of 43.88˚C was found in June while a minimum of 30.54˚C in January.
• The number of days of recoded temperatures exceeds 44˚C increased 0.0002 day annually during the period.
• The monthly mean of daily maximum temperature have increased with 1.4326˚C, 4.0223˚C, 1.3949˚C, 1.6965˚C, 1.189˚C, 1.1948˚C, 1.218˚C, 0.8062˚C, 0.2523˚C, 1.7226˚C, 1.74˚C and 1.7951˚C during the last 29 years
• The annual mean of daily maximum temperature show an increasing trend with an annual rise of 0.0552˚C, which implies that over the last 29 years the annual mean of daily maximum temperature of Makkah has increased by 1.6008˚C.
• The Tmmin varied between a minimum of 18.82˚C in January and a maximum of 29.59˚C in August.
• The monthly maximum of daily minimum temperatures (37˚C) was recorded on the 2nd of June 2012 while the monthly minimum of daily minimum temperature (10.6˚C) was recorded on the 8th of February 1993.
• The Tmmin has increased during the last 27 years with 1.6124˚C, 4.3239˚C, 2.03˚C, 2.2446˚C, 1.9633˚C, 3.5235˚C, 3.1175˚C, 3.045˚C, 1.3311˚C, 2.4157˚C, 1.9343˚C and 1.7951˚C.
• The increasing trend in the annual and the monthly mean of daily mean (Tdmean), daily maximum (Tdmax) and daily minimum (Tdmin) temperatures (Tmmin) determined by regression method have been confirmed by the nonparametric Theil-Sen method.
• The increasing trend of the annual mean of minimum, maximum and mean temperature is confirmed by both [16] and [40] with slight difference in the rate.
5. Conclusion
The analysis of the hot days/nights based on temperature thresholds reveals that summers are expanding and winters are shrinking in Makkah, resulting in more pressure on water and energy sectors. The increasing trend of intense heat may cause health problems for the pilgrims. The observed trend of temperature increase is alarming; it may alter the local climate as observed very recently in terms of flash flooding in Makkah. The results indicate the vulnerability of the Holly City. The results will be helpful for the policy makers to reduce the future risks associated with rapidly changing climate of Makkah.
Acknowledgments
Thanks are expressed to the Presidency of Meteorology and Environment in Saudi Arabia for providing the observation dataset. Also, the author would like to acknowledge Dr. Bakry Ben Maatouq Assas (the Director of Um-AlQura University), Prof. Dr. A. H. Asghar (the Dean of the Custodian of the Two Holy Mosques’ Institutes for Haj and Umrah Research), Dr. Turki Habeebullah (the Head of the Environment and Health Researches Department) for their support and continuous encouragement and Dr. Said Munir for internally reviewing the manuscript. The author greatly appreciates the contribution of the anonymous reviewers, as a result of which the manuscript has considerably improved.
References
- IPCC (2007) Climate Change 2007: The Physical Science Basis. In: Solomon, S., Qin, D., Manning, M., Chen, Z., Marquis, M., Averyt, K.B., Tignor, M. and Miller, H.L., Eds., Contribution of Working Group I to the 4th Assessment Report of the Intergovernmental Panel on Climate Change (IPCC), Cambridge University Press, Cambridge.
- IPCC (2007) Climate Change 2007: Synthesis Report. In: Pachauri, R.K. and Reisinger, A., Eds., Contribution of Working Groups I, II and III to the 4th Assessment Report of the Intergovernmental Panel on Climate Change (IPCC), Cambridge University Press, Cambridge.
- IPCC (2007) Climate Change 2007: Mitigation of Climate Change. In: Metz, B., Davidson, O.R., Bosch, P.R., Dave, R. and Meyer, L.A., Eds., Contribution of Working Group III to the 4th Assessment Report of the Intergovernmental Panel on Climate Change (IPCC), Cambridge University Press, Cambridge.
- IPCC (2007) Climate Change 2007: Impacts, Adaptation and Vulnerability. In: Parry, M.L., Canziani, O.F., Palutikof, J.P., van der Linden, P.J. and Hanson, C.E., Eds., Contribution of Working Group II to the 4th Assessment Report of the Intergovernmental Panel on Climate Change (IPCC), Cambridge University Press, Cambridge.
- Brohan, P.,
Kennedy, J.J., Harris, I., Tett, S.F.B. and Jones, P.D. (2006) Uncertainty Estimates
in Regional and Global Observed Temperature Changes: A New Data Set from 1850. Journal
of Geophysical Research: Atmospheres, 111, Article ID: D12106.
http://dx.doi.org/10.1029/2005JD006548 -
Jones, P.D. and Moberg, A. (2003) Hemispheric and Large-Scale Surface Air Temperature
Variations: An Extensive Revision and an Update to 2001. Journal of Cl
http://dx.doi.org/10.1175/1520-0442(2003)016<0206:HALSSA>2.0.CO;2 - Soon, W., Baliunas, S., Posmentier, E.S. and Okeke, P. (2000) Variations of Solar Coronal Hole Area and Terrestrial Lower Tropospheric Air Temperature from 1979 to Mid-1998: Astronomical Forcings of Change in Earth’s Climate? New Astronomy, 4, 563-579. http://dx.doi.org/10.1016/S1384-1076(00)00002-6
- Vinnikov, K.Y. and Grody, N.C. (2003) Global Warming Trend of Mean Tropospheric Temperature Observed by Satellites. Science, 302, 269-272. http://dx.doi.org/10.1126/science.1087910
- Aesawy, A.M. and Hasanean, H.M. (1998) Annual and Seasonal Climatic Analysis of Surface Air Temperature Variations at Six Southern Mediterranean Stations. Theoretical and Applied Climatology, 61, 55-68. http://dx.doi.org/10.1007/s007040050051
-
Kadioglu, M. (1997) Trends in Surface Air Temperature Data over Turkey. International
Journal of Climatology, 17, 511-520.
http://dx.doi.org/10.1002/(SICI)1097-0088(199704)17:5<511::AID-JOC13
0>3.0.CO;2-0 - Smadi, M. (2006) Observed Abrupt Changes in Minimum and Maximum
Temperatures in Jordan in the 20th Century. American Journal of Environmental Sciences,
2, 114-120.
http://dx.doi.org/10.3844/ajessp.2006.114.120 - Al-Fahed, S., Al-Hawaj, O. and Chakroun, W. (1997) The Recent Air Temperature Rise in Kuwait. Renewable Energy, 12, 83-90. http://dx.doi.org/10.1016/S0960-1481(97)00015-3
- ElNesr, M.N., Abu-Zreig,
M.M. and Alazba, A.A. (2010) Temperature Trends and Distribution in the Arabian
Peninsula. American Journal of Environmental Sciences, 6, 191-203.
http://dx.doi.org/10.3844/ajessp.2010.191.203 -
Nasrallah, H. and Balling Jr., R. (1995) Impact of Desertification on Temperature
Trends in the Middle East. Environmental Monitoring and Assessment, 37, 265-271.
http://dx.doi.org/10.1007/BF00546894 -
Hasanean, H. and AL-Khalaf, A. (2012) Variability of Wintertime Surface Air Temperature
over the Kingdom of Saudi Arabia. Atmospheric and Climate Sciences, 2, 307-321.
http://dx.doi.org/10.4236/acs.2012.23028 - Almazroui, M., Islam, M.N., Jones, P.D., Athar, H. and Rahman, M.A. (2012) Recent Climate Change in the Arabian Peninsula: Seasonal Rainfall and Temperature Climatology of Saudi Arabia for 1979-2009. Atmospheric Research, 111, 29-45. http://dx.doi.org/10.1016/j.atmosres.2012.02.013
- Rehman, S. and Al-Hadhrami, L. (2012) Extreme Temperature Trends on the West Coast of Saudi Arabi. Atmospheric and Climate Science, 2, 351-361. http://dx.doi.org/10.4236/acs.2012.23031
- Almazroui, M., Hasanean, H.M., Al-Khalaf, A.K. and Abdel Basset, H. (2013) Detecting Climate Change Signals in Saudi Arabia Using Mean Annual Surface Air Temperatures. Theoretical and Applied Climatology, 113, 585-598. http://dx.doi.org/10.1007/s00704-012-0812-x
- Arabia. In Encyclopedia Britannica. (2009) http://www.britannica.com/EBchecked/topic/31551/Arabia
- Abderrahman, W.A. and Al-Harazin, I.M. (2008) Assessment of Climate Change on Water Resources in the Kingdom of Saudi Arabia. Proceeding of the GCC Environment and Sustainable Development Symposium, Dhahran, 28-30 January 2008, Section D-1: 1-13.
- City Population (2013) Saudi Arabia. http://www.citypopulation.de/SaudiArabia.html
-
Mimish, L. (2012) Electrocardiographic Findings in Heat Stroke and Exhaustion: A
Study on Makkah Pilgrims. Journal of the Saudi Heart Association, 24, 35-39.
http://dx.doi.org/10.1016/j.jsha.2011.08.003 - Khogali, M. (1983) Epidemiology of Heat Illnesses during the Makkah Pilgrimages in Saudi Arabia. International Journal of Epidemiology, 12, 267-273. http://dx.doi.org/10.1093/ije/12.3.267
- Posey, C. (1980) Heat Wave. Weatherwise,
33, 112-116.
http://dx.doi.org/10.1080/00431672.1980.9931900 - Mearns, L.O., Katz, R.W. and Schneider, S.H. (1984) Extreme High-Temperature Events: Changes in Their Probabilities with Changes in Mean Temperature. Journal of Climate and Applied Meteorology, 23, 1601-1613. http://dx.doi.org/10.1175/1520-0450(1984)023<1601:EHTECI>2.0.CO;2
- Almazroui, M., Islam, M.N. and Jones, P.D. (2013) Urbanization Effects on the Air Temperature Rise in Saudi Arabia. Climatic Change, 120, 109-122. http://dx.doi.org/10.1007/s10584-013-0796-2
- Abdou, A.E.A. (2000) Studying the Effect of Internal Consistency on the Objective Analysis. M.Sc. Thesis, Cairo University, Egypt, 118.
- Athar, H. (2012) Decadal Variability of the Observed Daily Temperature in Saudi Arabia during 1979-2008. Atmospheric Science Letters, 13, 244-249. http://dx.doi.org/10.1002/asl.390
- Zhang, X., Aguilar, E., Sensoy, S., Melkonyan, H., Tagiyeva, U., Ahmed, N., et al. (2005) Trends in Middle East Climate Extreme Indices from 1950 to 2003. Journal of Geophysical Research: Atmospheres, 110, Article ID: D22104. http://dx.doi.org/10.1029/2005JD006181
- Theil, H. (1950) A Rank Invariant Method of Linear and Polynomial Regression Analysis, i, ii, iii. Proceedings of the Koninklijke Nederlandse Akademie Wetenschappen, Series A Mathematical Sciences, 53, 386-392, 521-525, 1397-1412.
- Sen, P.K. (1968) Estimates of Regression Coefficient Based on Kendall’s Tau. Journal of the American Statistical Association, 63, 1379-1389.
- Munir, S., Habeebullah, T.M., Seroji, A.R., Gabr, S.S., Mohammed, A.M.F. and Morsy, E.A. (2013) Quantifying Temporal Trends of Atmospheric Pollutants in Makkah (1997-2012). Atmospheric Environment, 77, 647-655. http://dx.doi.org/10.1016/j.atmosenv.2013.05.075
- Thermal Comfort and Heat
Stress Guideline. (2010) University of Ottawa.
http://www.uottawa.ca/services/ehss/documents/heatstress_final_060810_000.pdf - Knowledge Economic City (2014) Knowledge Economic City, A study on the Risks Associated with the Concurrently with the Next Pilgrimage Seasons Summers and Propose Alternatives to Deal with. 88.
- Smoyer-Tomic, K.E. and Rainham, D.G.C. (2001) Beating the Heat: Development and Evaluation of a Canadian Hot Weather-Health Response Plan. Environmental Health Perspectives, 109, 1241-1248.
- Kalkstein, L.S. and Smoyer, K.E. (1993) The Impact of Climate Change on Human Health: Some International Implications. Experientia, 49, 969-979.
- Carslaw, D. and Ropkins, K. (2012) Openair—An R Package for Air Quality Data Analysis. Environmental Modelling & Software, 27-28, 52-61. http://dx.doi.org/10.1016/j.envsoft.2011.09.008
- Almazroui, M., Islam, M.N., Dambul, R. and Jones, P.D. (2014) Trends of Temperature Extremes in Saudi Arabia. International Journal of Climatology, 34, 808-826. http://dx.doi.org/10.1002/joc.3722
- Athar, H. (2014) Trends in Observed Extreme Climate Indices in Saudi Arabia during 1979-2008. International Journal of Climatology, 34, 1561-1574. http://dx.doi.org/10.1002/joc.3783
- Almazroui, M., Islam, M.N., Athar, H., Jones, P.D. and Rahman, M.A. (2012) Recent Climate Change in the Arabian Peninsula: Annual Rainfall and Temperature Analysis of Saudi Arabia for 1978-2009. International Journal of Climatology, 32, 953-966. http://dx.doi.org/10.1002/joc.3446