Atmospheric and Climate Sciences
Vol.4 No.2(2014), Article ID:44731,10 pages DOI:10.4236/acs.2014.42026
Arctic Diurnal Land-Surface Temperature Range Changes Derived by NASA MODIS-Terra and -Aqua 2000 through 2012
Reginald R. Muskett
Geophysical Institute, University of Alaska Fairbanks, Fairbanks, USA
Email: reginald.muskett@gmail.com
Copyright © 2014 by author and Scientific Research Publishing Inc.
This work is licensed under the Creative Commons Attribution International License (CC BY).
http://creativecommons.org/licenses/by/4.0/


Received 27 January 2014; revised 23 February 2014; accepted 3 March 2014
ABSTRACT
The diurnal variation of surface temperature is a fundamental parameter as it is a driver of physical processes of atmosphere-land and -ocean energy and mass cycles playing a key role in meteorology and climatology. Our investigation focus is on the diurnal variation of land-surface temperature derived by the Moderate Resolution Imaging Spectroradiometer (MODIS) deployed on the NASA Terra and Aqua satellites. We key our investigation on the ascending and descending mode equator crossing times for daytime and nighttime land-surface temperature variations from March 2000 through 2010 (MODIS-Terra) and July 2002 through 2012 (MODIS-Aqua) and assess the diurnal land-surface temperature range changes at those sampling times. Our investigation shows non-stationary changes in the trends of land-surface temperature diurnal range. We identify changes in the diurnal range trends linked to increase of daytime and nighttime land-surface temperatures from March 2000 through 2010 and decrease in daytime and nighttime land-surface temperatures from July 2002 through 2012. The most recent decrease in daytime and nighttime land-surface temperatures and diurnal range will affect Arctic and other associated energy and mass cycles.
Keywords:Arctic; Diurnal Range; Land-Surface Temperature; Changes; Trends; MODIS

1. Introduction
The diurnal variation of land-surface temperature is a long-studied parameter of climatology and micrometeorology [1] -[5] . It is important in practical aspects of agriculture, ecosystems and atmosphere-surface energy cycles on land and oceans [3] [4] . It serves as a central focal point in the “global warming” and “climate change” investigations since the 1980s [1] -[5] . Many early studies investigated details and variations of land-surface temperature at site-specific and landscape scales. These were followed in the 1990s by model, re-analysis and simulation studies at the regional to global scales [1] -[5] .
Our investigations have focused on satellite-sensor derived changes and variations of land-surface temperature across the Arctic and its regional terrains, Figure 1 [6] [7] . This our third investigation of the series examines changes and variations of the Arctic diurnal land-surface temperature cycle as sampled by the Moderate Resolution Imaging Spectroradiometer (MODIS) sensors onboard the NASA Terra and Aqua satellites from 2000 through 2012.
2. Data
Building on the lessons learned from the early period of Earth observing satellite missions up to the early 1990’s NASA with international partners in Asia, Europe and South America launched the Earth Observation System (EOS) mission [8] [9] . Growing since 1991 and directed by the NASA Earth-Sun Exploration Division EOS consists of an international array of space science missions, data processing and archiving centers, sensor-design, algorithm development and testing and sub-orbital testing platforms and ground-validation facilities activities. A central theme of NASA EOS was to answer the question, “How is the Earth changing and what are the consequences for life on Earth”.
NASA launched the first satellites of the EOS program, Terra and Aqua in December 1999 and May 2002, respectively [8] [9] . Terra and Aqua in their complementary orbit design and sensor instruments allow for observations at four times during the diurnal cycle of Earth.
Both orbits are sun-synchronous in near polar orientation at 705 km altitude. Terra occupies the AM daytime mode 10:30 local equator crossing time descending and 22:30 (nighttime) local equator crossing time ascending [9] . Aqua occupies the PM daytime mode 13:30 local equator crossing time ascending and 01:30 (nighttime) descending [9] . Both orbits are managed relative to the Worldwide Reference System 2 grid developed for the LANDSAT. Terra and Aqua now orbit the Earth with a fleet of satellites, the “A-Train” [10] . Temporal synchronization to maintain “orbit-station” orbit position and corrections are routinely performed [9] [11] .
The original plan of EOS was to have four satellites carrying MODIS sensors to observe Earth at critical times of the diurnal cycle. US Government budgeting during the 1990s allowed for only two-satellite and sensor configurations to move forward. This necessitated the Terra satellite to put into operational service the MODIS Proto-Flight Model (PFM) sensor that was used the test-bed and benchmarking apparatus. The Aqua satellite was then tasked to put into operational status the MODIS Flight Model 1 (FM1) [8] [9] . The MODIS sensor receives backscatter and upwelling electromagnetic radiation from Earth’s surface and atmosphere in 36 narrow bands from 405 nm (blue) to 2155 nm (infrared) and 1.360 m to 14.385 m (thermal). Both PFM and FM1 sensors have pointing accuracy and on-orbit radiance calibrations performed on a monthly basis since the launches of Terra and Aqua, respectively [8] [11] . Land-surface temperature in Kelvin units is estimated by MODIS through a retrieval algorithm [8] [10] -[14] . The algorithm is based on a “split-window”, i.e. two-channel ratio utilizes day/night thermal emission and emissivity in the 10.78 to 11.28 m and 11.77 to 12.27 m bands [12] . Using input data from the Level 1B and Level 2 swath products and quality controls the Level 3 products are produced in a processing chain. Cloud-cover detection routines to admit only “clear-sky” emissions are part of the Level 1B processing chain. Corrections for Atmosphere column water vapor, boundary level temperatures and off-zenith-angle pointing are corrected during the Level 1B, 2 and 3 processing chains [8] [12] -[14] .
Our principle data sources are the MOD11A1 (Terra) and MYD11AI (Aqua) Level-3 Version 5 datasets. These are in HDF-EOS format and data structure. The land-surface temperature data layer constitute 5-by-5 degree granule at 1-km posting sinusoidal grid [8] . Nighttime (AM and PM) temperatures with the highest quality flag (most reliable) beginning on 5 March 2000 (Terra) and 8 July 2002 (Aqua) are extracted for investigation. The retrieval accuracy of land-surface temperature has been quantified at the 1-Kelvin level [13] -[16] .
Eighty-one 5-by-5 degree granule files cover the northern hemisphere from 40˚N each 24-hour day. From the 100s of thousands of granule files filling the decadal ranges of MODIS Terra and Aqua operations we extract the daytime and nighttime land-surface temperature sinusoidal grids at 1-km posting [6] [7] . We first mosaic these into daily northern hemisphere sinusoidal grid coverage. We next re-project the mosaics into north-stereographic projection using the World Geodetic System reference ellipsoid WGS-84 relative to the International Terrestrial Reference Frame.
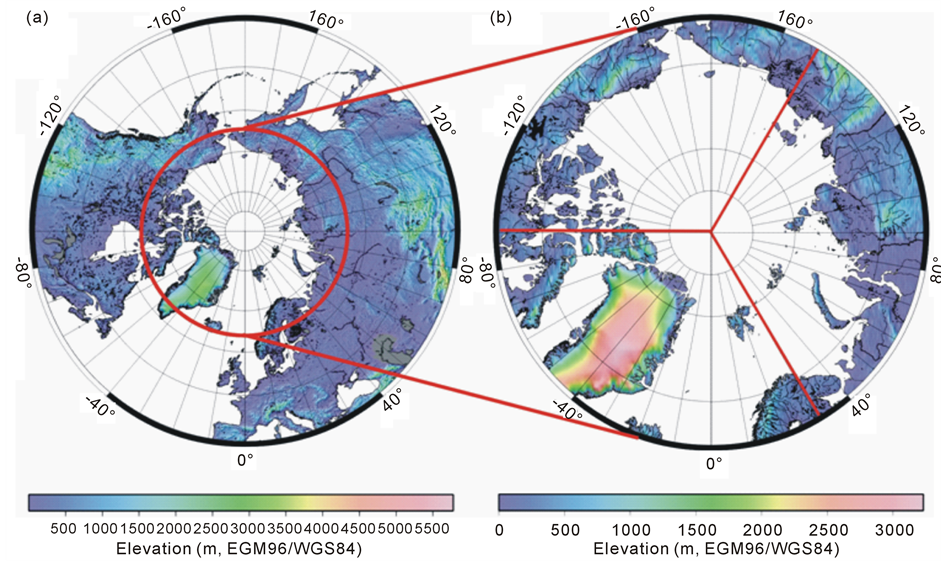
Figure 1. (a) Regions of interest on the northern hemisphere, Arctic Circle in red; (b) Arctic region and 120 degree sector areas of interest. Sectors: Eurasia (Central East), Eastern Russia—Western North America (Northwest), Eastern North America—Western Europe (Southwest). The Altimetry Corrected Elevation DEM 2 (ACE2) provides elevations (http://tethys.eaprs.cse.dmu.ac.uk/ACE2/).
3. Results
Our investigation assesses the changes in the diurnal land-surface temperature at 1-km postings as sampled by MODIS Terra at local 10:30 and 22:30 equator crossing times and MODIS-Aqua at local 13:30 and 01:30 equator crossing times for the decade ranges from March 2000 through 2010 and July 2002 through 2012, respectively. Our assessments are within 65˚N and high latitudes (Arctic) and three 120˚ azimuth sectors for Eurasia, Eastern Russia—Western North America and Eastern North America—Western Europe shown in Figure 1. The results of the assessment in the form of ANOVA regressions and statistics on daily and monthly intervals are illustrated in Figure 3 through Figure 5 and decadal trends summarized in Table 1.
Figure 2 illustrates an example of land-surface temperature (Kelvin) and difference (Kelvin) grids for Julian Day 273 (September 30) 2002 at 10:30 (daytime) and 22:30 (nighttime) local equator crossing time for MODISTerra (MOD) and at 13:30 (daytime) and 01:30 (nighttime) local equator crossing time for MODIS-Aqua (MYD). The difference grids MOD Diff and MYD Diff illustrate the diurnal land-surface temperature hour range under clear-sky conditions at 10:30 to 22:30 and at 01:30 to 13:30, respectively. Our differencing convention is to subtract the nighttime temperature from the daytime temperature for both diurnal hour ranges. Importantly, the diurnal hour land-surface temperature range changes are different for 2002 273 as shown, and for each day of each year and through each decade. We will use the Celsius unit for the remainder of our assessment.
Figure 3 illustrates the regression of MODIS-Terra and MODIS-Aqua relative to the local equator crossing times, daytime and nighttime at the beginning and ending years of the decadal ranges, March 2000 through 2001 and July 2002 through 2012, respectively. The 1:1 line allows us to assess the magnitude of the offset. The offsets favor the upper-left half, daytime relative to the local equator crossing time of land-surface temperature. Variations in the magnitude of the offset and the spread of the regression distributions are noticeable relative to the regions of interest. This is a function of the components of the terrain, i.e. dense or open forests, tundra, elevation and for the North America—Western Europe sector containing the Greenland ice sheet whose elevations are in excess of 3 kilometers (Figure 1).
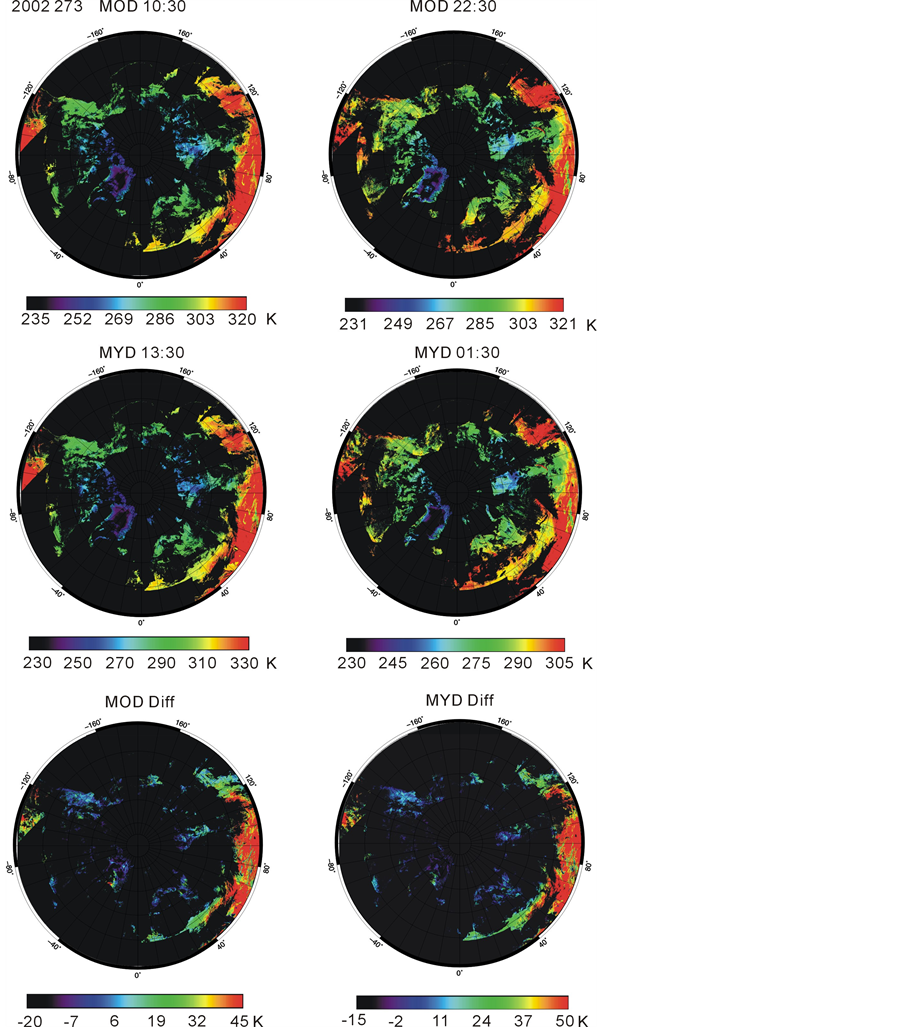
Figure 2. MODIS-Terra (MOD) and MODIS-Aqua (MYD) land-surface temperature (Kelvin) grids, north stereographic projection, WGS-84 ellipsoid reference, 2002 Julian Day 273 (September 30). Local equator crossing times given for both satellites. Lower most grids show land-surface temperature differences (Diff), daytime minus nighttime.
Figure 4 and Figure 5 illustrate on a calendar month basis the diurnal hour land-surface temperature range changes from March 2000 through 2010 for MODIS-Terra (Figure 4) and from July 2002 through 2012 from MODIS-Aqua (Figure 5) within the regions of interest: Arctic (A), and the Arctic sectors Eurasia (B), Eastern Russia—Western North America (C) and Eastern North America—Western Europe (D). The diurnal hour range changes as illustrated are non-stationary. Magnitudes of the range changes are mostly small, within ±1˚C, though some month’s changes can be relatively large such as −3˚C for MODIS-Aqua from March 2002 through
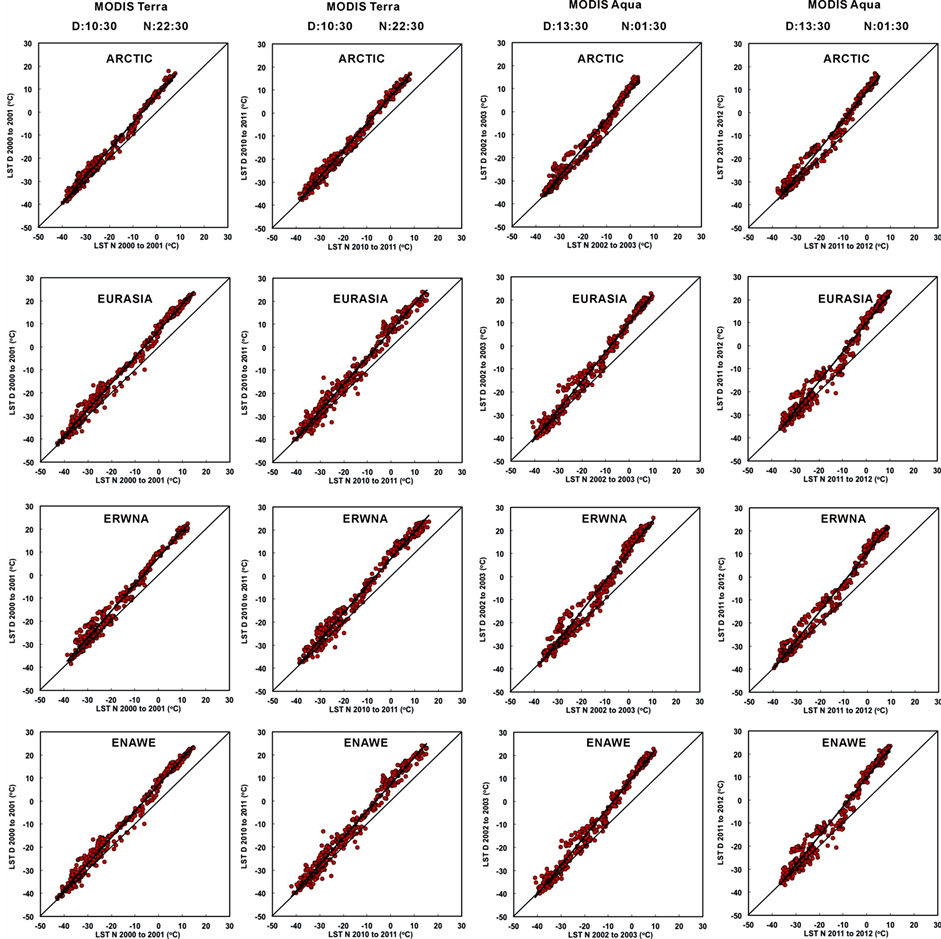
Figure 3. Regressions of MODIS-Terra and MODIS-Aqua daytime relative nighttime land-surface temperature (Celsius) in the decades March 2000 through 2010 and July 2002 through 2012 within the Arctic and Arctic sectors, respectively.
2012 in Eastern North America—Western Europe sector (Figure 5(d)). The diurnal hour range 10:30 to 22:30 (MODIS-Terra) in the Arctic region shows 6 months positive, 5 months negative and one month near zero suggesting overall range expansion, on average (Figure 4(a)). The diurnal hour range 01:30 to 13:30 (MODISAqua) in the Arctic region show 7 months negative and 5 months positive suggesting overall range contraction, on average (Figure 5(a)).
An interesting contrast of the monthly diurnal hour range changes in the Arctic Eastern North America— Western Europe sector is noticeable, Figure 4(d) (MODIS-Terra 10:30 to 22:30) and Figure 5(d) (MODISAqua 01:30 to 13:30). MODIS-Terra shows 7 months positive, 2 months negative and one month near zero, on average. The polarity of March 2000 is negative whereas March 2010 is positive, suggesting a decadal trend. MODIS-Aqua shows 10 months negative, one month positive and one month near zero, on average. The polarity of July 2002 is negative as in July 2012 has a greater negative value, suggesting a decadal trend. We will further analyze the meaning of the sign of the range change in the discussion.

Table 1. Changes of arctic land-surface temperature diurnal hour ranges.
DHR = Diurnal Hour Range, YR = Year Range, DHTR = Diurnal Hour LST Range Change, STD = Standard Deviation, SE = Standard Error, P-V = Probability-Value. Sectors are shown in Figure 1.
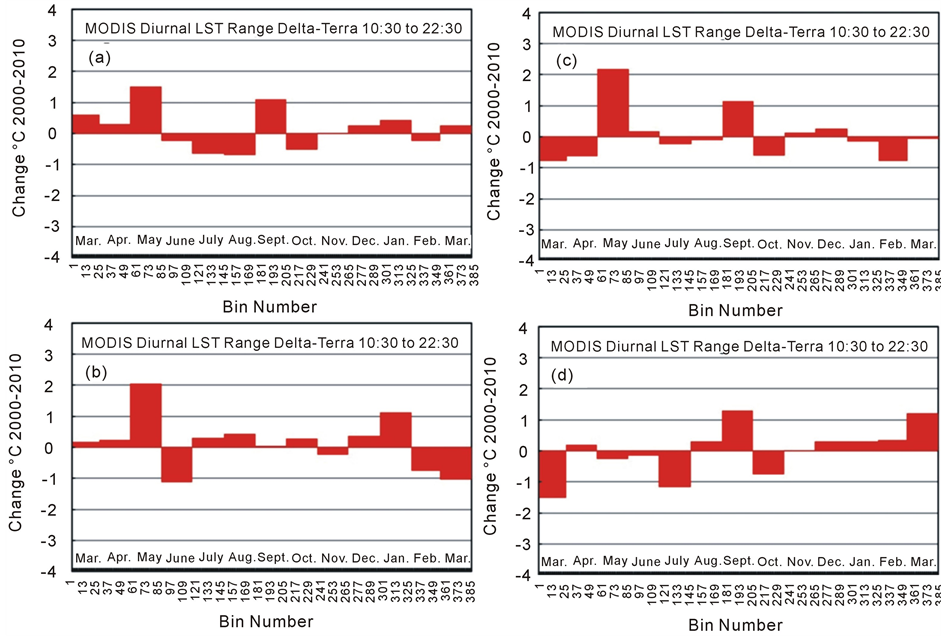
Figure 4. MODIS-Terra monthly diurnal hour land-surface temperature range delta (i.e. changes) for the March 2000 through 2010. (a) Arctic; (b) Eurasia; (c) Eastern Russia—Western North America; (d) Eastern North America—Western Europe.
Table 1 presents the trends of the diurnal hour land-surface temperature range changes and statistics in the Arctic and sectors as derived by MODIS-Terra and MODIS-Aqua in the decades March 2000 through 2010 and July 2002 through 2012, respectively. During the MODIS-Terra decade the trend of the diurnal hour temperature range is +0.2˚C with a standard error of 0.1˚C and significant P-value in the Arctic. During the MODIS-Aqua decade the trend of the diurnal hour temperature range change is −0.1˚C with a standard error of 0.1˚C and a
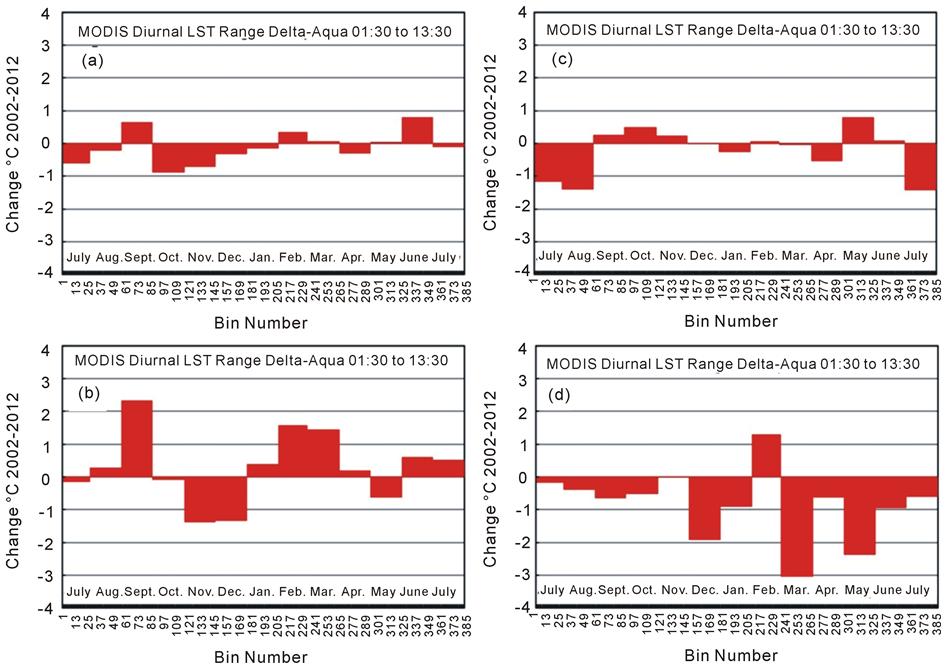
Figure 5. MODIS-Aqua monthly diurnal hour land-surface temperature range delta (i.e. changes) for the July 2002 through 2012. (a) Arctic; (b) Eurasia; (c) Eastern Russia—Western North America; (d) Eastern North America—Western Europe.
significant P-value in the Arctic.
The Arctic sectors show interesting contrast in the decade trends (Table 1). During the MODIS-Terra decade the Arctic Eurasia sector shows a trend of +0.1˚C with standard error 0.1˚C (significant P-value), and which shows increase in the MODIS-Aqua decade at +0.3˚C with standard error 0.2 (significant P-value). The Arctic Eastern Russia—Western North America sector shows a trend of +0.1˚C with standard error 0.1˚C (significant P-value) during the MODIS-Terra decade and shows a trend of −0.1˚C with standard error 0.1˚C (significant P-value) during the MODIS-Aqua decade. The Arctic Eastern North America – Western Europe sector shows a trend of +0.0˚C with standard error 0.1˚C (significant P-value) during the MODIS-Terra decade and shows a trend of −0.9˚C with standard error 0.2˚C (significant P-value) during the MODIS-Aqua decade. The interpretation of the sign changes (i.e. polarity) of the trends of the diurnal hour range changes will be examined in the next section.
4. Discussion
Interpretation of the meaning the sign of the diurnal hour change can have ambiguity because we have two different ranges, 10:30 to 22:30 (MODIS-Terra) and 01:30 to 13:30 (MODIS-Aqua) and two different decades March 2000 through 2010 and July 2002 through 2012. To resolve the ambiguity of interpretation of the sign we will draw from our research on Arctic daytime and nighttime trends of land-surface temperature changes [6] [7] .
4.1. Arctic Region
Arctic daytime 10:30 and 13:30 local equator crossing times show increases of 2.1˚C ± 0.2˚C (MODIS-Terra) and 0.1˚C ± 0.2˚C (MODIS-Aqua), on average over their decadal ranges [6] . Arctic nighttime 22:30 and 01:30 local equator crossing times show increases of 1.8˚C ± 0.3˚C (MODIS-Terra) and 0.2˚C ± 0.2˚C (MODIS-Aqua), on average over their decadal ranges [7] . This indicates that the decadal diurnal hour land-surface temperature range change of MODIS-Terra +0.2˚C ± 0.1˚C is from an increase of daytime temperatures. The decadal diurnal hour land-surface temperature range change of MODIS-Aqua −0.1˚C ± 0.1˚C is from the slight increase of the MODIS-Aqua nighttime temperature.
4.2. Arctic Eurasia Sector
Arctic Eurasia daytime 10:30 and 13:30 local equator crossing times show increase of 1.7˚C ± 0.3˚C (MODISTerra) and 2.8˚C ± 0.3˚C (MODIS-Aqua), on average over their decadal ranges [6] . Nighttime 22:30 and 01:30 local equator crossing times show increases of 2.0˚C ± 0.3˚C (MODIS-Terra) and 2.3˚C ± 0.3˚C (MODIS-Aqua), on average over their decade ranges [7] . This indicates that the decadal diurnal hour land-surface temperature range change of MODIS-Terra +0.1˚C ± 0.1˚C is from an increase of the nighttime temperature. The decadal diurnal hour land-surface temperature range change of MODIS-Aqua +0.3˚C ± 0.2˚C is from an increase of the daytime temperature.
4.3. Arctic Eastern Russia—Western North America Sector
Arctic Eastern Russia—Western North America daytime 10:30 and 13:30 local equator crossing times show increase of 1.9˚C ± 0.2˚C (MODIS-Terra) and decrease of 1.5˚C ± 0.2˚C (MODIS-Aqua), on average over their decadal ranges [6] . Nighttime 22:30 and 01:30 local equator crossing times show an increase trend of 1.6˚C ± 0.2˚C (MODIS-Terra) and decrease of 1.3˚C ± 0.2˚C (MODIS-Aqua), on average over their decade ranges [7] . This indicates that the decadal diurnal hour land-surface temperature range change of MODIS-Terra +0.1˚C ± 0.1˚C is from an increase of the daytime temperature. The decadal diurnal hour land-surface temperature range change of MODIS-Aqua −0.1˚C ± 0.1˚C is from a decrease daytime and nighttime temperature.
4.4. Arctic Eastern North America—Western Europe Sector
Arctic Eastern North America—Western Europe daytime 10:30 and 13:30 local equator crossing times show increases of 2.5˚C ± 0.3˚C (MODIS-Terra) and decrease trend of 1.5˚C ± 0.3˚C (MODIS-Aqua), on average over their decadal ranges [6] . Nighttime 22:30 and 01:30 local equator crossing times show an increase of 0.6˚C ± 0.3˚C (MODIS-Terra) and decrease of 2.1˚C ± 0.3˚C (MODIS-Aqua), on average over their decade ranges [7] . This indicates that the decadal diurnal hour land-surface temperature range change of MODIS-Terra +0.0˚C ± 0.1˚C is from an increase of the daytime temperature and nominal increase in the nighttime temperature. The decadal diurnal hour land-surface temperature range change of MODIS-Aqua −0.9˚C ± 0.2˚C is from a decrease of daytime and strongly decrease nighttime temperature. The decrease of both daytime and nighttime land-surface temperatures derived by MODIS-Aqua from July 2002 through 2012 is in contrast to those of MODISTerra, increasing from March 2000 through 2010. This is a non-stationary characteristic and is an outcome of the spatial and temporal variations of the forcing and feedback parameters of solar irradiance, atmospheric re-radiance and terrain [17] -[24] .
5. Conclusion
Our research investigates the changes and variations of the Arctic diurnal land-surface temperatures as derived by the MODIS sensors onboard the NASA Terra and Aqua satellites from March 2000 through 2010 and July 2002 through 2012, respectively. We use the local equator crossing times of the satellites in both ascending and descending mode, 10:30 (daytime) and 22:30 (nighttime) MODIS-Terra and 13:30 (daytime) and 01:30 (nighttime) MODIS-Aqua to formulate diurnal hour ranges. Our analysis indicates the diurnal ranges of land-surface temperature are changing. The most pronounced changes are due to decreasing nighttime temperatures particularly in the July 2002 through 2012 decade (MODIS-Aqua) and increasing daytime temperatures in the March 2000 through 2010 decade (MODIS-Terra). The changes of land-surface temperature across the Arctic and within 120˚ sectors exemplify terrain effects and non-stationary characteristics of the decadal time series. In particular the most recent decrease in daytime and nighttime land-surface temperatures and trends and the diurnal range will affect Arctic and other associated energy and mass cycles and physical systems that depend upon them.
Acknowledgements
I thank Dr. Vladimir E. Romanovsky, Geophysical Institute University of Alaska Fairbanks (UAF) who supported this research through grants from the National Science Foundation awards #0856864 and AON Development of Sustainable Observation of Thermal State of Permafrost in North America and Russia: The US Contribution to the Global Terrestrial Network for Permafrost and grants through the Scenarios Network for Alaska (UAF), the Arctic and Western Alaska Landscape Conservation Cooperatives and the USGS Alaska Climate Science Center. We thank the National Aeronautics and Space Agency Goddard Flight Center and the US Geological Survey Land Processes Distributed Active Archive Center for providing the MODIS datasets. I extend thanks the UAF Arctic Region Supercomputing Center for computational facilities assistance and the Geophysical Institute for support. I thank the European Space Agency and the Altimetry Corrected Elevation 2 Team at the EAPRS Laboratory, Faculty of Technology, De Montifort University, UK, for providing the ACE2 DEM. During this 5-year research effort exploring multiple Terabytes of datasets from the MODIS sensors on NASA Terra and Aqua satellites I made extensive use of The Generic Mapping Tools (Dr. P. Wessel, School of Ocean and Earth Science and Technology, University of Hawaii at Mānoa, Dr. W.H.F. Smith and Dr. R. Scharroo, NOAA Satellite Oceanography and Climatology Division, Dr. J. Luis, Universidade do Algarve and Dr. Florian Wobbe, Alfred Wegener Institute), ENVI/IDL and MATLab on several Linux (Fedora, Open SuSE and Red Hat) computers, and to which I extend many thanks.
References
- Karl, T.R., Jones, P.D., Knight, R.W., Kukla, G., Plummer, N., Razuvayev, V., Gallo, K.P., Lindseay, J., Carlson, R.J. and Peterson, T.C. (1993) Asymmetric Trends of Daily Maximum and Minimum Temperature. Bulletin of the American Meteorology Society, 74, 1007-1023. http://dx.doi.org/10.1175/1520-0477(1993)074<1007:ANPORG>2.0.CO;2
- Peterson, T.C. and Vose, R.S. (1997) An Overview of the Global Historical Climatology Network Temperature Data Base. Bulletin of the American Meteorology Society, 78, 2837-2849. http://dx.doi.org/10.1175/1520-0477(1997)078<2837:AOOTGH>2.0.CO;2
- Phillips, C.L., Gregg, J.W. and Wilson, J.K. (2011) Reduced Diurnal Temperature Range Does Not Change Warming Impacts on Ecosystem Carbon Balance of Mediterranean Grassland Mesocosms. Global Change Biology, 17, 3263- 3273. http://dx.doi.org/10.1111/j.1365-2486.2011.02483.x
- Kawi, Y. and Wada, A. (2007) Diurnal Sea Surface Temperature Variation and Its Impact on the Atmosphere and Ocean: A Review. Journal of Oceanography, 63, 721-744. http://dx.doi.org/10.1007/s10872-007-0063-0
- Vose, R.S., Easterling, D.R. and Gleason, B. (2005) Maximum and Minimum Temperature Trends for the Globe: An Update through 2004. Geophysical Research Letters, 32. http://dx.doi.org/10.1029/2005GL024379
- Muskett, R.R. (2013) MODIS-Derived Arctic Land-Surface Temperature Trends. Atmospheric and Climate Science, 3, 55-60. http://dx.doi.org/10.4236/acs.2013.31008
- Muskett, R.R. (2014) MODIS-Derived Nighttime Arctic Land-Surface Temperature Trends and Non-Stationary Changes. Journal of American Climate Change, Accepted January.
- Wan, Z. (1999) MODIS Land-Surface Temperature Algorithm Theoretical Basis Document (LST ATBD). Version 3.3, National Aeronautics and Space US Department of Commerce, Washington DC.
- Xiong, X.X., Chiang, K.F., Wu, A.S., Barnes, W.L., Guenther, B. and Salomonson, V.V. (2008) Multiyear On-Orbit Calibration and Performance of Terra MODIS Thermal Emissive Bands. IEEE Transaction on Geoscience and Remote Sensing, 46, 1790-1803. http://dx.doi.org/10.1109/TGRS.2008.916217
- Parkinson, C.L., Ward, A. and King, M.D. (2006) Earth Science Reference Handbook: A Guide to NASA’s Earth Science Program and Earth Observing Satellite Missions. In: Parkinson, C.L., Ward, A. and King, M.D., Eds., Earth Science Reference Handbook, National Aeronautics and Space Administration, US Department of Commerce, Washington DC, 1-6, 73-88, 225-227.
- L’Ecuyer, T.S. and Jiang, J.H. (2010) Touring the Atmosphere aboard the A-Train. Physics Today, 63, 36-41.
- Xiong, X.X., Sun, J.Q. and Barnes, W. (2008). Intercomparison of On-Orbit Calibration Consistency between Terra and Aqua MODIS Reflective Solar Bands Using the Moon. IEEE Geoscience and Remote Sensing Letters, 5, 778-782. http://dx.doi.org/10.1109/LGRS.2008.2005591
- Wan, Z. (2008) New Refinements and Validation of MODIS Land-Surface Temperature/Emissivity Products. Remote Sensing Environment, 112, 59-74. http://dx.doi.org/10.1016/j.rse.2006.06.026
- Coll, C., Wan, Z. and Galve, G.M. (2009) Temperature-Based and Radiance-Based Validations of the V5 MODIS Land Surface Temperature Product. Journal of Geophysical Research, 114, Article ID: D20102.
- Wang, W., Liang, S. and Meyers, T. (2008) Validating MODIS Land Surface Temperature Products Using Long-Term Nighttime Ground Measurements. Remote Sensing Environment, 112, 623-635. http://dx.doi.org/10.1016/j.rse.2007.05.024
- Hall, D.K., Box, J.E., Casey, K.A., Hook, S.J., Shuman, C.A. and Steffen, K. (2008) Comparison of Satellite-Derived and In-Situ Observations of Ice And Snow Surface Temperatures over Greenland. Remote Sensing Environment, 112, 3739-3749. http://dx.doi.org/10.1016/j.rse.2008.05.007
- Mannstein, H. (1987) Surface Energy Budget, Surface Temperature and Thermal Inertia. In: Vaughan, R.A. and Reidel, D., Eds., Remote Sensing Applications in Meteorology and Climatology, NATO ASI Series C, Mathematical and Physical Sciences, Vol. 201, Reidel Publishing Co., Dordrecht, 391-410.
- Usoskin, I.G. (2008) A History of Solar Activity over Millennia. Living Reviews in Solar Physics, 5, 1-88. http://www.livingreviews.org/lrsp-2008-3
- Stephenson, F.R. and Wolfendale, A.W. (1988) Secular Solar and Geomagnetic Variations in the Last 10,000 Years. In: Stephenson, F.R. and Wolfendale, A.W., Eds., NATO ASI Series C, Mathematical and Physical Sciences, Vol. 236, Kluwer Academic Publishers, Springer, New York.
- Soon, W.W.-H. (2009) Solar Arctic-Mediated Climate Variation on Multidecadal to Centennial Timescales: Empirical Evidence, Mechanistic Explanations, and Testable Consequences. Physical Geography, 30, 144-184. http://dx.doi.org/10.2747/0272-3646.30.2.144
- Soon, W.W.-H. (2005) Variable Solar Irradiance as a Plausible Agent for Multidecadal Variations in the Arctic-Wide Surface Air Temperature Record of the Past 130 Years. Geophysical Research Letters, 32, Article ID: L16712.
- Dobrovolski, S.G. (2000) Stochastic Climate Theory, Models and Applications. Springer-Verlag, Berlin. http://dx.doi.org/10.1007/978-3-662-04119-2
- Rowland, J.C., Jones, C.E., Altmann, G., Bryan, R., Crosby, B.T., Geernaert, G.L., Hinzman, L.D., Kane, D.L., Lawrence, D.M., Mancino, A., Marsh, P., McNamara, J.P., Romanovsky, V.E., Toniolo, H., Travis, B.J., Trochim, E. and Wilson, C.J. (2010) Arctic Landscapes in Transition: Responses to Thawing Permafrost. EOS Transactions of The American Geophysical Union, 91, 229. http://dx.doi.org/10.1029/2010EO260001
- Jorgenson, M.T., Romanovsky, V.E., Harden, J., Shur Y. L., O’Donnell, J., Schuur, T. and Kanevskiy, M. (2010) Resilience and Vulnerability of Permafrost to Climate Change. Canadian Journal of Forest Research, 40, 1219-1236. http://dx.doi.org/10.1139/X10-060