Atmospheric and Climate Sciences
Vol. 2 No. 3 (2012) , Article ID: 21403 , 7 pages DOI:10.4236/acs.2012.23033
Pollution Scenarios through Atmospheric Dispersion Modelling Based on Real Measurements of Selected Urban Areas in Abu Dhabi, UAE
National Energy and Water Research Center, Abu Dhabi Water and Electricity Authority, Abu Dhabi, UAE
Email: eakatheeri@adwea.ae
Received March 15, 2012; revised April 16, 2012; accepted April 26, 2012
Keywords: Power Plant; Sulfur Dioxide; Nitrogen Oxides; Emissions
ABSTRACT
Power requirements in the city of Al Mirfa in western Abu Dhabi are covered by the Al Mirfa Power and Distillation Plant. Comprehensive emission inventories for 2007-2008 were used to execute an ENVIMAN (OPSIS AB Company, Sweden) Gaussian dispersion model to predict ambient ground level concentrations of nitrogen oxides (NOx), carbon monoxide (CO), particulate matter (PM10) and sulfur dioxide (SO2) at selected receptors considering all emission sources located in the area. Two years of meteorological data was used in conjunction with the dispersion model to compute NOx and SO2 levels in and around the power plant. To validate the model, computed results were compared with the average values measured at a fixed Air Quality Station in Al Mirfa city. The highest hourly, daily and annual ground level concentrations under exiting meteorological conditions were then analyzed. The computed results for the study area revealed that daily, hourly and annual concentration values did not exceed the Federal Environment Agency (FEA) standard, and the contribution of plant emissions to the ground levels pollutants in the surrounded area range from 3.1 to 109 μg/m3 for NO2, and 1.1 to 41.4 μg/m3 for CO. This study can be considered a baseline study for any future expansion in the plant. Based on these results, mitigation strategies are not required.
1. Introduction
Desalination and power generation plants produce varying emissions to the surrounding atmosphere that may adversely impact air quality and cause air pollution in the vicinity of the plants. Studies using regional atmospheric models [1,2] tend to reveal concentration patterns of pollutants emitted from power plants that are centered over the source of emissions and have substantial health impacts over a large geographic range. Many studies conducted in the United States and Europe has demonstrated that emissions from power plants in compliance with national standards result in health impacts on nearby populations [3]. The impact of an industry will vary according to particular conditions in the area (e.g. pollutant emission rates, meteorological parameters and surrounding characteristics). The health impact of air pollution depends on the pollutant type, its concentration in the air, length of exposure, other pollutants in the air, and individual susceptibility. These factors, in addition to other anthropogenic activities, have increased the levels of hazardous air pollutants such as carbon monoxide, nitrogen oxides, sulfur dioxide, hydrogen sulfide, ozone, hydrocarbons, chlorofluorocarbons, lead and other particulate materials. In the United Arab Emirates (UAE), the generation of electricity and water desalination are considered the primary energy-consuming sub-sectors of the industrial sector, followed by other energy intensive industries such as the production of building materials, aluminium, fertilizers, and pharmaceutical industries [4]. Abu Dhabi is the largest of the seven emirates that comprise the UAE. With the growth of the country, Abu Dhabi has undergone remarkable development in many aspects over the past 40 years, and there has been a significant demand for new cogeneration plants for power and water production. Economic growth, population growth, and urbanization are the main parameters that have contributed to the high-energy consumption in the country. Among the above contributors, economic growth and higher urbanization have the greatest influence on annual energy consumption, which has ranged from as low as 9 TOE (Tonnes of Oil Equivalent)/capita to as high as 18 TOE/capita over the 23-year period (1980 to 2003) [4]. The UAE has an electricity production capacity of 18.747 GW (gigawatts), which is constrained by a lack of spare capacity during peak times. More than 90% of the electricity production is fuelled by natural gas. The air quality in Abu Dhabi is generally good, and the air quality standards are met. The concentrations of benzene and carbon monoxide are well below the relevant standards, as are the hourly and daily concentrations of NO2 and SO2 [5]. This study can be considered a baseline study for any future expansion in the plant where based on these results, mitigation strategies are not required.
Description of the Study Area
Al Mirfa is a coastal town on the Arabian Gulf located in the western part of Abu Dhabi. The population of Al Mirfa and the neighbouring areas is estimated at 15,000. The region is predominantly composed of one and two story buildings, and is surrounded by open desert with no critical obstacles affecting plume transport and diffusion which need to be incorporated into the modelling analysis. The plant is located about 4 km upwind of town, and is equipped with four gas turbines that each has a capacity of 48 MW. The facility also has a distillation plant with a maximum capacity of 37.7 million gallons per day (MGD). The distillation plant runs continuously on natural gas and occasionally on diesel. In 2008, the plant burned 18,090 MSCf of gas and 14,238 gallons of diesel [6]. The major air pollution emission sources in the Al Mirfa region are the stationary sources of the power plant stacks. The plant consists of 12 stacks with an average height of 60 m from the ground level .The area under investigation was defined prior to the modelling process. Four receptors locations considered to require specific references in the air dispersion modelling study were identified as presented in Figure 1, include the accommodation camp and local facilities (1), private palace (2), residential villas (3) and Al Mirfa Hotel (4).
2. Model Details
ENVIMAN is a combination of the dispersion models
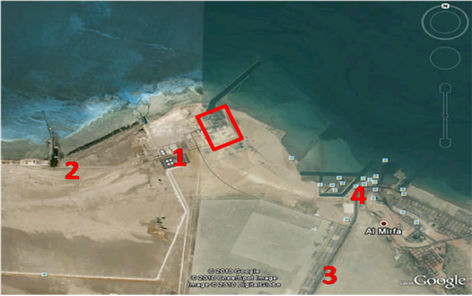
Figure 1. Location map of the study area and the receptor locations.
AERMOD and OSPM. AERMOD is a Gaussian dispersion model provided by the United States Environmental Protection Agency. OPSIS has modified the AERMOD model to fit the emission database structure and meteorology. The altered model can calculate the dispersion over an area using average climatological data, or the dispersion between specific dates using the actual meteorological data for these dates with an hourly resolution. The model is a flat 2-dimensional model. This means that topography is not considered, but the height of the emission source is taken into consideration. This model is based on the Geographic Information System (GIS) and was developed for air quality surveillance. The model consists of integrated tools for emission database development and dispersion modelling. The model requires the following input data:
·Source information: Source coordinates emission rate, stack height and diameter, flue temperature and velocity;
·Meteorological information: The meteorological data includes wind speed and direction, ambient air temperature, solar radiation and atmospheric pressure.
3. Meteorological Data
Meteorological conditions play a major role in defining air quality in an area by dispersing and dissipating pollutants or by aggravating air quality through the buildup of concentrations. As a result, the ground level concentration of pollutants depends on the meteorological conditions in the surrounding areas. The metrological parameters expected to affect the concentration of pollutants such as NOx and SO2 are wind speed and direction, mixing height, ambient temperature and inversion layer [7-10]. High wind speed is responsible for the effective ventilation of the air basin under specific conditions (no thermal inversion). Conversely, severe temperature inversion is associated with the high concentration of pollutants [10]. When the wind speed reaches its highest level, it helps to reduce the concentration of air pollutants, thereby reducing their hazardous effects. Conversely, slow wind or calm conditions can lead to a buildup of contaminants in the immediate vicinity of the sources [7]. Abu Dhabi has a tropical, semiarid climate, with hot summers, warm winters, and scant rainfall. The weather is sunny for most of the year, with high temperatures reach up to 50˚C during summer and pleasant temperatures in the winter months, with an average of 21˚C; however, the temperature can drop to single digits at night. The relative humidity during summer is very high, especially in coastal areas with an average of 76.33%. Two types of winds prevail in the emirate, dry northerly winds in winter, which help to ameliorate the weather, and brief, extremely hot, south easterly winds in summer. Non-seasonal southerly to south easterly and westerly to north westerly or northerly winds occasionally flow across the emirate. In Al Mirfa, the predominant climatic condition can be described as hot, dry and sunny during summer, while it is mild and humid in winter, with occasional rain. In addition, the temperature may fall to 6.4˚C during the night in winter. Summer extends from 21 June to 20 September, during which time the climate is hot and dry. During 2007 and 2008, the temperature in summer ranged from 35.09˚C to 45.27˚C, with a mean of 33.52˚C. The relative humidity typically increases to above 90% during summer. The recoded value during the study period reached a minimum of 6.8% in May, 2008 and a maximum of 98.8% in January2007. The lowest humidity occurred during the afternoon, whereas the maximum value was recorded during early morning. The prevailing wind direction was northwest (NW) year round. There were no observable changes in wind direction seasonally (Figure 2).
4. Emission Inventory
Emission data is calculated using the United States EPA Emission Factor based on gas turbine capacity and fuel consumption data provided by the Al Mirfa plant. Table 1 summarizes the input data received from the plant [11] and the calculated emission quantities. Fluctuations in electricity production based on the monthly demand were
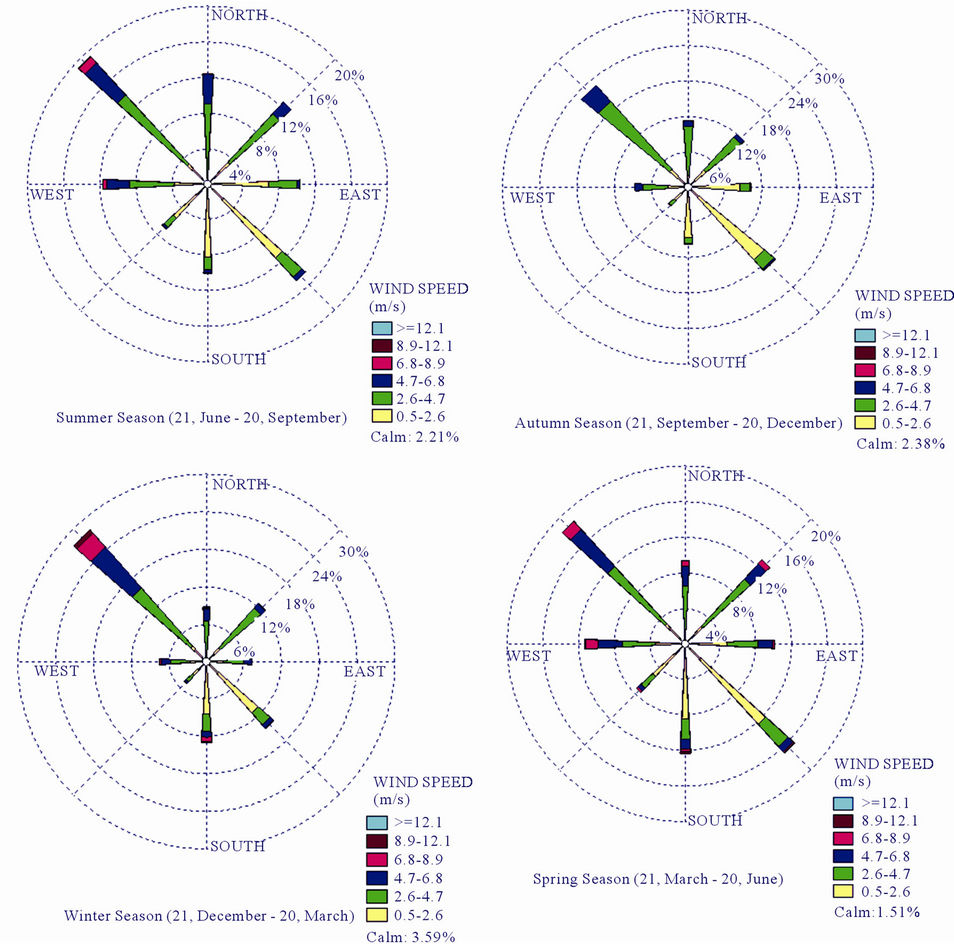
Figure 2. Seasonal wind in Al Mirfa during 2007 and 2008.
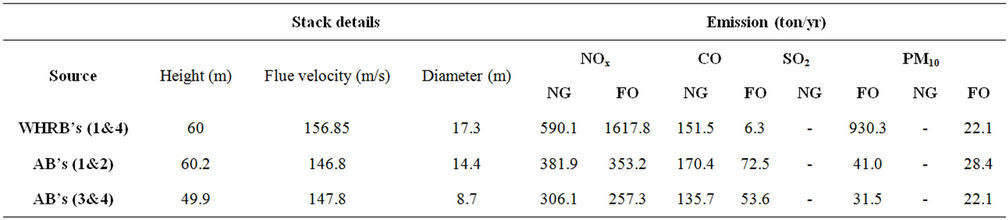
Table 1. Sources parameters input into the models—Natural Gas (NG) and Fuel Oil (FO).
also considered. The modelling approach followed in this study includes collecting the required physical data and site survey to investigate the area. Evaluation based on the Good Engineering Practice Stack Height (GEP) analysis [12] revealed that there were no buildings of significant size and proximity to the sources of emissions that needed to be included in the analysis. The pollutants considered for the study were NOx/NO2, CO, PM10 and SO2. The ENVIMAN dispersion models do not include specific chemical reaction schemes for NOx to NO2 conversion. Thus, it was assumed that the plant is operating at full load and the oxidation percentage of NOx to NO2 was determined using a conversion proposed by the USEPA for permit modelling [13]. This method incorporates a three tier screening assessment approach, in which Tier 2 assumes that the ratio between NOx and NO2 is 75% and was considered the most appropriate for the study.
5. Results and Discussion
Monthly natural gas consumption in Al Mirfa from 2007 to 2008 is presented in Figure 3 [6]. In 2008, the Al Mirfa plant recorded a 21% increase when compared with 2007. The emission rates of SO2 and NOx show that the highest overall consumption of fuel was during summer because of the heavy load in this period, while the lowest was obtained during winter. The highest emission rate of SO2 reported was 138 g/s in August, while the lowest values of 217 g/s were recorded in January.
5.1. Model and Measurement Comparisons
The ENVIMAN (OPSIS) model software was run based on the emissions from Al Mirfa power plant stacks using a selected mesh area of 12 Km × 12 Km with 2500 grid cells. The mesh coordinates, which are defined in terms of the Xand Y-axis, contain the selected source and receptors location. Plume depletion (dry or wet) was not used. To understand the combined uncertainty associated with the data and modelling, a validation-modelling test was set up.
Meteorological data collected at the Al Mirfa monitoring station had been used and the dispersion model was executed on an hourly basis. The validation shows rather good agreement; however, there are some deviations or uncertainty that might have been caused by the different meteorological data (Table 2). The model runs two different scenarios (natural gas and diesel fired plants) to evaluate the potential impact of air pollution emissions on the environment at four receptor points. Modeling results for both scenarios are presented in Table 3.
5.2. Model Results
The first scenario incorporates emissions from the Al Mirfa plant when operating on natural gas. The maximum predicted 1-hour CO concentration during the study period was 41 μg/m3, which is 0.14% of the threshold from the FEA and was recorded at a distance of 210 m from the plant, where no residential areas are located. This might be due to the fact that no pollution sources other than low levels of traffic exist in the vicinity of the plant. The maximum predicted hourly average concentrations of NO2 occurred when there were northeast winds of approximately 6.85 m/s in 2007 and northwest winds of approximately 11.85 m/s in 2008. The isopleths of the annual average concentration of CO, NO2 respectively are shown in Figures 4 and 5. These data indicates that when the plant was run on natural gas, there were no instances of the annual, daily or hourly standard limits being exceeded. The model output for NO2 shows that less than 50% of NO2 concentrations were below the limits and the highest hourly predicated concentration values did not approach the FEA standard (Table 3).
In the second scenario, it was assumed that the plant was fully fired by diesel. The model gave low annual average concentrations for pollutants, and no sites considered to be highly affected in the vicinity of the power plant by such concentrations. The hourly, daily and annual average concentrations predicted for the ground levels are strongly dependent on emission rates. The predicted daily concentration of SO2 over the entire area in 2007 was 68.21 μg/m3 on 15 July, 2007. The highest daily concentration recorded in 2008 was 50.8 μg/m3 on 10 July, 2008. Comparison of the predicted concentrations
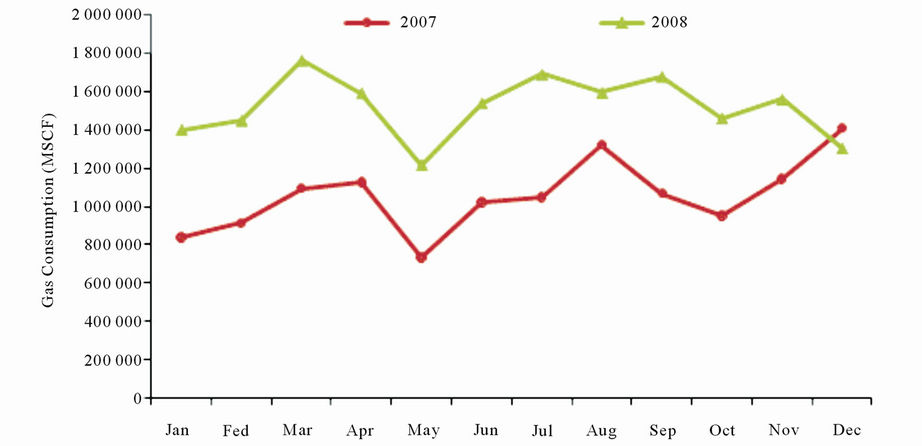
Figure 3. Monthly fuel consumption in Al Mirfa from 2007 to 2008.
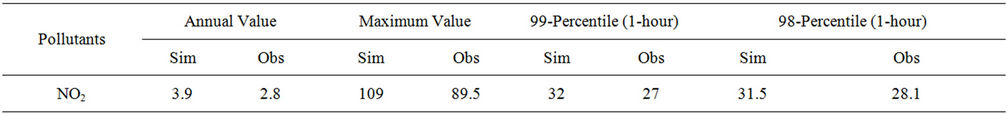
Table 2. Validation of NO2. Sim = Simulated value, Obs = Value measured at the monitoring station in μg/m3.
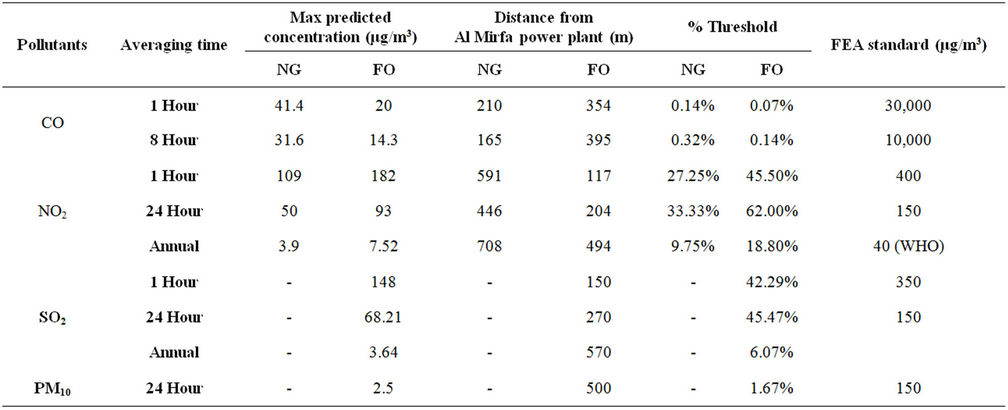
Table 3. Maximum predicted concentration; Natural Gas (NG) and Fuel Oil ( FO).
of CO and NO2 shows a clear reduction in NO2 and CO concentrations from scenarios 1 to 2. The simulation results show that there was no significant difference between the datasets for the two years considered. Based on gas consumption data, there was an increase in usage in 2007 and a reduction in 2008 with increased fuel use. These findings reflect the emissions and concentrations of the pollutants where a slight reduction in the ambient concentrations in the vicinity of the power plant, specifically at the receptors, was revealed.
6. Conclusion
Emission inventories from the Al Mirfa power plant were analyzed with seasonal variations in their power production. Meteorological data from 2007 and 2008 was obtained from Al Mirfa AAQMS and used as input data for
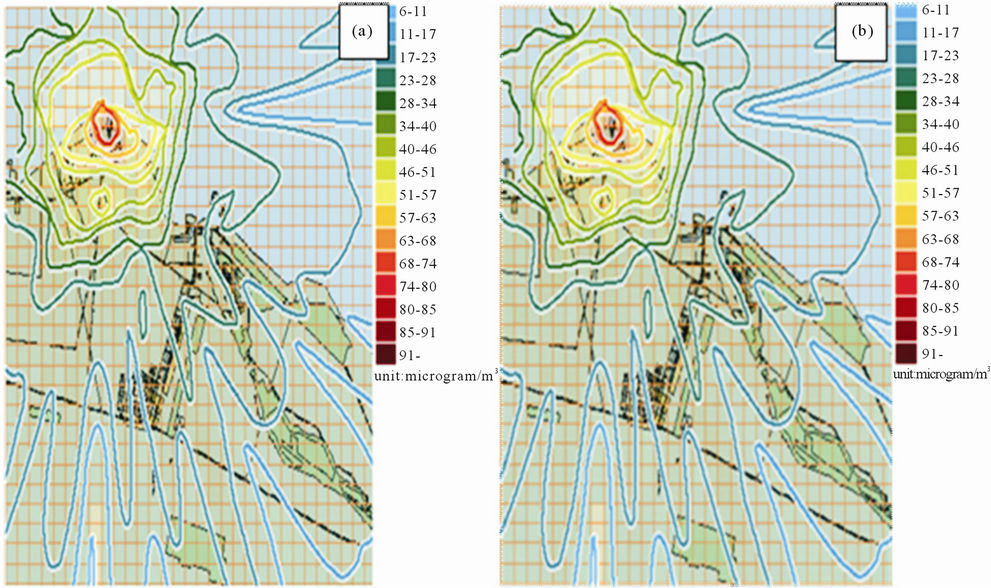
Figure 4. Isopleths plot of the max predicted (a) hourly and (b) 8 hour average ground level concentration of CO (μg/m3)- NG.
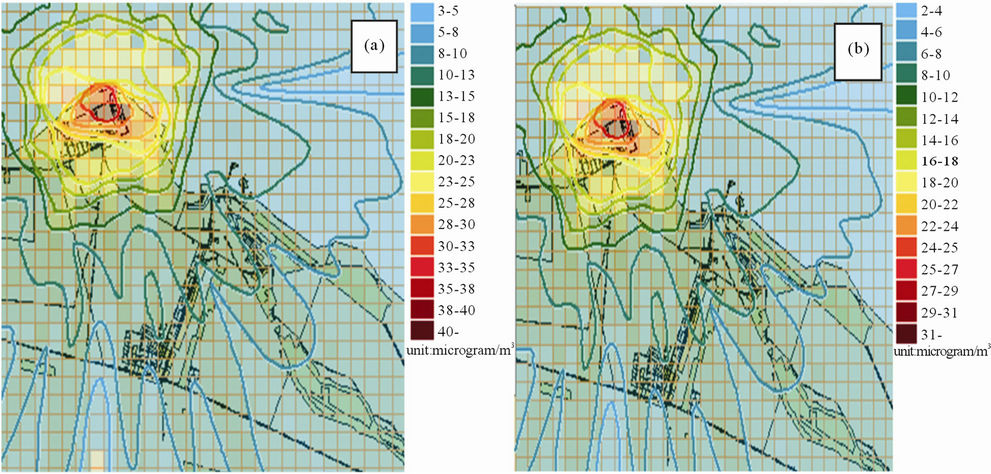
Figure 5. Isopleths plot of the max predicted (a) hourly and (b) daily average ground level concentration of NO2 (μg/m3)-NG.
the Envi met software to determine the stability class and upper air data and generate a compatible data file for implementation of the dispersion model. Two scenarios were tested, running the Al Mirfa power plant at full load using natural gas and using fuel oil. The impact of emissions was relatively low under both scenarios, even though the prevailing weather conditions were not particularly conducive to dispersing emissions. The model results indicate that the ground level concentrations for all compounds at the identified sensors were below their respective FEA standards. Furthermore, modelling revealed that the expected exposure of the receptors to pollutants emitted from the plant is low.
REFERENCES
- J. I. Levy and J. D. Spengler, “Modelling the Benefits of Power Plant Emission Controls in Massachusetts,” Journal of Air and Waste Management Association, Vol. 52, No. 1, 2002, pp. 5-18. doi:10.1080/10473289.2002.10470753
- J. I. Levy, J. D. Spengler, D. Hlinka, D. Sullivan and D. Moon, “Using CALPUFF to Evaluate the Impacts of Power Plant Emissions in Illinois: Model Sensitivity and Implications,” Atmospheric Environment, Vol. 36, 2002, pp. 1063-1075.
- M. T. Lopez, M. Zuk, V. Garibay, G. Tzintzun, R. Iniestra and A. Fernandez, “Health Impacts from Power Plant Emissions in Mexico,” Atmospheric Environment, Vol. 39, No. 7, 2005, pp. 1199-1209. doi:10.1016/j.atmosenv.2004.10.035
- A. M. Kazim, “Assessments of Primary Energy Consumption and Its Environmental Consequences in the United Arab Emirates,” Renewable and Sustainable Energy Reviews, Vol. 11, No. 3, 2007, pp. 426-446. doi:10.1016/j.rser.2005.01.008
- M. P. Ireland, J. Gomez, B. Cornet, T. Ellis, A. Clark and M. Grundy, “Quality Management in the Emirates-Case Study: Abu Dhabi, International Conference Integrated Sustainable Energy and Resources in Arid Region,” Environment Exhibition and Conference, Abu Dhabi, 28-31 January 2007.
- Abu Dhabi Water and Electricity Company (ADWEC), “Annual Statistical Report,” Abu Dhabi, 2008.
- N. Al-Azmi, N. Bader, V. Khan and R. Abdul, “SO2 and NOx Emissions from Kuwait Power Station in Years 2001 and 2004 and Evaluation of the Impact of These Emissions on Air Quality Using Industrial Sources Complex Short-Term ISCST Model,” Water Air and Soil Pollution, Vol. 203, No. 1-4, 2009, pp. 106-178.
- M. Shahgedanova, T. P. Burt and T. D. Davies, “Carbon Monoxide and Nitrogen Oxides Pollution in Moscow,” Water, Air, and Soil Pollution, Vol. 112, No. 1-2, 1999, pp. 107-131. doi:10.1023/A:1005043916123
- H. T. Nguyen and K. Ki-Hyun, “Comparison of Spatiotemporal Distribution Pattern of NO2 between Different Types of Air Quality Monitoring Stations,” Chemosphere, Vol. 65, No. 2, 2006, pp. 201-212. doi:10.1016/j.chemosphere.2006.02.061
- L. Dovile, “Nitrogen Dioxide Concentrations and Their Relation with Meteorological Conditions and Some Environmental Factors in Kaunas,” Environmental Research Engineering and Management, Vol. 43, No. 1, 2008, pp. 21-27.
- U.S. Environmental Protection Agency (1989), “AP-42: Compilation of Air Pollutant Emission Factors: Section 1.4—Natural Gas Combustion,” 2008. http://www.epa.gov/otaq/ap42.htm#intro
- U.S. Environmental Protection Agency, “Guideline for Determination of Good Engineering Practice Stacks Height (Technical Support Document for the Stack Height Regulations),” 1985. http://www.epa.gov/scram001/guidance/guide/gep.pdf
- US Environmental Protection Agency, “Rules and Regulations,” Federal Register, Vol. 70, No. 216, 2005.