Atmospheric and Climate Sciences
Vol. 2 No. 1 (2012) , Article ID: 17130 , 5 pages DOI:10.4236/acs.2012.21010
Applying SEM-EDX and XRD Techniques to Demonstrate the Overgrowth of Atmospheric Soot and Its Coalescence with Crystal Silicate Particles in Delhi
School of Environmental Sciences, Jawaharlal Nehru University, New Delhi, India
Email: *srivastava02@hotmail.com
Received October 31, 2011; revised December 3, 2011; accepted December 28, 2011
Keywords: Scanning Electron Microscope; Energy Dispersive X-Ray; Soot; Aerosols; Overgrowth; Delhi
ABSTRACT
Scanning electron microscopy-energy dispersive X-ray analysis (SEM-EDX) and X-ray diffraction (XRD) systems were used to demonstrate the overgrowth of soot to fractal like structure and its subsequent coalescence with crystal shaped silicate particles. Sample was obtained from a very clean area of Delhi at a height of 16 m from ground with the help of a five stage cascade impactor in the winters of 2006. Impactor collects particles in five different size ranges (i.e. ≥10.9, 10.9 - 5.4, 5.4 - 1.6, 1.6 - 0.7 and ≤0.7 μm). In the present investigation only the particles collected in the size range 1.6 - 0.7 μm (D50 = 0.980 μm) have been considered. It has clearly been observed that the soot particles tend to grow or rather agglomerate in a fractal like structure. During this process they incorporate other chemically and structurally different particles (crystal silicate in the present investigation) to make multi phase and multi chemical amorphous aggregates. These aggregates are formed during/after its collection on the sampling substrate and may be as many as hundred times more than the expected size interval (D50 or cut off range).
1. Introduction
The term “soot” is used for carbonaceous particles that are produced by the combustion of fossil fuels or vegetation, and have characteristic morphology, size and microstructure [1]. As the strongest absorbent of shortwave radiation in the atmosphere, soot (black carbon) has a strong influence on the radiation balance of the Earth [2,3]. Atmospheric soot particles are observed at altitudes up to 20 km. In the lower troposphere, soot particles are primarily generated from motor vehicles, biomass burning and power plants. Commercial aircraft exhaust is believed to be a major source of soot in the upper troposphere and lower stratosphere [4]. Airborne soot has adverse effects on human health [5] as well as on global climate change [6,7]. There is considerable interest in understanding how soot is chemically transformed in the atmosphere that changes soot’s properties [8,9]. Soot particles are mainly highly agglomerated solid carbonaceous materials generally incorporated with ash, volatile organic and sulfur compounds. These solid carbons are formed during combustion in locally rich regions. Much of it is subsequently oxidized. The residue is exhausted in the form of solid agglomerates.
Characterization of soot has been carried out in different parts of world by various techniques. Some of the important studies are as follows: Samson [10] analyzed the structure of soot agglomerates. Schmidt-Ott [11,12] carried out in situ characterization of ultrafine agglomerates. Xiong and Friedlander [13] studied the morphological properties of the atmospheric aerosol aggregates. Phase separation and regrowth of aerosol matter collected after size fractionation in an impactor has been demonstrated by Wittmaack [14]. In recent years some more important studies have been carried out by various authors [15-18].
All the above mentioned studies suggest the importance of characterizing the atmospheric soot particle. However, in Indian context no study so far has been done on the characterization of soot. In the present study analysis of the atmospheric soot of Delhi, one of the most polluted cities in world has been carried out by SEMEDX and XRD techniques. In this paper we have tried to demonstrate how the soot particles grow or rather overgrows after its deposition on to the sampling substrate.
2. Methods
2.1. Sampling Details
The study area JNU is in Delhi. Delhi, the capital city of India and one of the most polluted cities in the world, has a population of over 14 million along with 4.8 millions of registered vehicles, three coal based thermal power plants and 125,000 industrial unites [19]. Sample was obtained from the roof-top (16 m above the ground) of School of Environmental Sciences building in JNU on 04/05.01.2006. This period is characterized by intense winter, calm windy conditions and, frequent and low level of inversion. During sampling temperature range and humidity range was 15.4˚C - 5.1˚C (max-min) and 98.5% - 45.0% (max-min) respectively. JNU is situated on the Aravali mountain ranges, the oldest mountain of India and is considered to be one of the cleanest areas of Delhi.
A five-stage cascade particulate separator (CPS-105, Kimoto Electric Co. Ltd. Japan) was used for the collection of aerosols. The sampling was done for 24 hours at an average flow rate of 600 L/min. CPS-105 collects particles in five different size ranges viz. ≥10.9, 10.9 - 5.4, 5.4 - 1.6, 1.6 - 0.7 and ≤0.7 μm. In the present study only size range 1.6 - 0.7 μm was considered. Possibility of small error could not be ruled out during the deposition, thus the particles deposited may be considered to vary between 0.5 μm to 2.0 μm.
Samples were collected on Whatman EPM-2000, glass micro fiber filters. Filters were kept in vacuum desiccators for 24 hours to remove any moisture content before mounting them on the air sampler. After the sampling the filter papers were immediately transferred to vacuum desiccators to again de-moisturize them in the same manner.
2.2. SEM-EDX Measurement
The sample (dry filter paper) was cut in 1 mm2 size. A very thin film of gold and palladium was deposited on the surface of the sample to make them electrically conductive using vacuum coating unit. This extremely fine coating was done through the evaporation of Au-Pd plate under inert atmosphere (argon environment). The SEMEDX analyses were carried out with the help of a computer controlled field emission SEM (JEOL JSM-6330F, JEOL Ltd., Akishima Tokyo 196-8558 Japan) equipped with a EVEX-EDX detection system, Princeton, Gama Tech Instruments, NJ, 8540, US. In the present investigation, the SEM was used in its most common mode, the emissive mode. In the present investigation the current density was restricted to 5.0 keV to reduce the contribution of silicon substrate and minimize the loss of regrown aggregates.
2.3. X-Ray Diffraction Analysis
XRD analysis was carried out using a Philips, X’Pert PRO X-ray diffraction system, PANalytical, Holland, with a curved position sensitive detector (PSD) which gives a resolution of 0.03 mm over a range of 10˚ - 80˚ 2θ using standard techniques [20]. Measurements were taken in refection geometry (using Cu Kα1 radiation), with the tube operating at 45 kV and 40 mA and with a beam size of 10mm. Sample (filter paper) was glued on a metal slide. The data was collected at the rate of 2˚ per minute for a period over 35 min to ensure smooth diagnostic peaks.
3. Results and Discussion
In order to check the morphology and have an evidence of growth of soot and its association with other chemically different particles the electron micrographs of aerosols in the size range of 0.7 μm to 1.6 μm with EDX-spectrum and XRD pattern are provided in Figures 1-3. Here, it is important to mention that the occurrence of gold (Au) and palladium (Pd) in EDX-spectrum is due to the fact that Au-Pd was used for a very fine coating of all the samples to make them electrically conductive (refer Section 2.2). These two elements (Au-Pd) have not been included in the discussion.
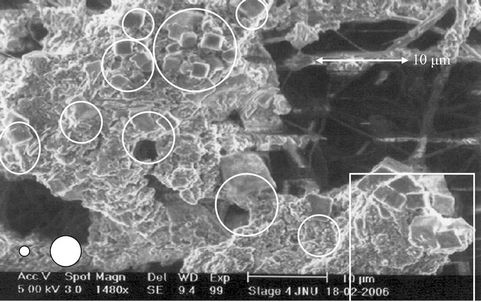
As evident from the EDX spectra (Figure 1(b)), although there are many elements present, but C, Si and Pb are present in the significant amount. In fact these are the main elements present in the Delhi’s ambient air abundantly, because vehicular pollution (~70%) followed by crustal re-suspension (~20%) are main pollution sources [21,22]. C is the vehicular borne element whilst Si is mainly generated from crustal dust. Crustal dust of Delhi also contains good amount of Pb, although leaded fuel has completely been banned in Delhi since 1998 [23]. To determine the identity of crystal particles present on the aerosol aggregates (Figure 1(a)) XRD pattern of the bulk sample was obtained and is illustrated in Figure 2. This reveals the presence of amorphous particles except one peak, which is being observed at an angle of approximately 26.645˚, this may correspond to some silicate crystal. Crystals of silicates give peak at an angle of approximately 26˚. Thus it can clearly be mentioned with the help of EDX and XRD spectra that the crystals appearing in Figure 1(a) are silicate.
Now with the help of Figures 1(a) and (b) it can be said that the circles and the square at right hand corner show the crystal silicate particles while bunches of amorphous particles are soot. Bunches of amorphous soot have been generated in many phases viz.
1) Initially fine soot particles have (<1 μm) after depositing on collection substrate coagulated or rather grown in a fractal like structure [16,18,24,25].
2) During the growth process soot kept incorporating other substances [14]. In the present investigation it is crystal silicates significantly as well as Pb, Al, Cl, Na, and K (as evident from EDX spectrum).
 (a)
(a)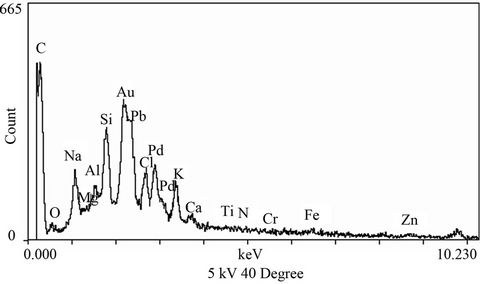 (b)
(b)
Figure 1. (a) Scanning electron micrograph of the particles in bulk White circular spots indicate aerodynamic upper (bigger spot) and lower (smaller spot) size limits; and (b) EDX-spectra of the same bulk aerosols.
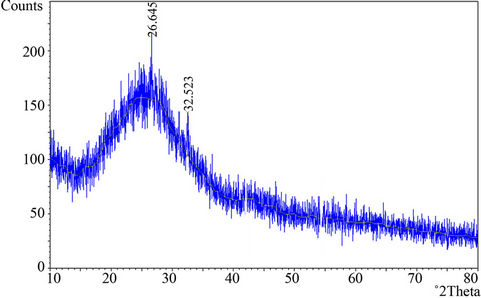
Figure 2. XRD pattern of the sample.
3) Additional agglomeration during aging (during or after sampling) may also be observed which finally resulted, the aerosol to convert into a big particulate mass comprising particles of different chemistry and structure.
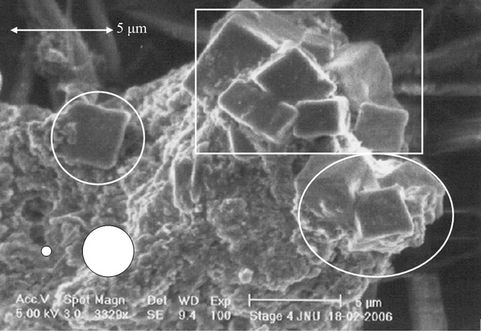
To confirm the above mentioned statement number (2) and (3) rectangular portion of Figure 1(a) has been zoomed-in in the Figure 3(a) and further more in Figure 3(b). Now, it can be noticed that, unlikely soot, crystal particles fall in the expected size range of 0.5 μm to 2.0 μm. As mentioned by Wittmaack et al. [14] hard crystal particles does not grow much even at a very high relative humidity (rh) and low temperature, but the soft soot keep growing.
From Figures 1(a) and 3(a) it is clear that bunches of soot are much larger than 10 μm size, whilst it should strictly be between the size ranges of 0.5 to 2.0 μm. The two white smaller and larger circular spots, in Figures 1(a), 3(a) and (b) represent the max and min size ranges of particles that can be deposited on the filter. This manifests that the soot particles have grown after impacting on sampling substrate. This result is in the close agreement with the results of Wittmaack et al. [14]. According to him the aerosol may grow in the form of extended amorphous agglomerates if the relative humidity (rh) exceeded 70% and can be larger than the cut point of the impactor stages. This is also in accordance with the results shown by Van Gulijk [17] that fractal like after sampling agglomeration among diesel borne soot leads
 (a)
(a)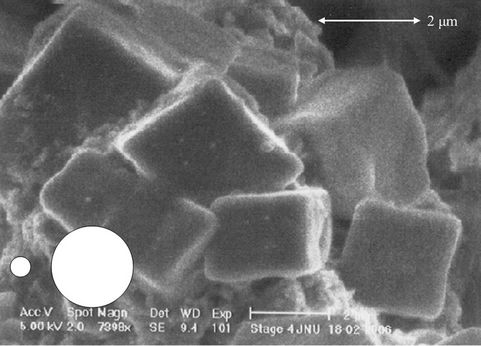 (b)
(b)
Figure 3. (a) Zoomed-in-view of the rectangular portion of the Figure 1(a); and (b) further zoomed-in-view of the rectangular portion of the Figure 3(a). White circular spots indicate aerodynamic upper (bigger spot) and lower (smaller spot) size limits.
us to underestimate the size of the aerosols and hamper size classification in the instrument. It is pertinent to mention that during sampling rh and temperature varied between 45% - 98.5% and 5.1 - 15.4 respectively. This is why we are getting soot aggregates (Figures 1(a) and 3(a)) having diameter many-many times what is expected cut off size of the impactor. Therefore we can say that this piling up or rather agglomeration of soot keep on taking place even after sampling i.e. during desiccation, storage etc. This has some serious health implications as well, because the same phenomenon can also occur inside human body, fine soot particles can penetrate deep inside our body and afterwards coagulate to coarse particles. Replenishment and flushing out of coarse particles from human body is very difficult than the fine particles. The degree of impairment is escalated when it is incorporated with some hazardous materials. The importance of this study is increased due to the fact that Delhi is highly polluted, having a huge amount of suspended soot and a large number of people (traffic police personnel and road side vendors) are continuously exposed to soot particles.
4. Conclusions
Characterization of soot particles in the fine size range of 0.5 to 2.0 μm was carried out using the SEM-EDX and XRD techniques. It was found that soot which is ubiquitous in fine size range in Delhi’s ambient air keep growing during sampling by the instrument or even after its collection on substrate. They also agglomerate with other chemically and structurally different particles. Since this growth is also humidity dependent thus during high level of rh soot particles can even grow to 100 times more than the respective expected cut off size of the impactor. Because of the aforesaid characteristics, it can be inferred that soot keeps incorporating other hazardous particles.
5. Acknowledgements
This study has been sponsored and funded by the Department of Science and Technology (DST), Government of India, New Delhi in the form of Young Scientist Project (SR/FTP/ES-19/2004) to Arun Srivastava. We deeply acknowledge Prof. Pulickel M. Ajayan, Rensselaer Polytechnic Institute (RPI), Troy, NY for his permission, and Anchal Srivastava and Ray Dove for carrying out SEM-EDX at RPI. Special thanks to S. Venkatesan, SES, JNU for his help during XRD analysis.
REFERENCES
- A. Gelencser, “Carbonaceous Aerosol,” Springer, Berlin, 2004, p. 350.
- M. Z. Jacobson, “Strong Radiative Heating Due to the Mixing State of Black Carbon in Atmospheric Aerosols,” Nature, Vol. 409, No. 6821, 2001, pp. 695-697. doi:10.1038/35055518
- J. E. Penner, S. Y. Zhang and C. C. Chuang, “Soot and Smoke Aerosol May Not Warm Climate,” Journal of Geophysical Research, Vol. 108, No. D21, 2003, p. 4657. doi:10.1029/2003JD003409
- A. Petzold, J. Strom, F. P. Schroder and B. Karcher, “Carbonaceous Aerosol in Jet Engine Exhaust: Emission Characteristics and Implications for Heterogeneous Chemical Reactions,” Atmospheric Environment, Vol. 33, No. 17, 1999, pp. 2689-2698. doi:10.1016/S1352-2310(98)00314-8
- D. W. Dockery, C. A. Pope, X. P. Xu, J. D. Spengler, J. H. Ware, M. E. Fay, B. G. Ferris and F. E. Speizer, “An Association between Air Pollution and Mortality in Six US Cities,” New England Journal of Medicine, Vol. 329, No. 24, 1993, pp. 1753-1759. doi:10.1056/NEJM199312093292401
- W. L. Chameides and M. Bergin, “Climate Change-Soot Takes Center Stage,” Science, Vol. 297, No. 5590, 2002, pp. 2214-2215. doi:10.1126/science.1076866
- A. Hunt, J. L. Abraham, B. Judson and C. L. Berry, “Toxicological and Epidemiologic Clues from the Characterization of the 1952 London Smog Fine Particulate Matter in Archival Autopsy Lung Tissues,” Environmental Health Perspective, Vol. 111, No. 9, 2003, pp. 1209-1214. doi:10.1289/ehp.6114
- K. Fassi-Fihri and S. R. Rosset, “Internal and External Mixing in Atmospheric Aerosols by Coagulation: Impact on the Optical and Hygroscopic Properties of the Sulphate-Soot System,” Atmospheric Environment, Vol. 31, No. 10, 1997, pp. 1393-1402. doi:10.1016/S1352-2310(96)00341-X
- A. Braun, A. Wirick, A. Kubatova, B. S. Mun and F. E. Huggins, “Photochemically Induced Decarboxylation in Diesel Soot Extracts,” Atmospheric Environment, Vol. 40, No. 30, 2006, pp. 5837-5844. doi:10.1016/j.atmosenv.2006.05.024
- R. J. Samson, G. W. Mulholland and J. W. Gentry, “Structural Analysis of Soot Agglomerates,” Langmuir, Vol. 3, No. 2, 1987, pp. 272-281. doi:10.1021/la00074a022
- A. Schmidt-Ott, “In Situ Measurement of the Fractal Dimensionality of Ultrafine Aerosol Particles,” Applied Physics Letters, Vol. 52, No. 12, 1988, pp. 954-956. doi:10.1063/1.99239
- A. Schmidt-Ott, “New Approaches to in Situ Characterization of Ultrafine Agglomerates,” Journal of Aerosols Science, Vol. 19, No. 5, 1988, pp. 553-563. doi:10.1016/0021-8502(88)90207-8
- C. Xiong and S. K. Friedlander, “Morphological Properties of Atmospheric Aerosol Aggregates,” PNAS, Vol. 98, No. 21, 2001, pp. 11851-11856. doi:10.1073/pnas.211376098
- K. Wittmaack, N. Menzel, H. Wehnes and U. Heinzmann, “Phase Separation and Regrowth of Aerosol Matter Collected after Size Fractionation in an Impactor,” Atmospheric Environment, Vol. 36, No. 39, 2002, pp. 5877- 5886. doi:10.1016/S1352-2310(02)00827-0
- M. Chiaradia and F. Cupelin, “Behaviour of Airborne Lead and Temporal Variations of Its Source Effects in Geneva (Switzerland): Comparison of Anthropogenic versus Natural Processes,” Atmospheric Environment, Vol. 34, No. 6, 2000, pp. 959-971. doi:10.1016/S1352-2310(99)00213-7
- M. Wentzel, H. Gorzawski, K. H. Naumann, H. Saatho and S. Weinbruch, “Transmission Electron Microscopical and Aerosol Dynamical Characterization of Soot Aerosols,” Aerosols Science, Vol. 34, No. 10, 2003, pp. 1347- 1370. doi:10.1016/S0021-8502(03)00360-4
- C. Van Gulijk, J. C. M. Marijnissen, M. Makkee, J. A. Moulijn and A. Schmidt-Ott, “Measuring Diesel Soot with a Scanning Mobility Particle Sizer and an Electrical LowPressure Impactor: Performance Assessment with a Model for Fractal-Like Agglomerates,” Aerosols Science, Vol. 35, No. 5, 2004, pp. 633-655. doi:10.1016/j.jaerosci.2003.11.004
- M. Maricq, “Coagulation Dynamics of Fractal-Like Soot Aggregates,” Aerosols Science, Vol. 38, No. 2, 2007, pp. 141-156. doi:10.1016/j.jaerosci.2006.11.004
- “Economic Survey of Delhi,” Planning Department, Government of NCT of Delhi, Delhi Secretariat, New Delhi, 2005-2006.
- G. Cressey and P. F. Schofield, “Rapid Whole-Pattern Profile Stripping Method for the Quantification of Multiphase Samples,” Powder Diffraction, Vol. 11, No. 1, 1996, pp. 35-39.
- A. Srivastava and V. K. Jain, “Seasonal Trends in Coarse and Fine Particle Sources in Delhi by the chemical Mass Balance Receptor Model,” Journal of Hazardous Materials, Vol. 144, No. 1-2, 2007, pp. 283-291. doi:10.1016/j.jhazmat.2006.10.030
- A. Srivastava and V. K. Jain, “Size Distribution and Source Identification of Suspended Particulate Matters in Atmospheric Aerosols over Delhi,” Chemosphere, Vol. 68, 2007, pp. 579-589. doi:10.1016/j.chemosphere.2006.12.046
- S. Balachandran, B. R. Meena and P. S. Khillare, “Particle Size Distribution and Its Elemental Composition in the Ambient Air of Delhi,” Environment International, Vol. 26, No. 1-2, 2000, pp. 49-54. doi:10.1016/S0160-4120(00)00077-5
- A. Schmidt-Ott, U. Baltensperger, H. W. Faggeler and D. T. Jost, “Scaling Behavior of Physical Parameters Describing Agglomerates,” Journal of Aerosols Science, Vol. 21, No. 6, 1990, pp. 711-717. doi:10.1016/0021-8502(90)90037-X
- G. Skillas, S. Futzel, H. Burtscher, U. Baltensperger and K. Siegmann, “High Fractal-Like Dimensions of Diesel Soot Agglomerates,” Journal of Aerosols Science, Vol. 29, No. 4, 1998, pp. 411-419. doi:10.1016/S0021-8502(97)00448-5
NOTES
*Corresponding author.