Journal of Diabetes Mellitus
Vol. 2 No. 1 (2012) , Article ID: 17316 , 13 pages DOI:10.4236/jdm.2012.21010
Impact of glucotoxicity induced in vivo and in vitro in Psammomys obesus
![]()
1Laboratory of Cellular and Molecular Physiopathology, Institute of Natural Sciences, University of Technological Sciences, Houari Boumediene, Algiers, Algeria; *Corresponding Author: berdja.soha@hotmail.com
2Laboratory of Biochemistry and Extracellular Matrix Remodeling, USTHB, Algiers, Algeria
3Laboratory of Biochemistry of Central Hospital of Army, Algiers, Algeria
4Laboratory of Nuclear Medicine Biochemistry of Central Hospital of Army, Algiers, Algeria
Received 7 November 2011; revised 12 December 2011; accepted 27 December 2011
Keywords: Psammomys obesus; aorta; adventitial fibroblasts in culture; DT2; glucotoxicity; extracellular matrix; oxidative stress
ABSTRACT
Objective: Chronic hyperglycemia characteristic of type diabetes 2 is responsible for the accelerated atherosclerosis with increased cardiovascular risk. In this study, we will propose to analyze the effect of a long-term of glucotoxicity in vivo in Psammomys obesus by addition of sucrose to 30% for 11 months and in vitro study of adventitial fibroblasts in the presence of D-glucose 0.6% for 7 days. Materials and methods: Evaluation of plasma biochemical parameters was carried out at the initial time and at the end of experiment. At autopsy, a morphological study of the aorta was performed after fixation in aqueous Bouin and staining with Masson’s trichrome. The experimental glucotoxicity is induced by incubation of fibroblasts in DMEM enriched with D-glucose at 0.6% for 7 days. The impact of glucotoxicity is assessed in the intracellular compartments through dosage of total nitrite and malon dialdehyde, a product of lipid peroxidation, and thanks to a morphological assay after fixation of cells with aqueous bouin and blood staining with May Grünwald Giemsa. The evaluation of cell proliferation is accomplished by cell counting. Collagens I and III of the extracellular compartment are characterized by SDS-PAGE. Results: Animals subjected to sucrose showed hyperglycemia associated with hyperinsulinemia, dyslipidemia, hyperproteinemia, increased CPK and VLDL-LDL and decreased HDL. Histology of aortas revealed endothelial cells hypertrophy, severe disorganization of intima and media. In the presence of glucose, the proliferation of fibroblasts increases very significantly (P = 2.34 × 10⁻⁵), the rate of malonaldehyde, nitrite and total density of chains α2 (I) and α1 (I + III) extra-cellular collagens I and III increased significantly. After staining, the cells showed hypertrophy, vacuolation of cytoplasm and chromatin condensation with nuclear fragmentation, indicative of apoptosis. Conclusion: The glucotoxicity induced in vivo and in vitro is responsible for major structural and metabolic alterations leading to the acceleration of the atherosclerotic process.
1. INTRODUCTION
Chronic hyperglycemia characteristic of type diabetes 2 is responsible for the accelerated atherosclerosis and increased cardiovascular risk [1], it is established that cardiovascular complications are the major causes of diabetic patients morbidity and mortality worldwide [2,3]. Chronic hyperglycemia induces a modulation of the expression of many key proteins involved in glucose toxicity [4]. It induces a dysfunction of the intracellular signal transduction in modulating the activity of kinase C protein, generating oxygen reactive species, activating ERstress, generating advanced glycation end products, activating polyol pathway and hexoamines, increased release of proinflammatory cytokines as well as growth factors. All these alterations lead to endothelial dysfunction which may be regarded as a sign of vascular disease being a key factor in the development of atherosclerosis [1, 4,5].
Given our interest in cardiovascular complications risk factors and knowing that Psammonys obesus, is a choice model for diabetes and atherosclerosis, we found it interesting to analyze the effect of a long-term glucotoxicity in vivo by adding 30% sucrose during 11 months period of experimentation on aortic vascular cells of Psammomys obesus and analyzing the effect of glucotoxicity in vitro on fibroblast aortic subculture.
2. MATERIAL & METHODS
2.1. Biological Material
Our study is conducted on an experimental model of gerbillid class (Psammomys obesus), gopher, a deserticolous rodent from the region of Beni-Abbes, south west of Algeria, in city of Bechar (30˚7 northern Lattitude and 2˚10 western longitude). In its natural environment, this gerbil eats halophilic Chenopodiaceae poor in calories (0.4 Kcal/g for Salsola foetida). The Chenopodiaceae are very rich in water and mineral salts especially the sodium salt. Psammomys is an animal primarily diurnal, living alone or in small groups in burrows offering shelter from external temperature with high moisture (50% - 80%) [6].
After familiarization time, animals are divided into two pools, one for control and another experimental: a control pool (n = 6 animals) with average body weight of 94.83 ± 2.99 g receiving 50 g of halophilic plants daily, which corresponds to 20 - 22 calories of energy intake per animal and an experimented pool (n = 6 animals) with average body weight of 86.16 ± 4.87 g receiving daily 50 g of halophilic plants with added 30% sucrose, corresponding to 80 - 82 Calories of energy intake per animal (1 g of sucrose equals 4 calories).
2.2. Methods
2.2.1. Analytical Methods
During the experiment which lasted 11 months and in order to monitor changes in body weight, animals were weighed on a weekly basis during the 11 months of experiment. For metabolic monitoring, monthly blood samples were performed on wake animals through puncture at the retroorbital sinus of the eye using a Pasteur pipette [7]. This technique avoids the use of anesthetics that may impact biochemical parameters. The immediately blood sampled on heparinized and dry tubes is centrifuged (3000 rpm). Plasma is collected for the measurement of biochemical parameters (glycemia, triglyceride, cholesterolemia and serum proteinemia) performed using RANDOX kits and the sera for assay of lipoprotein on agarose gel by the method of Kalwakami (1989) REP-controller kit on lipid Lp (a) of the KPC (cassette COBAS INTEGRA) and insulin (INSULIN-CT kit, CIS Bio International).
2.2.2. Organs Harvesting
At the end of the experiment (11 months), animals were sacrificed after anesthesia by intraperitoneal injection of urethane at 25%, at 0.4 ml/100 g body weight. Some aortas were harvested under sterile conditions for cell culture and others for the histological study, the rest of organs are fixed and/or frozen at −80˚C for further study.
2.2.2.1. Histology of the aorta The aortas were fixed in Bouin’s aqueous fluid for three days and then washed with running water for 48 hours. Dehydration is carried out in alcohol baths with increasing concentration of 30 min (50˚, 70˚, 90˚, 100˚). For complete removal of traces of alcohol, the body is immersed in two baths of butanol for 30 minutes, then immersed in two baths of paraffin for 2 hours at 6˚C. Paraffin blocks are made using the Leuckart bars and sections of 5 microns thick are made using an American Optical type microtome. For the structural study, the aorta was stained with Masson trichrome [8].
2.2.2.2. Culture of adventitial fibroblasts The adventitial fibroblasts of Psammomys obesus were cultured by the explant technique [9]. The control aorta was removed and immediately plunged in a petri dish containing Dulbecco’s modified Eagle’s medium DMEM with 10% fetal calf serum (FCS) supplemented with 1% antibiotics (streptomycin 50mg/ml, penicillin 50 IU/ml, Sigma), 1.2% glutamine (Sigma) and 5% Hepes to maintain pH. The aortic lumen is then emptied of its blood. The aorta is incubated for 20 minutes at 37˚C in 0.1% collagenase, to remove the endothelium and facilitate the separation between the adventitia and media, and cut into 1 mm explants, 8 - 10 explants were placed in flasks and incubated in the presence of DMEM 20% FCS, 1.2% glutamine and 1% antibiotics and plunged into the incubator at 37˚C under humidified atmosphere with 95% air and 5% CO2. The cultivation of explants is the primary culture.
On secondary culture and at the ninth passage and at confluence, they were suspended after trypsinisation. They were sown in flasks at 1.5 × 10⁶ cells per flask in DMEM supplemented with 10% FCS, 1.2% glutamine, 1% TBA and incubated in the presence of D-glucose at different dosages, 0.6% for 7 days. At confluence, the medium is removed, the control fibroblasts and fibroblasts subjected to glucose are reincubated in 1.5 ml DMEM without FCS for 24 h. The milieu represents the extracellular compartment; the intracellular compartment is recovered in 1.1 ml of DMEM after scratching with a Pasteur pipette. The intra and extracellular compartments are collected for determinations of total protein, lipid peroxidation products and total nitrite.
2.2.3. Proliferation Study
At the 9th passage and after exposure to D-glucose, the cells are trypsinized, the evaluation of the rate of proliferation was performed on 100 µl of cell suspension by counting on Malassez cell.
2.2.4. Morphometric Study
To analyze the state of adventitial fibroblasts of Psammomys obesus submitted to D-glucose, these were, at their ninth pass, sown in 6-well plates at 2 × 10⁵ per well in the presence of D-Glucose at 0.6% for 7 days. The milieu is eliminated and the cells washed in 1x PBS and fixed in Bouin's aqueous for 30 minutes. After rinsing with PBS and alcohol (96˚), cells were stained for 10 minutes with a solution of May-Grunwald Giemsa (V/V, 1/1) diluted to 1/3 in distilled water. The excess of stain is removed with 1X PBS. The nucleolus count is conducted on 100 cells in different fields and on several wells.
2.2.5. Determination of Malondialdehyde (MDA)
The MDA measured in the intracellular compartments of control fibroblasts and subjected to D-Glucose 0.6% for 7 days, after reaction with TBA [10]. Intracellular compartments of control fibroblasts and those subjected to D-Glucose were centrifuged at 10,000 g for 20 min at 4˚C in a buffer (Na2HPO4/NaH2PO4) 0.2 M, pH 6.5. The MDA content in the supernatant in the presence of 10% TCA reacts with TBA and causes the formation of a complex read at 532 nm.
2.2.6. Determination of NO
NO formation is typically and indirectly assessed by determining the concentrations of nitrites and nitrates that are products of oxidative degradation of NO. The intracellular compartments of control cells and those subjected to D-Glucose were deproteinized by centrifugation at 10,000 g for 10minutes at −20˚C. The determination of nitrite and nitrate is produced directly from the obtained supernatant. The Griess reaction only allows the measurement of nitrite. Nitrates should be reduced to nitrite prior to be quantified. The concentration thus measured represents the sum of nitrites and nitrates. The conversion of nitrate to nitrite is based on a reduction reaction by cadmium and regenerated using a solution of CuSO4 in 5 mM glycine-NaOH buffer, in contact for 5 minutes. The nitrite contained in the intracellular compartments of control cells, and those subjected to D-Glucose, deproteinized and regenerated are quantified after addition of Griess reagent [0.1% N-(1 naphthyl) ethylenediamine dihydrochloride, 1% sulfanilamide, and 5% phosphoric acid]. OD reading is made at 543 nm [11].
2.2.7. Determination of Total Protein and Collagen
Samples (extra-and intracellular compartments of control and of cells subjected to D-Glucose) are recovered in the dialysis tubes (Serva, 8/32). These undergo two successive 24 h dialysis, respectively against running water and acetic acid 0.5 M at 4˚C with shaking. After dialysis, an aliquot is taken to quantify the total protein and the rest underwent a third dialysis in the presence of pepsin (Merck) at 200 mcg/ml, against 0.5 Macetic acid for 24 h at 4˚C. Total protein and pepsin-resistant protein (collagen) contained in the ECC and the ICC will react with the Bradford reagent resulting in the formation of a blue colored complex legible at a wavelength of 595 nm [12].
2.2.8. Electrophoresis of total collagen Collagens were separated by electrophoresis on vertical polyacrylamide gel in 10% in denaturing conditions [13]. Each of the lyophilized samples (500 μl) of extra-and intracellular compartments of control cells and incubated in the presence of D-glucose are shown with 200 µl sample buffer and placed under denaturing conditions (incubation 3 to 5 minutes at 100˚C) to separate the α chains of collagen by breaking disulfide bonds.
2.3. Statistical Analysis
our results presented correspond to the means impacted with standard deviation and analyzed by Student’s test.
3. RESULTS
3.1. In Vivo Study
3.1.1. Change in Body Weight
In animals submitted to the natural diet supplemented with 30% sucrose, we recorded a very highly significant increase in body weight at the end of the experiment 142 ± 10.98 g vs. 86.17 ± 4.87 g at the initial time (T0) (See Figure 1).
3.1.2. Analysis of Biochemical Parameters
3.1.2.1. Study of glycemia In our experiment, during the first 3 months, we noted a non significant variation between control animals and those submitted to 30% sucrose, but from the 4th month, the increase in glycemia levels in animals submitted to sucrose became significant (See Figure 2).
3.1.2.2. Study of triglycerides Our results showed an increase in triglyceride levels in animals submitted to sucrose from the 2nd month of experimentation, this increase was very significant in the 4th and 7th month, it was observed till the end of the experiment. At T3 and T11 statistical analysis revealed little insignificance due to the large individual variations sometimes (See Figure 3).
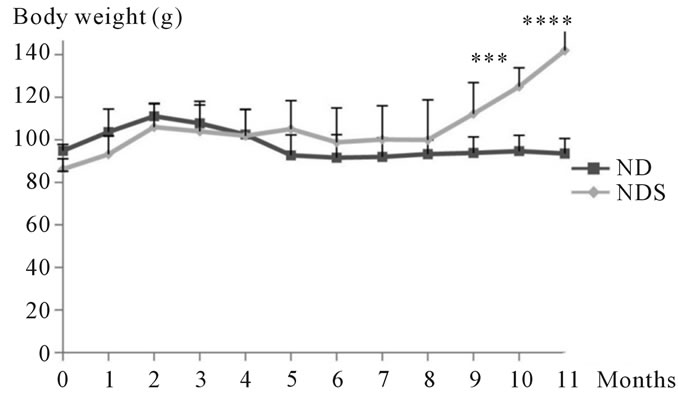
Figure 1. Evolution of body weight in both control and Psammomys obesus submitted to 30% sucrose for 11 months of experimentation.
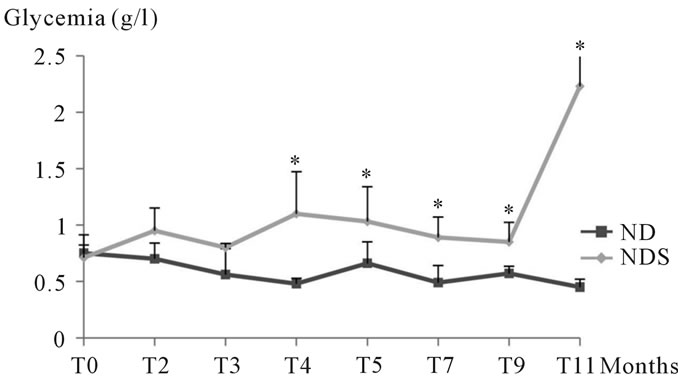
Figure 2. Glycemia levels changes in both control and Psammomys obesus submitted to 30% sucrose. The values are the averages impacted by standard deviation. P > 0.05, *P ≤ 0.05. The level of significance is calculated for animals subjected to sucrose vs. corresponding controls.
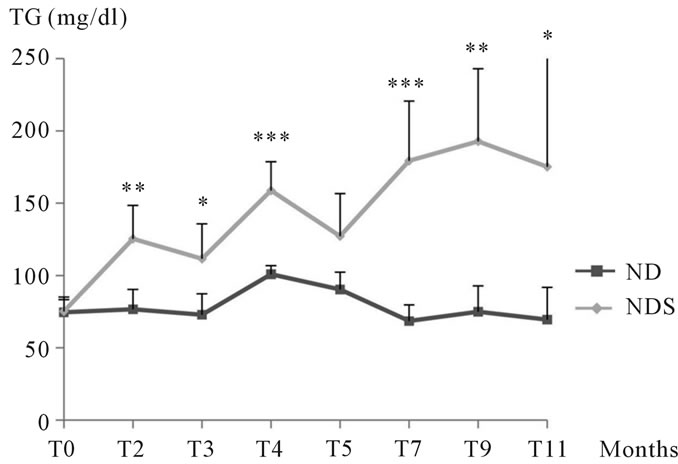
Figure 3. Changes in triglyceride levels in both control and Psammomys obesus submitted to 30% sucrose for 11 months. The values are averages affected with the standard deviation. P > 0.05, *P ≤ 0.05, **P ≤ 0.01; ***P < 0.001. The level of significance is calculated for animals subjected to sucrose vs. corresponding controls.
3.1.2.3. Study of cholesterol During our experiments, we noted a cholesterolemia increase in animals submitted to sucrose compared to corresponding controls, but statistical analysis revealed no significant difference during the first 4 months of treatment. From the 5th month until the end of the experiment, the increase in cholesterol in animals submitted to sucrose was significant compared to corresponding controls. (See Figure 4)
3.1.2.4. Study of porteinemia Results obtained showed little variation of proteinemia in Psammomys batch submitted to sucrose compared to corresponding controls. However, we noted an increase in this parameter from the 3rd month of experimentation that was significant at the end of experimentation. (See Figure 5)
3.1.2.5. Plasma Lipoproteins Analysis of plasma lipoproteins in Psammomys submitted to natural diet supplemented with sucrose at 30% per day revealed that the latter affects all plasma lipoproteins. Our results showed little variation in the atherogenic lipoproteins rates (LDL-VLDL) till the 9th month
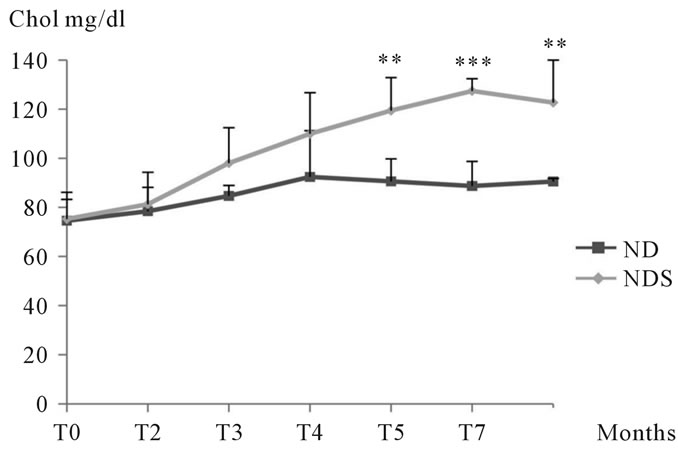
Figure 4. Changes in cholesterolemia levels in both control and Psammomys obesus submitted to sucrose during 11 months of experimentation.
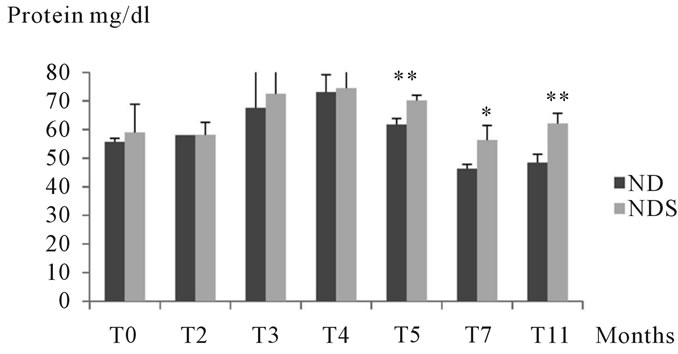
Figure 5. Variations in proteinemia in both control and Psammomys obesus submitted to 30% sucrose for 11 months of experimentation. The values are averages affected with the standard deviation. P > 0.05, *P ≤ 0.05, **P ≤ 0.01. The level of significance is calculated for animals subjected to sucrose vs. corresponding controls.
when we recorded rates of 48.74 ±11.63% in the experienced group vs. 36.87 ± 4.22% at T0; statistical study revealed a significant increase. At the end of the experiment, we noted a very significant increase of 53.35 ± 0.75% in the experiment group vs. 36.87 ± 4.22% at T0. On cardioprotective lipoprotein (HDL), we noted a very significant decrease in the 9th month of experimentation, but at the end of experiment, we recorded a very significant decrease which corresponds to 46.64 ± 0.75 vs. 63.13 ± 4, 22% at T0 (See Figure 6).
3.1.3. Determination of Cardiac Marker CPK
Our results showed a significant increase in CPK after 4 months of treatment, compared to its value at initial time (396.2 ± 161.7 vs. 183.6 ± 68.74 U/l). At the end of the experiment, we noted a very significant increase: 4361.25 ± 1321.99 vs. 183.6 ± 68.74 U/l at T0 (See Figure 7).
3.1.4. The Insulinemia
During the experiment, we noted during the first 4 months, a non significant change in plasma insulin of animals submitted to the natural diet supplemented with 30% sucrose compared to T0. From the 5th month, insulin increased significantly and reached 321.25 ± 86.41 μUI/ml at the end of the experiment vs. 20.24 ± 9.38 μUI/ml at the initial time and statistical analysis revealed
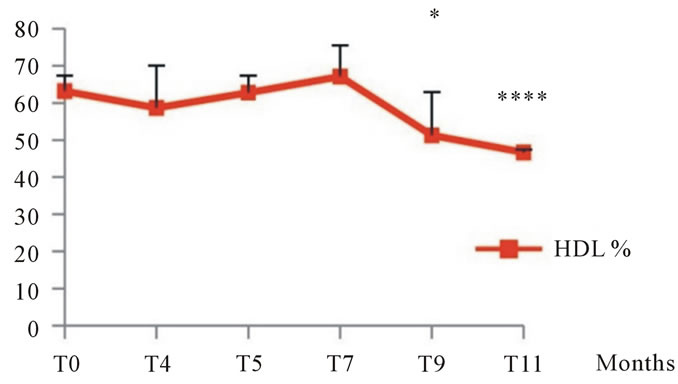
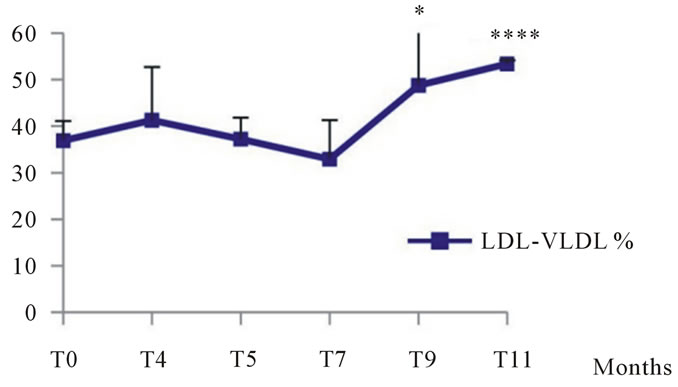
Figure 6. Changes in plasma lipoproteins in Psammomys obesus submitted to natural diet supplemented with sucrose at 30% for 11 months. The values are averages affected with standard deviation. *P ≤ 0.05, ****P < 0.0001. The level of significance is calculated for animals subjected to sucrose vs. initial time.
a very significant change (See Figure 8).
3.1.5. Morphological Study
At the autopsy, the observation of these sections helped to highlight structural and functional alterations in the three layers of the aortic wall. These alterations are evidence of endothelial dysfunction, an extracellular matrix remodeling of the vascular wall (See Figures 9, 10, 11).
3.2. In Vitro Study
3.2.1. Study of Proliferation
Our results showed a very significant increase in the rate of proliferation of adventitial fibroblasts incubated in the presence of D-glucose compared to their corresponding controls. Indeed, after 7 days of incubation, proliferation increased with 23.9% in cells incubated in the presence of D-Glucose at 0.6% vs. the corresponding controls. Statistical analysis revealed highly significant difference (See Figure 12).

Figure 7. Changes of CPK in Psammomys obesus submitted to natural diet supplemented with sucrose at 30% for 11 months. The values are averages affected with standard deviation. *P ≤ 0.05, **P ≤ 0.01, ***P < 0.001. The level of significance is calculated for animals subjected to sucrose vs. initial time.
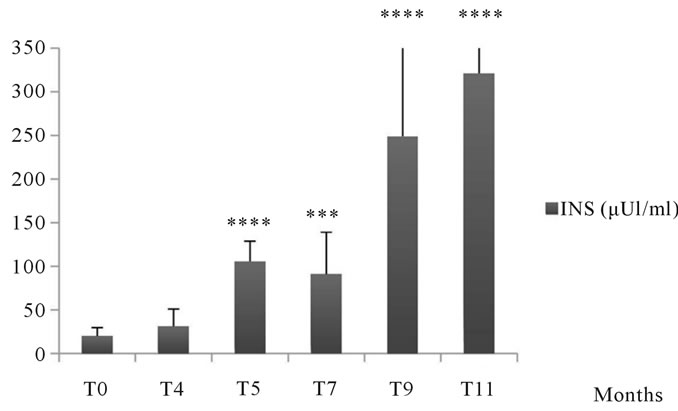
Figure 8. Changes in insulin levels in Psammomys obesus submitted to natural diet supplemented with sucrose at 30% for 11 months. The values are averages affected with standard deviation. P > 0.05, ***P ≤ 0.001, ****P < 0.0001. The level of significance is calculated for animals subjected to sucrose vs. initial time.
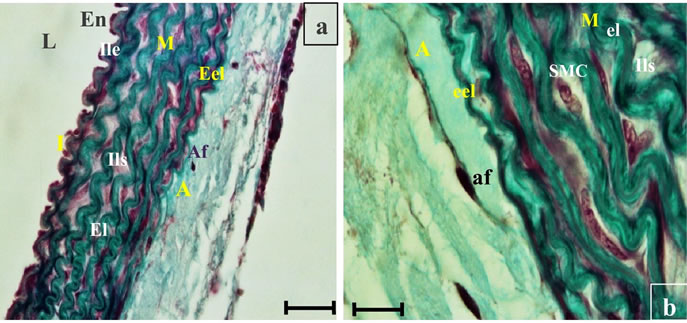
Figure 9. Histological section of aorta Psammomys obesus submitted to natural diet with 30% sucrose for 11 months. Masson Trichrome staining. Light (L), intima (I), endothelium (En), internal elastic limitating (Ile), elastic lamina (El), interlamellar space (ILS), smooth muscle cells (SMC), external elastic lamina (Eel), adventitia (A), adventitial fibroblats (AF).
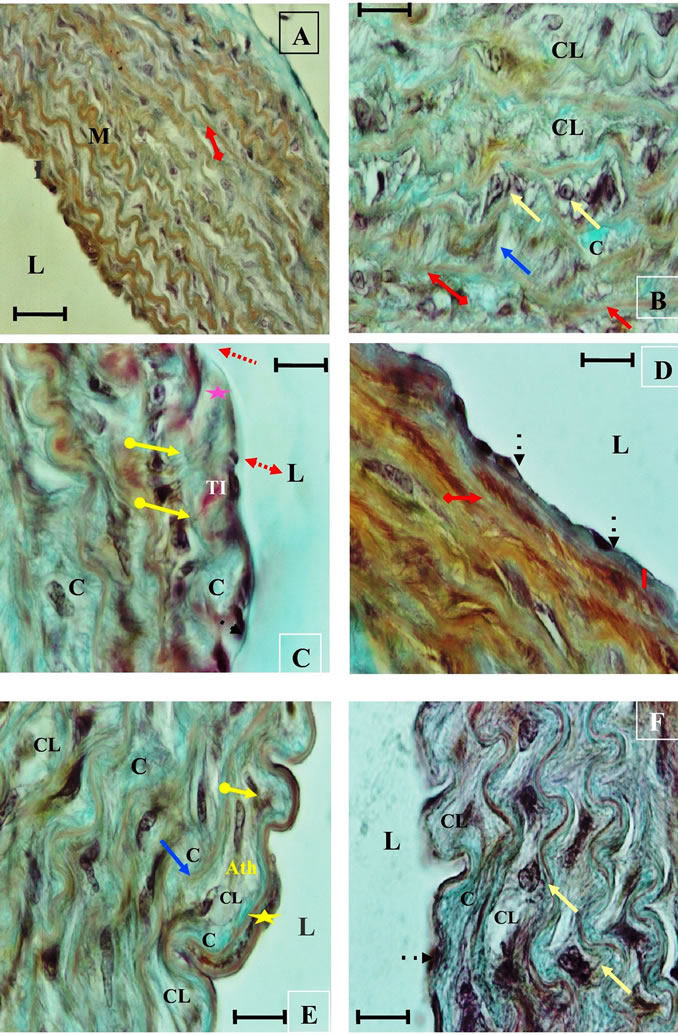
Figure 10. Histological section of aorta Psammomys obesus submitted to natural diet supplemented with 30% sucrose for 11 months. Masson Trichrome staining. ( ) Hypertrophy of endothelial cells, Increased space in endothelial (
 ), Endothelia Disruption (
 ) , Intimal thrombus (TI), Absence of the internal elastic lamina (
 ), Thickening of the intima (
 ), rupture of elastic plates (
 ), Ripple loss, thinning of the elastic strips (
 ), apoptotic nuclei (
 ), SMC migration (
 ), duplication of internal elastic lamina (
 ), (C) accumulation of collagen, (CL) Core lipid, (Ath) early atheroma.
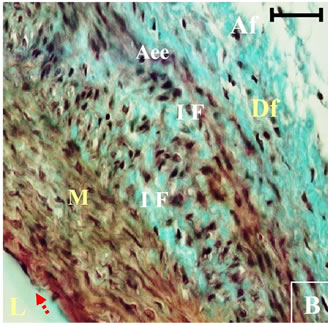

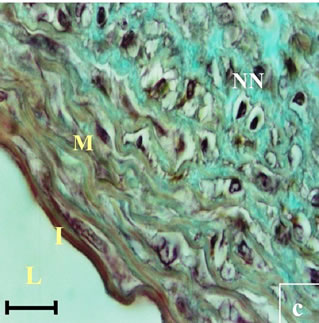
Figure 11. Histological section of aorta Psammomys obesus submitted to natural diet supplemented with 30% sucrose for 11 months. Masson Trichrome staining. Apoptotic nuclei (AN), Increased densuty of Fibroblasts (DS), Infiltration of fibroblasts (IF), Necrotic nuclei (NN).
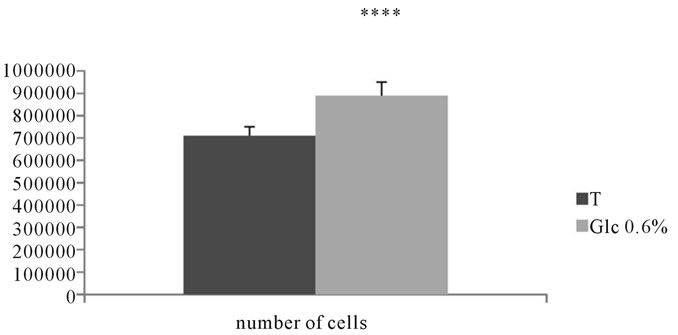
Figure 12. Rate of proliferation of adventitial fibroblasts of Psammomys obesus incubated in the presence of D-Glc to 0.6% for 7 days.
3.2.2. Morphological and Morphometric Study
Measuring the number of nucleoli performed on 100 cells in different fields showed an increase of 204.3% in cells incubated in the presence of D-Glucose 0.6% compared to corresponding controls. The aortic fibroblasts submitted to glucotoxicity (0.6%) for 7 days showed large morfological and functional variations marked mainly by the size that appeared to be enhanced; cytosolic vacuolization due to oncosis; densitification chromatin and a fragmented nuclei, indicating apoptosis (See Figures 13, 14).
3.2.3. Determination of Total Nitrite
The rate of total nitrite found in the intracellular compartment of adventitial fibroblasts submitted to D-Glucose at 0.6%, showed a significant increase compared to
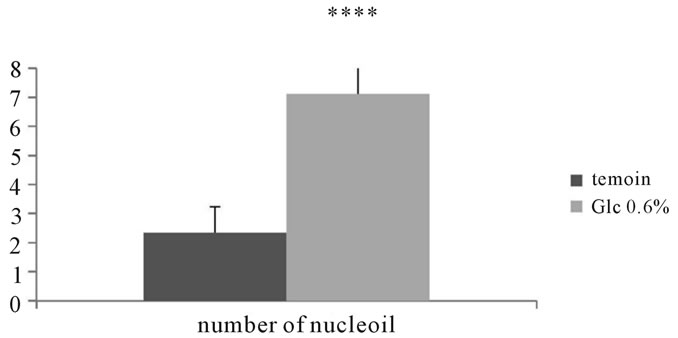
Figure 13. Number of nucleoli in adventitial fibroblasts of Psammomys obesus incubated in the presence of D-Glc to 0.6% for 7 days.
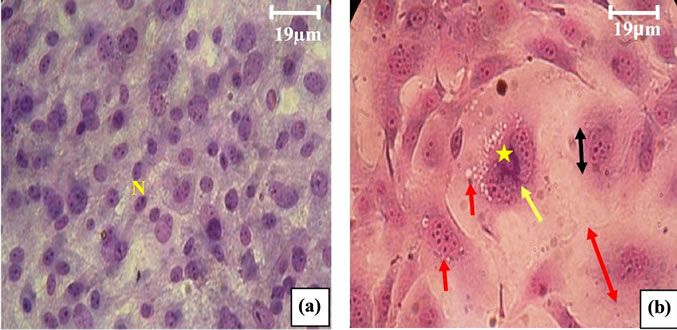
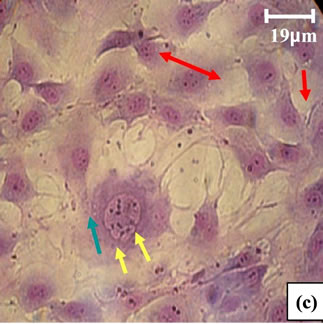
Figure 14. (a) Aoritc Fibroblasts of control Psammomys obesus (G × 525); (b) and (c) aortic Fibroblasts of Psammomys submitted to 0.6% D-Glc for 7 d (G × 525). ( ) Increase size of fibroblast, (
 ) nuclei large, (
 ) number of nucleoli very important, (
 ) vacuolization of the cytoplasm, (
 ) hypercondensation of chromatin, (
 ) nuclear fragmentation.
corresponding controls (P < 0.0001) (See Figure 15).
3.2.4. Assays of Lipid Peroxidation Products
Our results showed a very significant increase in the rates of lipid peroxidation products in the intracellular compartments of adventitial fibroblasts submitted to D-Glucose at 0.6% compared to corresponding controls (p < 0.0001) (See Figure 16).
3.2.5. Assays of Total Protein and Collagen
3.2.5.1. Determination of total protein The assessment of total protein in the intraand extracellular compartment of adventitial fibroblasts incu-
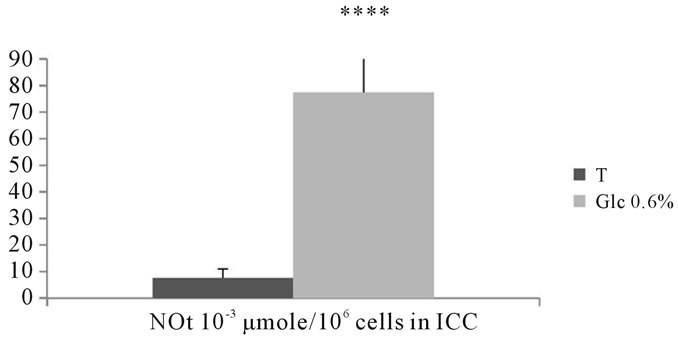
Figure 15. Evaluation of total nitrite (×10−3 μmole/106 cells) contained in intracellular compartments of aortic fibroblasts of Psammomys obesus in culture incubated in the presence of 0.6% D-Glc for 7 days.
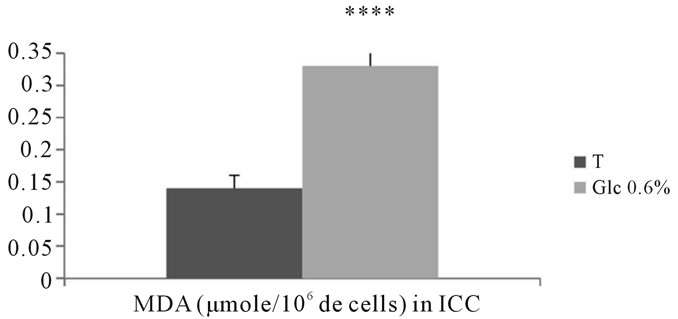
Figure 16. Evaluation of MDA levels (μmole/106 cells) contained in intracellular compartments of aortic fibroblasts of Psammomys obesus in culture, incubated in the presence of 0.6% D-Glc for 7 days.
bated in the presence of D-glucose at 0.6% for 7 days showed a significant increase compared to corresponding controls (P < 0.0001) (See Figures 17, 18).
3.2.5.2. Dosage of total collagens Assessing the amount of total collagen in the extraand intracellular compartments of adventitial fibroblasts incubated in the presence of D-Glucose at 0.6% for 7 days show a significant increase compared to control (P < 0.0001) (See Figures 19, 20).
3.2.6. Typage of Collagen Content in the ECC
Electrophoresis profiles showed the presence of 4 bands in the extracellular compartment, just as in treated control fibroblasts but at a different absorbance. The collagen III fibers were mainly represented by three chains α1, the collagen I fibers were represented by 2 chains α2 and 1chain α1. In our experimental conditions, we noted an increase in the bands absorbance corresponding to α1 chains of collagens I and III relative to the α2 chain of collagen I in the extracellular control fibroblast such as that of fibroblasts submitted to D-Glucose. The evaluation of the absorbance in the ECC fibroblasts submitted to D-Glucose 0.6% for 7 days indicated an increase in the absorbance of the bands as well as an increase in the absorbance of α1 chains of collagen I and III compared
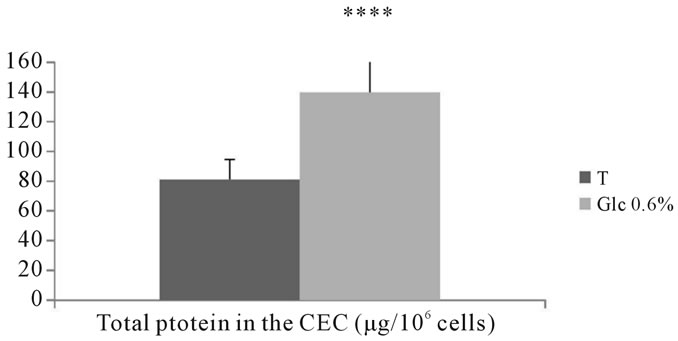
Figure 17. Assessing the amount of protein (µg/106 cells) in the extracellular compartment of aortic fibroblasts of Psammomys obesus incubated in the presence of 0.6% D-Glc for 7 days.
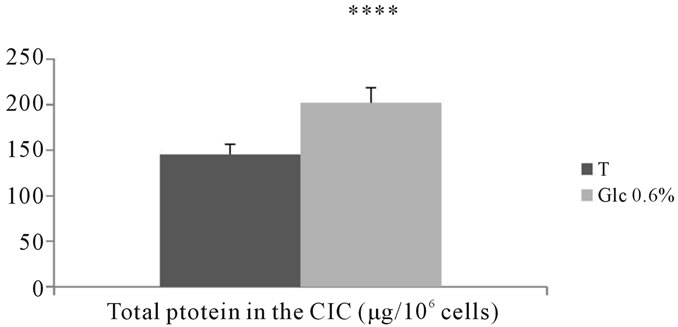
Figure 18. Assessing the amount of proteins (µg/106 cells) in the intracellular compartment of aortic fibroblasts of Psammomys obesus incubated in the presence of 0.4%, et 0.6% D-Glc for 7 days.
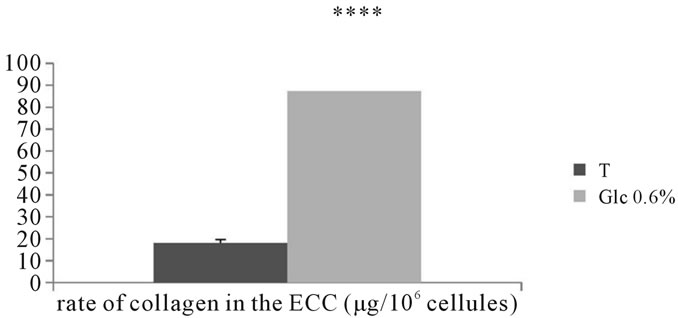
Figure 19. Evaluation of the total amount of collagen (µg/106 cells) in the extracellular compartment of adventitial fibroblasts in Psammomys obesus incubated in the presence of 0.6% DGlc for 7 days.
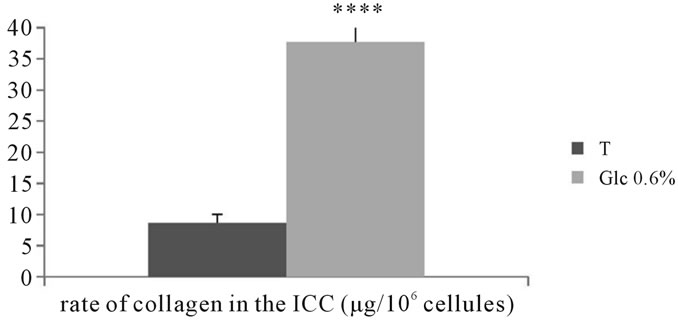
Figure 20. Evaluation of the total amount of collagen (µg/106 cells) in the intracellular compartment of adventitial fibroblasts in Psammomys obesus incubated in the presence of 0.6% D-Glc for 7 days.
to α2 chain of collagen I. Collagen III was thus more represented than collagen I (See Figure 21).
4. DISCUSSION
The long-term administration (11 months) of a highcarbohydrate diet caused both plasma and tissue disorders in Psammomys confirming its high sensitivity to caloric overload [14]. The elevation of body weight is associated with hyperinsulinemia that is lipogenic, the latter appeared in our animals after 3 months. Our results confirm the work of Aouichat et al. (2004) [7] in Psammomys subjected to a high carbohydrates diet, those of Shafrir. (2001) [15] and Ikeda et al. (2001) [16] in Psammomys subjected to a high-calorie diet.
In our study, we found a hyperglycemia from month 4 associated with hypertriglyceridemia, hypercholesterolemia and hyperinsulinemia characteristic of type 2 diabetes [7,15,16]. According to Stentz et al. (2005) [17] hyperglycemia is related to alterations in biochemical pathways responsible for micro-and macrovascular injuries related to endothelial dysfunction. Chronic hyperglycemia is associated with an increase of ROS by activating polyols pathways, hexoamines, activation of PKC family, formation of glycation end products that activate the transcription factor nuclear, NFKB [18]. According to Goel et al. (2007) [19], chronic hyperglycemia generates ROS such as superoxide ions via activation of PKC, which alters vascular permeability by decreasing the bioavailability of NO.
Our results show hyperinsulinemia in animals subjected to sucrose, associated with hyperglycemia. According to Marquie et al. (1984) [14], Shafrir (2001) [15], Ikeda et al. (2001) [16], progression of diabetes in Psammomys subjected to high-calorie diet increased from hyperinsulinemia to hyperinsulinemia associated with hyperglycemia then to a deficiency of insulin or insulinopenia due to apoptosis and necrosis of β cells. Insulin increases oxidative stress by overproduction of superoxide radical and decreased vascular NO. It activates the transcription factor NFkB by activating the PI3K pathway and plays a role in the induction of proinflammatory gene expression and promotion of the inflammatory process in the vascular tissue, the initial event being the recruitment monocytes in lesions where MCP-1 plays a key role [20]. Shafrir’s work (2001) [15] showed an increase in PKCξ in normoglycemic Psammomys, a marker of pre-diabetes compared to Psammomys resistant that do not develop diabetes.
Our results show the occurrence of dyslipidemia. Indeed, electrophoresis profile analysis of Psammomys plasma lipoproteins subjected to a high-carbohydrate diet showed a significant increase in LDL-VLDL at the end of the experiment, known as highly atherogenic lipopro-
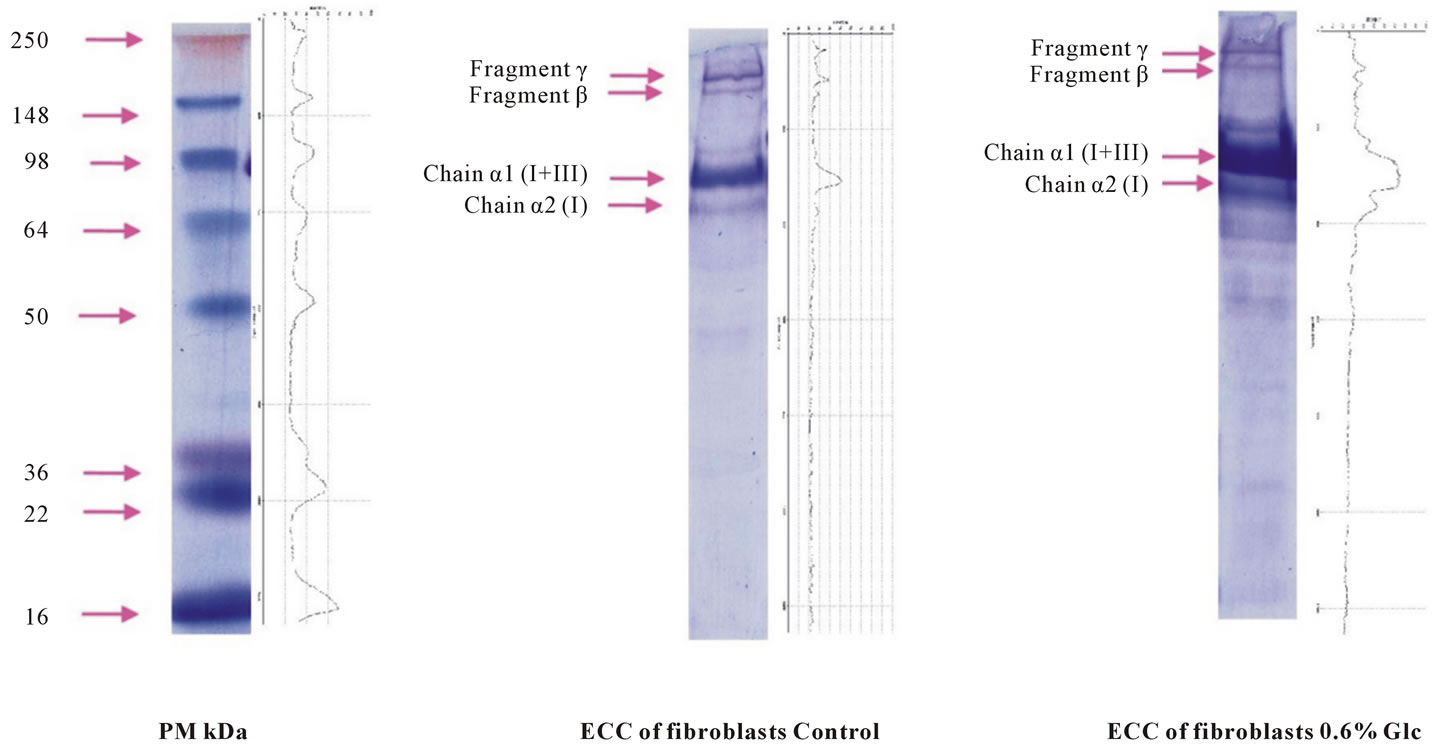
Figure 21. SDS-PAGE of collagen content in the extracellular compartment of both control and treated fibroblasts submitted to 0.6% D-Glc for 7 days.
teins since they carry esterified cholesterol to parietal cells [18]. Besides, we observed a decrease of HDL, which allows the efflux of cholesterol to the liver and are classified as cardioprotective molecules [21]. According to Shafrir (2001) [15], dyslipidemia may be responsible for insulin resistance via increased diacylglycerol (DAG), an intermediate product of esterification of fatty acids into triglycerides and the catabolism of the latter into fatty acids and glycerol. Hyperactivation and increased expression of PKC appear to be the consequence of hyperglycemia and the main cause of diabetic complications associated with hypertriglyceridemia [22] and hyperinsulinemia [23].
According Navab et al. (2002) [24], HDL decreases atherosclerosis by protecting LDL from oxidation. Epidemiological studies show a reverse correlation between the level of HDL-cholesterol and cardiovascular risk [25]. However, chronic hyperglycemia can induce glycation of HDL and impair their protective functions with regard to peroxidation, impair cholesterol transport and increase oxidation threshold, thus enhancing the atherosclerotic process [25].
According to Oldegren et al. (2003) [26], elevation of CPK is an indicator of cardiac complications in particular, marked by cellular necrosis. Our histological sections show SMCs and apoptotic or necrotic nuclei fibroblasts. In a state of necrosis, SMCs release enzymes and proteins in particular creatine phosphokinase into the blood stream. During a cardiac episode, increased CPK is systematic [27]. The latter remains a very sensitive marker since in myocardial infarction, its rate rises at the 4th hour, reaching 7 to 12 times its basic rate. Increased CPK reflecting cell lysis could be related to the increase of NO due to hyperglycemia and hyperlipidemia. NO induces apoptosis depending on cell type and concentration. At low doses, it is pro-apoptotique, whereas at higher concentrations, it induces necrosis [28].
In the intima, we observed a thickening of this layer, a hypertrophy of endothelial cells thus an alteration of their structure and functioning, a thickening of the subendothelial space presenting a fibrous material, indicating the formation of young plaques rich notably with collagen. These findings corroborate those of Orbe et al. (2003) [29] suggesting that chronic hyperglycemia induces endothelial dysfunction through reduced bioavailability of NO. Endothelial damage and ruptures of elastica interna are observed, which would increase intimal permeability allowing an increased passage of macromolecules into the intima thus contributing to its thickening [20].
In the media, we notice alterations characterized by thinning, loss of ondulation, disorganization and disruption of elastic laminae, reflecting vascular remodeling. These results are consistent with those of Lusis (2002) [30]. The elastolysis of the elastic plates and the the elastica interna may be due to the activation of several proteases. According to Lusis (2002) [30], degradation of elastin peptides may contribute to increased proteinemia, and to this end, our results showed that proteinemia in animals subjected to sucrose is significantly increased at the end of experimentation. Moreover, in regions close to the intima, we noted CML migration zones between interlamellar spaces within a completely disorganized matrix, extended interlamellar spaces with accumulations of collagen and probably lipid bodies. Hyperglycemia, by inducing endothelial dysfunction promotes the synthesis of adhesion molecule such as ICAM-1, VCAM-1, Eselectin and fibronectin, which facilitate the adhesion of monocytes to endothelium [30].
In the adventitia, we noticed a matrix rich in collagen and an important fibroblasts densification. These appear to undergo a phenotypic change associated with their migration to the media. Lesions of the vascular endothelium are responsible for the proliferation and dedifferentiation of fibroblasts ans CLM’s via activation of NADPH oxydase, for the release of ROS and that of the growth factors in particular PDGF, βFGF, IGF [31].
Our results on the proliferation of adventitial fibroblasts schoe those of Aouichat et al. (2004) [7] on aortic SMCs of Psammomys in the presence of 15 mM DGlucose for 48h and 4 passages. According to Neumann et al. (2002) [32], Heo et al. (2008) [33], the proliferative effect of D-Glucose is not related to changes in osmolarity, but rather to the activation of MAPKinase via the pathway ERK1/2, which regulates the activity of Erg-1 and which plays a role in proliferation and dedifferentiation of vascular cells [34].
In addition, our morphometric results show a significant increase in the number of nucleoli. This increase is indicative of increased synthesis of cellular protein. Benazzoug, (1998) [35] noted little change in total protein synthesis of incubated human fibroblasts 15Mm Glc. Hoffman et al. (1998) [36] noted that hyperglycemia stimulates the synthesis of many growth factors including TGF-β in mice mesangial cells. According to Ryoo et al. (2004) [37], activation of PKCθ after hyperglycemia activates the p38 pathway and the production of IL-8 via activation of AP-1 and the involvement of NFkB which increase DNA synthesis. Our morphologic resuls show an hypertrophy of fibroblasts submitted to D-Glucose. According to Grimm et al. (2002) [38], hyperglycemia induces a phenotypic change of SMC into hypertrophied phenotype. Liu et al. (2006) [39] have also observed a phenotypic change in cardiac myocyte into hypertrophied phenotype in the presence of D-Glucose, it is linked to increased ROS and would correspond to an adaptation phenomenon.
The hypercondensation of chromatin and nuclear fragmentations that we observed are signs of apoptosis. According to Babich et al. (1996) [40], ROS are responsible for hypercondensation of chromatin. ROS in particular superoxide ion ( ) allows interaction with the NO− and the genesis of peroxynitrite (ONOO-) a cause for damage to DNA. These are detected by the P53 tumor suppressor, to be overexpressed [41]. P53 is a molecular switch that detects DNA breaks and commits cells in the process of repair or apoptosis [41].
Cytoplasmic vacuolization that we observed likely to be linked to increased reactive oxygen species following glucotoxicity is the oncosis and it precedes apoptosis. Babich et al. (1996) [40] noted an important vacuolization characteristic of oncosis in fibroblasts exposed to ROS-producing agents. According to Babich and al. (2007) [42], induction of oncosis and apoptosis in fibroblasts treated with an agent that releases ROS is very important. Chen et al. (2000) [2] noted the increase in apoptosis in the myocardium of diabetic rats. Boumaza,(2011) [43] observed the oncosis and apoptosis in aortic fibroblasts of cultured Psammomys treated with hydrogen peroxide to 1.2 mM for 7d.
The protein contained in the CEC shows an increase compared to corresponding controls. Our findings corroborate those of Chen et al. (2000) [2], who noted an increase in matrix proteins, Benazzoug et al. (1998) [35] noted an increase in total collagen in human cutaneous fibroblasts incubated in 15 Mm Glc for 48 h. Aouichat et al. (2004) [7] also noted an increase in total collagen in SMCs of Psammomys incubated in 15 mM Glc for 48 h and 4 passages. The Typing of collagen showed an increase and intensification of bands corresponding to the γ fragments representing the trimer chain α1 (coll I and III), the β fragments representing the dimeric chain α1 (coll I and III), α1 chains (coll I and III) and α2 chain (coll I). Chen et al. (2000) [2] noted an increase in α1 chain after diabetes onset, Grimm et al. (2001) [38] have shown that hyperglycemia increases the extracellular matrix remodeling of cardiomyocytes. Andreea et al. (2008) [44] showed an increase of procollagen α2 (I) and procollagen α1 (III) at D-Glc concentrations of 11mM and 22mM but decreased procollagen α1 (III) at 33 mM of D-Glc. Hyperglycemia activates PKCβ, involved in the increased expression of TGF betal which initiates the accumulation of ECM [45].
In our study we assessed the effect of a glucotoxicity on the production of MDA, a marker of lipid peroxidation in the intracellular compartments of Psammomys adventitial fibroblasts in culture. According to Hayek et al. (2007) [46], D-Glc induces, in macrophages, oxidative stress by activating NADPH oxidase, thus increasing the production of superoxide ion which increases lipid peroxidation, including LDL. According to Whiteside and Dulgasz, (2002) [45], hyperglycemia increases the genesis of ROS via activation of the polyol pathway and glycation, leading to lipid peroxidation [46]. Lipid peroxidation mediated by ROS, mainly targets the polyunsaturated fatty acids located at the cell membrane fluidity modifying and altering membrane permeability, which also affects the functions of membrane proteins, inactivation of receptors of which and activation of some proteases lead to cell damage [47].
Glucotoxicity induced on the adventitial fibroblasts in the presence of 0.6% D-Glc for 7 days induces an increase in production of total nitrite in the intracellular compartments. According to Stentz et al. (2005) [17], hyperglycemia induced on T cells, increased synthesis of proinflammatory cytokines, which are responsible for the increase of NO by activation of iNOS. Kolb et al. (2001) [41], iNOS, present in all cell types require transcriptional induction, particularly by cytokines; iNOS, once synthesized, smoothly binds to calmodulin and produces larger quantities of NO and within a longer period of time (hours to days) than constitutive NOS which synthesize NO through short bursts in a response to rapid changes in intracellular Ca2+. The redox state of the cellular environment plays a key role in the anti-or proapoptotic NO effect.
5. CONCLUSION
The induction in vivo of long term glucotoxicity by addition of sucrose to 30% in Psammomys obesus establishes a type 2 diabetes, characterized by increased VLDLLDL, atherogenic factors, CPK, a marker of cardiovascular complications, as well as functional and structural alterations characterized by the remodeling of the intima and the media. Furthermore, the induction in vitro of glucotoxicity by addition of D-Glucose at supraphysiological dosages creates an oxidative stress characterized by an overproduction of MDA, marker of membrane lipid peroxidation and total nitrites. Morphological changes highlight the deleterious effects of glucotoxicity on adventitial fibroblasts in culture. The increased proliferation and the number of nucleoli and protein synthesis and collagens are linked to cell activation following glucotoxicity. The increase in collagen may be related to extracellular matrix remodeling in response to glucotoxicity. All these changes are factors inducing cardiovascular complications and accelerated atherosclerosis.
![]()
![]()
REFERENCES
- Pandolfi, A. and De Filippis, E.A. (2007) Chronic hyperglicemia and nitric oxide bioavailability play a pivotal role in pro-atherogenic vascular modifications. Genes Nutrition, 2, 195-208. doi:10.1007/s12263-007-0050-5
- Chen, S., Evans, T., Mukherjee, K., Karmazyn, M. and Chakrabarti, S. (2000) Diabetes-induced Myocardial structural changes: Role of endothelin-1 and its receptors. The Journal of Molecular and Cardiologie, 32, 1621- 1629. doi:10.1006/jmcc.2000.1197
- Goel, A., Zhang, Y., Anderson, L. and Rahimian, R. (2007) Gender difference in rat aorta vasodilation after acute exposure to hight glucose: Involvement of protein kinase Cβ an superoxide but not Rho Kinase. Cardiovascular Research, 76, 351-360. doi:10.1016/j.cardiores.2007.06.029
- Brunner, Y., Schvartz, D., Priego-Capote, F., Couté, Y. and Jean-Charles Sanchez, J.C. (2009) Glucotoxicity and pancreatic proteomics. Journal of Proteomics, 71, 576- 591. doi:10.1016/j.jprot.2008.10.002
- Andreea, S. I., Marieta, C. and Anca, D. (2008) AGEs and glucose levels modulate type I and III Procollagen mRNA synthesis in dermal fibroblastes cells culture. The Experimental Diabetes Research, 2008, 1-7. doi:10.1155/2008/473603
- Daly, M and Daly, S. (1973) On the ecology of Psammomys obesus (Rodentia gerbillidae) in the wadi saoura Algeria. Mammalia, 37, 546-561. doi:10.1515/mamm.1973.37.4.545
- Aouichat Bouguerra, S., Benazzoug, Y., Bekkhoucha, F. and Bourdillon, M. C. (2004) Effect of high glucose concentration on collagen synthesis and cholesterol level in the phenotypic modulation of aortic cultured smooth muscle cells of sand rat (Psammomys obesus). Experimental Diabetes Research, 5, 227-235. doi:10.1080/15438600490489793
- Martoja, R. (1967) Initiation aux techniques de l’histologie animale. Masson, Paris, 349 pages.
- Kinugawa, K., Shimizu, T., Yao, A., Kohmoto. O., Serizawa. T. and Takahashi, T. (1997) Transcriptional regulation of inducible nitric oxide synthase in cultured neonatal rat cardiac myocytes. Circulation Research, 81, 911- 921.
- Heath, R.L. and Packer, L. (1968) Photoperoxidation in isolated chloroplasts. I. Kinetics and stoichiometry of fatty acid peroxidation. Archives in Biochemistry and Biophysics, 125, 189-198. doi:10.1016/0003-9861(68)90654-1
- Grand, F., Guitton, J. and Goudable, J. (2001) Optimisation des parametres du dosage des nitrites et nitrates seriques par la technique de Griess. Annales de Biologie Clinique, 59, 559-565.
- Bradford, M. (1976) A rapid sensitive method for quantification of microgram quantities of protein utilizing the principe of protein dye binding. Anall of Biochemestry, 72, 248-254. doi:10.1016/0003-2697(76)90527-3
- Laemmli, U.K. (1970) Cleavage of structural proteins during the assembly of the head of bacteriophage T4. Nature, 227, 680-685. doi:10.1038/227680a0
- Marquie, G., Duhault, J. and Jacotot, B. (1984) Diabetes mellitus in sand rats (Psammomys obesus). Metabolic pattern during development of the diabetic syndrome. Diabetes, 33, 438-443. doi:10.2337/diabetes.33.5.438
- Shafrir, E. (2001) Albert renold memorial lecture: Molecular background of nutritionally induced insulin resistance leading to type 2 diabetes-from animal models to humans. The International Journal of Experimental Diabetes Research, 2, 299-319. doi:10.1155/EDR.2001.299
- Ikeda, Y., Olsen, G. S., Ziv, E., Hansen, L.L., Busch, A.K., Hansen Bo, F., Shafrir, E. and Mosthaf-Seedorf, L. (2001) Cellular mechanism of nutritionally induced insulin resistance in Psammomys obesus. Overexpression of PKC ξ in skeleletal muscle precedes the onset of hyperinsulinemia and hyperglycemia. Diabetes, 50, 584-592. doi:10.2337/diabetes.50.3.584
- Stentz, F.B. and Kitabchi, A.E. (2005) Hyperglycemiainduced activation of human T-lymphocytes with de novo emergence of insulin receptors and generation of reactive oxygen species. Biochemical and Biophysical Research Communication, 335, 491-495. doi:10.1016/j.bbrc.2005.07.109
- Clay, F.S. (2006) Insulin resistance and atherosclerosis. The Journal of Clinical Investigation, 116, 1813-1822. doi:10.1172/JCI29024
- Goel, A., Zhang, Y., Anderson, L. and Rahimian, R. (2007) Gender difference in rat aorta vasodilation after acute exposure to hight glucose: Involvement of protein kinase Cβ an superoxide but not Rho Kinase. Cardiovascular Research, 76, 351-360. doi:10.1016/j.cardiores.2007.06.029
- Dagre, A.G., Lekakis, J.P., Protogerou, A.D., Douridas, G.N., Papaioannou, T.G., Tryfonopoulos, D.J., Papamichael, C.M. and Alevizaki, M. (2007) Abnormal endothelial function in female patients with hypothyroidism and borderline thyroid function. The International Journal of Cardiology, 114, 332-338. doi:10.1016/j.ijcard.2005.12.013
- Schaffer, J.E. (2003) Lipotoxicity: When tissues overeat. Current Opinion in Lipidoogy, 14, 281-287. doi:10.1097/00041433-200306000-00008
- Schmiz-Peiffer, C., Browne, C.L., Oakes, N.D., Watkinson, A., Chisholm, D.J., Kraegen, E.W. and Biden, T.J. (1997) Alteration in the expression and cellulaire localization of protein kinase C isozymes ξ and θ are associated with insulin résistance in skeletal muscle of the hight-fat-fed rat. Diabetes, 46, 169-178.
- Avignon, A., Yamada, K., Zhou, X., Spencer, B., Cardona, O., Saba-Siddique, S., Galloway, L., Galloway, L., Standaert, M.L. and Farese, R.V. (1996) Chronic activation of protein kinase C in soleus muscle and other tissues of insulin-resistant type II diabetic Goto-Kakizaki (GK), obese/aged, and obese/Zucker rats: A mechanism for inhibiting glycogene synthesis. Diabetes, 45, 1396-1404. doi:10.2337/diabetes.45.10.1396
- Navab, M., Hama, S.Y., Reddy, S.T., Ng, C.J., Van Lenten, B.J., Laks, H. and Fogelman, A.M. (2002) Oxidized lipids as mediators of coronary heart disease. Current Opinion in Lipidology, 13, 363-372. doi:10.1097/00041433-200208000-00003
- Brewer, H.B. (2004) High density lipoprotein: A new potential therapeutic target for the prevention of cardiovascular disease. Arteriosclerosis Thrombosis and Vascular Biology, 24, 387-391. doi:10.1161/01.ATV.0000121505.88326.d2
- Oldegren, J., Wallentin, L., Grip, L., Linder, R., Norgaard, B.L. and Siegbahn, A. (2003) Miocardial damage, inflamemation and thrombin inhibition in unstable coronary artery disease. Eureupean Heart Journal, 24, 21-25.
- Baudouy, P.Y. and Beaufils, P. (1998) Diagnostic de l’infarctus du myocarde aigu. Encyclopédie Médicochirurgicale Cardiologie, Elsevier, Paris, Tome 2.1.
- Kim, P.K.M., Zamora, R., Petrosko, P. and Billiar, T.R. (2001) The regulatory role of nitric oxide in apoptosis. International Immunopharmacology, 1, 1421-1441. doi:10.1016/S1567-5769(01)00088-1
- Orbe, J., Rodriguez, J.A., Ardies, R., Belzunce, M., Nespereira, B., Pérez, I., Zarbe. M., Rancal, C. and Paramo, J.A. (2003) Antioxidant vitamins increase the collagen content and reduce MMP-1 in a porcine model of atherosclerosis: Implication for plaque stabilization. Atherosclerosis, 167, 45-53. doi:10.1016/S0021-9150(02)00392-1
- Lusis, A.J. (2000) Atherosclerosis. Nature, 407, 233-241. doi:10.1038/35025203
- Zwijsen, R.M., Japenga, S.C., Heijen, A.M., Van den Bros, R.C. and Koeman, J.H. (1992) Induction of platelet-derived growth factor chain a gene expression in human smooth muscle cells by oxidized low density lipoproteins. Biochemical and Biophysical Research. Communication, 186, 1410-1416.
- Neumann, S., Huse, K., Semrau, R., Diegeler, A., Gebhardt, R., Buniatian, G.H. and Scholz, G.H. (2002) Aldosterone and D-glucose stimulate the proliferation of human cardiac myofibroblasts in vitro. Hypertenstion, 39, 756-760. doi:10.1161/hy0302.105295
- Heo, K.J., Kim, D.U., Kim, L., Nam, M., Baek, S.T., Park, S.K., Park, Y., Myung, C.S., Hwang, S.O. and Hoe, K.L. (2008) Activation of PKCβII and PKCθ is essential for LDL-induced cell proliferation of human aortic smooth muscle cells via Gi-mediated Erk1/2 activation and Egr-1 upregulation. Biochemical and Biophysical Research Communication, 368, 126-131. doi:10.1016/j.bbrc.2008.01.050
- McCaffrey, T.A., Fu, C., Du, B., Eksinar, S., Kent, K. C., Bush, J.R., Kreiger, K., Rosengart, T., Cybulsky, M.I., Silverman, E.S. and Collins, T. (2000) High-level expression of Erg-1 inducible gene in mouse and human atherosclerosis. The Journal of Clinical Investigation, 105, 653- 662. doi:10.1172/JCI8592
- Benazzoug, Y., Borchiellini, C., Labat-Robert, J., Robert, I. and Kern, P. (1998) Effect of high-glucose concentrations on the expression of collagens and fibronectin by fibroblasts in culture. Experimental Gerontology, 33, 445- 455. doi:10.1016/S0531-5565(98)00015-1
- Hoffman, B.B., Sharma, K., Zhu, Y. and Zyadeh, F.N. (1998) Transcriptional activation of transforming growth factor-β1 in mesangial cell culture by high glucose concentration. Kidney International, 54, 1107-1116. doi:10.1046/j.1523-1755.1998.00119.x
- Ryoo, S.W., Kim, D.U., Won, C.M., Chung, K.S., Jang, Y.J., Oh, G.T., Park, S.K., Maeng, P.J., Yoo, H.S. and Hoe, K.L. (2004) Native LDL induces interleukin-8 expression via H2O2, p38 kinase, and activator protein-1 in human aortic smooth muscle cells. Cardiovascular Research, 62, 185-193. doi:10.1016/j.cardiores.2004.01.002
- Grimm, D., Jabusch, H.C., Kossmehl, P., Huberb, M., Fredersdorf, S., Griese, D.P., Kramer, B.K. and Kromer, E.P. (2002) Experimental diabetes and left ventricular hypertrophy: Effects of beta-receptor blockade. Cardiovascular Pathology, 11, 229-237. doi:10.1016/S1054-8807(01)00116-8
- Liu, X.J., He, A.B., Chang, Y.S. and De Fang, F. (2006) Atypical protein kinase C in glucose metabolism. Cell Signal, 18, 2071-2076. doi:10.1016/j.cellsig.2006.04.007
- Babich, H., Zuckerbraun, H.L., Wurzburger, B.J., Rubin, Y.L., Borenfreund, E. and Blau, L. (1996) Benzoyl peroxide cytotoxicity evaluated in vitro with the human keratinocyte cell line, RHEK-1. Toxicology, 106, 187- 196. doi:10.1016/0300-483X(95)03189-M
- Kolb, J.P. (2001) Rôle proet anti-apoptotique du monoxide d’azote, NO. C.R. Lifes Sciences, 324, 413-424.
- Babich, H., Zuckerbraun, H.L. and Weinerman, S.M. (2007) In vitro cytotoxicity of (−)-catechin gallate, a minor polyphenol in green tea. Toxicology, 71, 171-180.
- Boumaza, S., Neggazi, S., Hamlat, N., Sahraoui, H., Berdja, S., Smail, L., Kacimi, G., Gernigon, T., Benazzoug, Y. and Aouichat Bouguerra, S. (2011) Implication of hydrogen peroxyde in biochemical and morphological alterations of cultured adventitiels of Psammomys obesus. Journal of Cell and Animal Biology, 5, 76-88.
- Andreea, S.I., Marieta, C. and Anca, D. (2008) AGEs and glucose levels modulate Type I and III Procollagen mRNA synthesis in dermal fibroblastes cells culture. The Experimental Diabetes Research, 2008, 1-7. doi:10.1155/2008/473603
- Whiteside, C.I. and Dlugosz, J.A. (2002) Masangial cell protein kinase C isoenzyme activation in the diabetic milieu. American Journal Physiology Renal Physiology, 282, 975-980.
- Hayek, T., Kaplan, M., Kerry, R. and Aviram, M. (2007) Macrophage NADPHoxidase activation, impaired cholesterol fluxes, and increased cholesterol biosynthesis in diabetic mice: A stimulatory role for D-glucose. Atherosclorisis, 195, 277-286. doi:10.1016/j.atherosclerosis.2006.12.026
- Michel, F., Bonnefont-Rousselot, D., Mas, E., Drai, J. and Thérond, P. (2008) Biomarqueurs de la peroxydation lipidiques: Aspects analytiques. Annales de Biologie Clinique, 66, 605-620.