Journal of Signal and Information Processing
Vol.3 No.1(2012), Article ID:17669,9 pages DOI:10.4236/jsip.2012.31010
An Analytical Algorithm for Scattering Type Determination under Different Weather Conditions
![]()
Department of Physics, College of Science, Al-Mustansiriyah University, Baghdad, Iraq.
Email: {fatinezzat, dralialzuky, dr.amalhelou}@yahoo.com
Received September 29th, 2011; revised October 27th, 2011; accepted November 11th, 2011
Keywords: Rayleigh Scattering; Mie Scattering; RGB Bands; L-Component; Diurnal Intensity Variation
ABSTRACT
This paper describes an algorithmic method to investigate and analyze scattering types during different weather conditions. Scattering effects have been distinguished and tested by analyzing captured images at regular intervals. The analyzed process performed by measuring the average intensity values of the RGB-bands for a certain selected line of the captured images. These measurements are executed in Baghdad city in a steady state for the partly cloudy, hazy and clear days. Rayleigh and Mie scattering work attractively in these days. The adopted algorithm shows the symmetric behavior for RGB bands and L-component intensity distribution which caused by scattering types for both clear and partly cloudy days while it isn’t the case for the hazy one.
1. Introduction
Color of the atmosphere is much influenced by the spectrum of the sunlight, scattering/absorption effects due to particles in the atmosphere, reflected light from the earth’s surface and the relationship between the sun’s position and the viewpoint (and direction). The sunlight entering the atmosphere is scattered/absorbed by air molecules, aerosol and ozone layers. The characteristics of scattering depend on the size of particles in the atmosphere. Scattering by small particles such as air molecules is called Rayleigh scattering and scattering by aerosols such as dust is called Mie scattering. Light is attenuated by both scattering and absorption [1].
Physical processes in the scene have not been a strong point of interest in the traditional line of computer vision research. Recently, work in image understanding has been started to use intrinsic models of physical processes in the scene to analyze intensity or color variation in the image [2].
This paper presents an approach to image understanding that uses intensity measurements and shows how this intensity varies in an image during the natural diurnal variation of sunlight in the case of a partly cloudy, hazy and clear days.
2. Scattering Regimes
When the solar radiation in the form of electromagnetic wave hits a particle, a part of the incident energy is scattered in all directions as diffused radiation. All small or large particles in nature scatter radiation [3]. The scattering of the incident electromagnetic wave by a gas-phase molecule or by a particle mainly depends on the comparison between the wavelength (λ) and the characteristic size (d). We recall d » 0.1 nm for a gas-phase molecule, d Î [10 nm, 10 μm] for an aerosol and d Î [10, 100] μm for a liquid water drop. The wide range covered by the body size will induce different behaviors. Three scattering regimes are usually distinguished; Rayleigh scattering (typically for gases), the so-called Mie-scattering (for aerosols) and the scattering represented by the optical geometry’s laws (typically for liquid water drops) [4].
3. Rayleigh Scattering
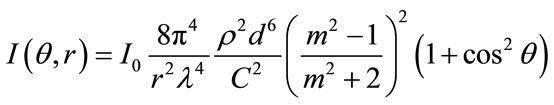
If d << λ (the case for gases), the electromagnetic field can be assumed to be homogeneous at the level of the scattering body. This defines the so-called Rayleigh scattering (also referred to as molecular scattering). The scattered intensity in a direction with an angle θ to the incident direction, at the distance r from the scattering body (Figure 1), for a media of mass concentration C, composed of spheres of diameter d and of density ρ , is then given by [4]
 (1)
(1)
I0 is the incident intensity. m is the complex refractive
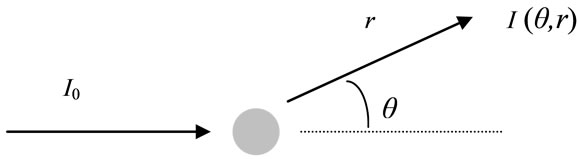
Figure 1. Scattering of an incident radiation (I0) [4].
index, specific to the scattered body; it is defined as the ratio of the speed of light in the vacuum to that in the body and depends on the chemical composition for aerosols. The above formula is inversely proportional to λ4 [4]. This wavelength effect can be seen in the blue color of the clear sky and the red color of the setting sun. The sky appears blue because the shorter wavelength blue light is scattered more strongly than the longer wavelength red light. The setting sun appears yellow towards red because much of the blue light has been scattered out of the direct beam [4,5].
Note that Rayleigh scattering is an increasing function of the size (d) and a decreasing function of the distance (r). Moreover, Rayleigh scattering is symmetric between the backward and forward directions [4]:
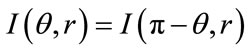 (2)
(2)
4. Mie Scattering
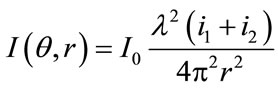
If d » λ (the case for most of atmospheric aerosols), the simplifications used above are no longer valid. A detailed calculation of the interaction between the electromagnetic field and the scattering body is required; this is given by Mie theory. The intensity of the scattered radiation in the direction with an angle θ to the incident direction, at a distance r, is [4]
 (3)
(3)
where i1 and i2 are the intensity Mie parameters, given as complicated functions of d/λ, θ and m. The parameters i1 and i2 are characterized by a set of maxima as a function of the angle θ. Note that the forward fraction of the scattering intensity is dominant (Figure 2) [4].
5. Optical Geometry
If d >> λ (this is the case of liquid water drops with respect to the solar radiation), the laws of optical geometry can be applied, leading to the understanding of many physical phenomena (e.g. rainbow formation). The scattering weakly depends on the wavelength [4].
6. Color Descriptions
There are three attributes usually used to describe a specific color. The first of these attributes specifies one of the colors of the spectral sequence or one of the non-
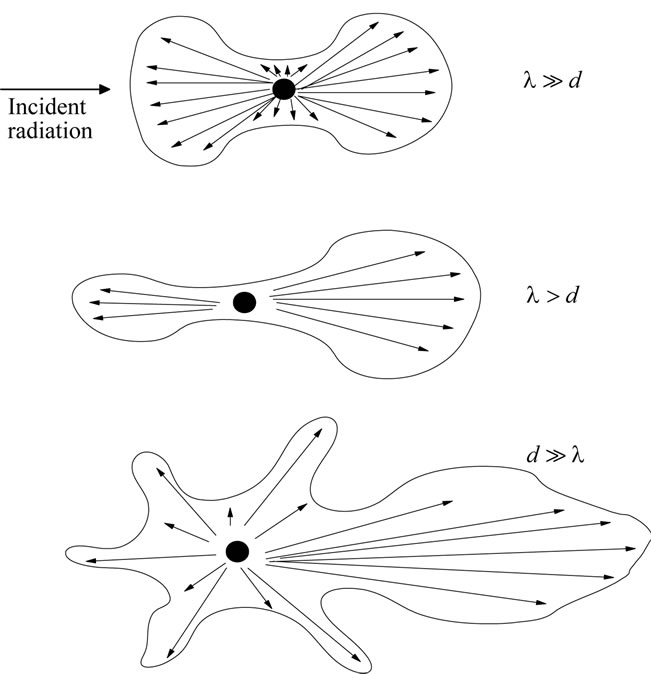
Figure 2. Scattering of an incident radiation of wavelength λ by an aerosol (gray sphere) of diameter d. The size of the vectors originating from the aerosol is proportional to the scattered intensity in the vector direction [4].
spectral colors such as purple, magenta, or pink. This attribute is variously designated in different descriptive systems as hue, dominant wavelength, chromatic color, or simply but quite imprecisely as color [6].
A second attribute of color is variously given as saturation, chroma, tone, intensity, or purity. This attribute gives a measure of the absence of white, gray, or black which may also be present. Thus the addition of white, gray, or black paint to a saturated red paint gives an unsaturated red or pink, which transforms ultimately into pure white, gray, or black as the pure additive is reached; with a beam of saturated colored light, while light may also be added but the equivalent of adding black is merely a reduction of the intensity [6].
For a color having a given hue and saturation, different levels variously designated as brightness, value, lightness, or luminance can be existed completing the three dimensions normally required to describe a specific color. It should be noticed that these terms do not have precisely the same meaning and therefore are not strictly interchangeable [6].
7. Image Data Analysis Methods
Computer image analysis largely contains the field of computer or machine vision, medical imaging, make a heavy use of pattern recognition, digital geometry, and signal processing. The applications of digital image analysis are continuously expanding through all areas of science and industry. Computers are indispensable for the analysis of image amounts of data for tasks that require complex computation or for the extraction of quantitative information [7].
Image analysis combines techniques that compute statistics and measurements based on the RGB intensity levels of the image pixels. In this process, the information content of the improved images is examined for specific features such as intensity, contrast, edges, contours, areas and dimensions. The result of analysis algorithms are feature vectors that give quantified statements about the feature concerned [8].
8. Intensity Image Measurement
An image is an array of the measured light intensities and it is a function of the amount of light reflected from the objects in the scene [9]. The color of a pixel is defined by the intensities of the red ( R), green (G) and blue (B) primaries. These intensity values are called the display tristimulus values R, G and B [6].
So, in order to measure the intensity, the following equation has been used [10-12].
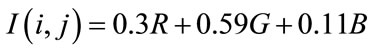 (4)
(4)
9. Image Acquisition Setup
The imaging system presented in Figure 3 consists of advanced HDD CCD (Sony Handycam DCR-SR85) rigidly mounted inside an inclined wooden box fixed with an angle near site’s latitude to the surface normal toward the south direction.
The wooden box was painted by gray paint with an aperture of 40 × 40 cm2. The scene is a colored test image located in the end of the wooden box facing window’s aperture. The captured images for the colored test image are of size (323 × 229) pixels.
10. Acquisition Data
Under steady weather conditions, three dates were selected through 2010 presented as partly cloudy (March 20), hazy (September 23) and clear (March 22) days. In such days, images have been captured at regular intervals from sunrise to sunset. This experiment has been executed in Baghdad city (Latitude 33.2˚N, Longitude 44.2˚E). Weather information for these days have been shown in Tables 1, 2 and 3 respectively.
11. Experimental Results and Discussions
Figure 4 shows one of the captured images with the selected horizontal line number (224) upon it. The line was selected in a white region in order to analyze the illuminance distribution for a homogeneous region upon the image. Figures 5-7 shows the corresponding intensities to the previous selected line from sunrise to sunset for the
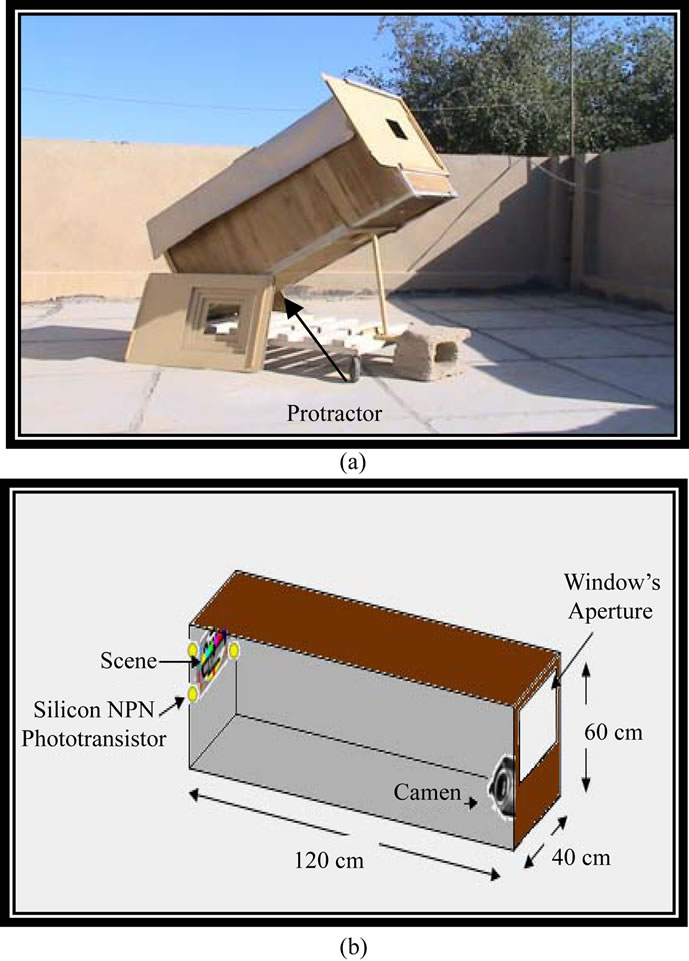
Figure 3. Schematic diagram of experimental setup.

Figure 4. One of the captured images at 7 AM in the hazy day presented in September 23, 2010 for the colored test image with the selected line number (224) upon it.
partly cloudy, hazy and clear steady weather conditions respectively. The x in intensity figures denotes line’s position upon the colored test image while I(x,y1) is the corresponding line’s intensity.
Weather situation affects attractively upon the intensity of the extracted line. Measurements of the color were made at each time based on the presence of the amounts of red, green and blue.
To all line’s intensity distribution and in a general point of view, it is found that the whole bands as well as
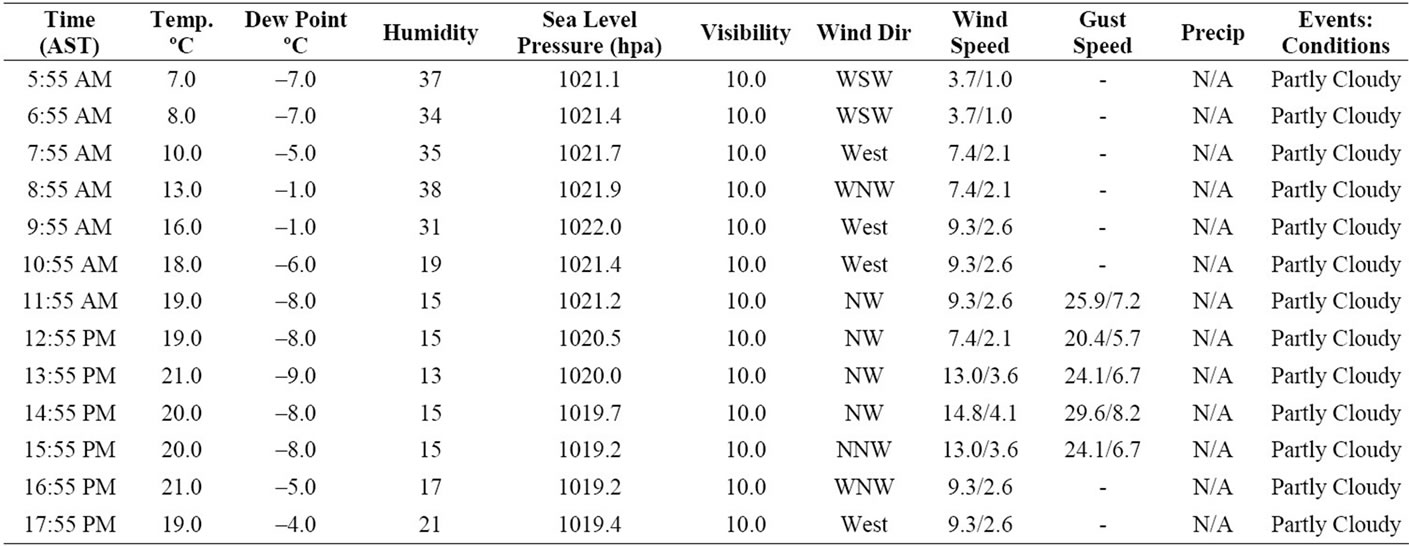
Table 1. Weather information for March 20, 2010 supplied by [13].
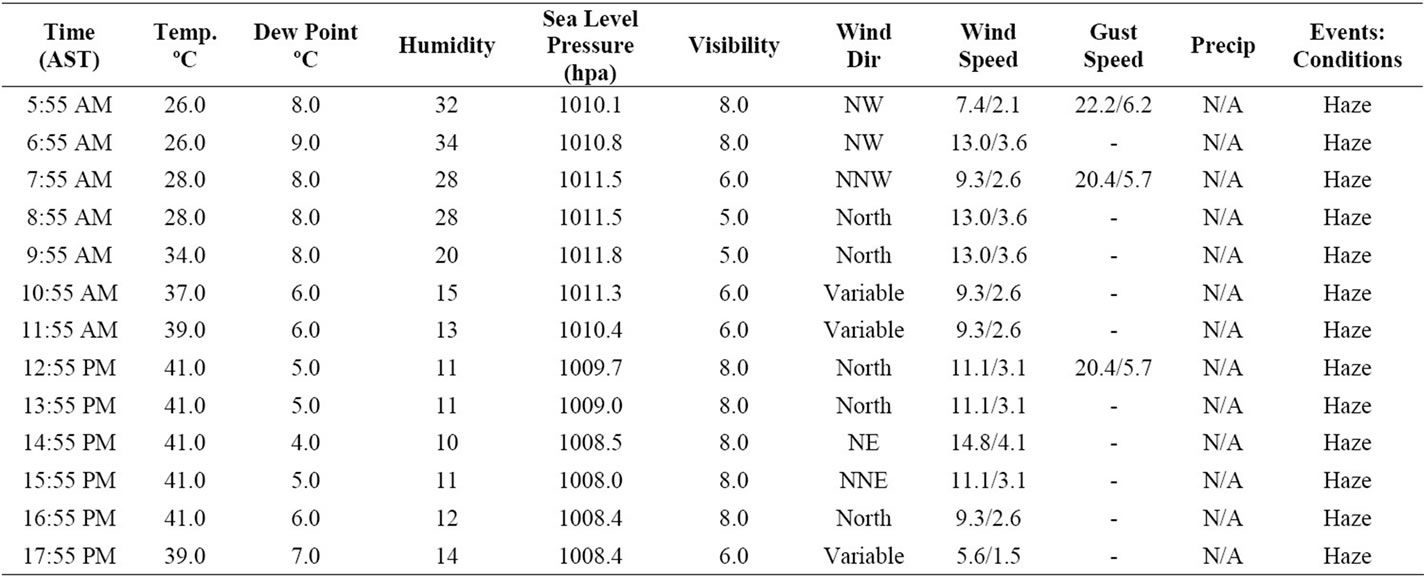
Table 2. Weather information for September 23, 2010 supplied by [13].
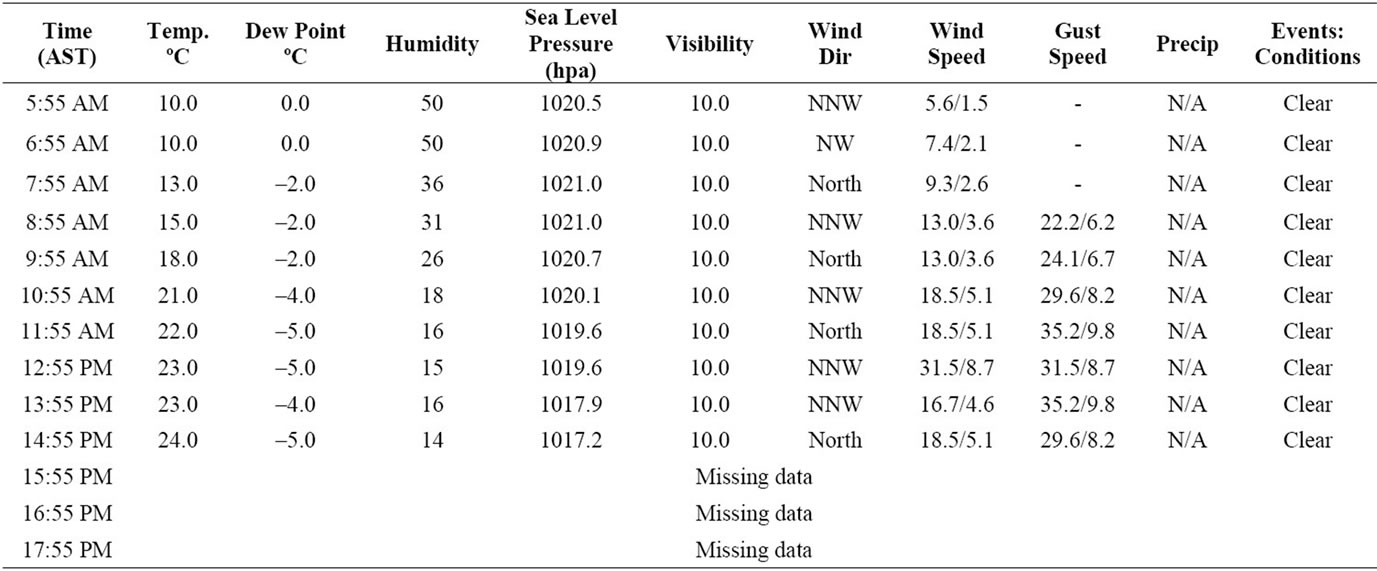
Table 3. Weather information for March 22, 2010 supplied by [13].
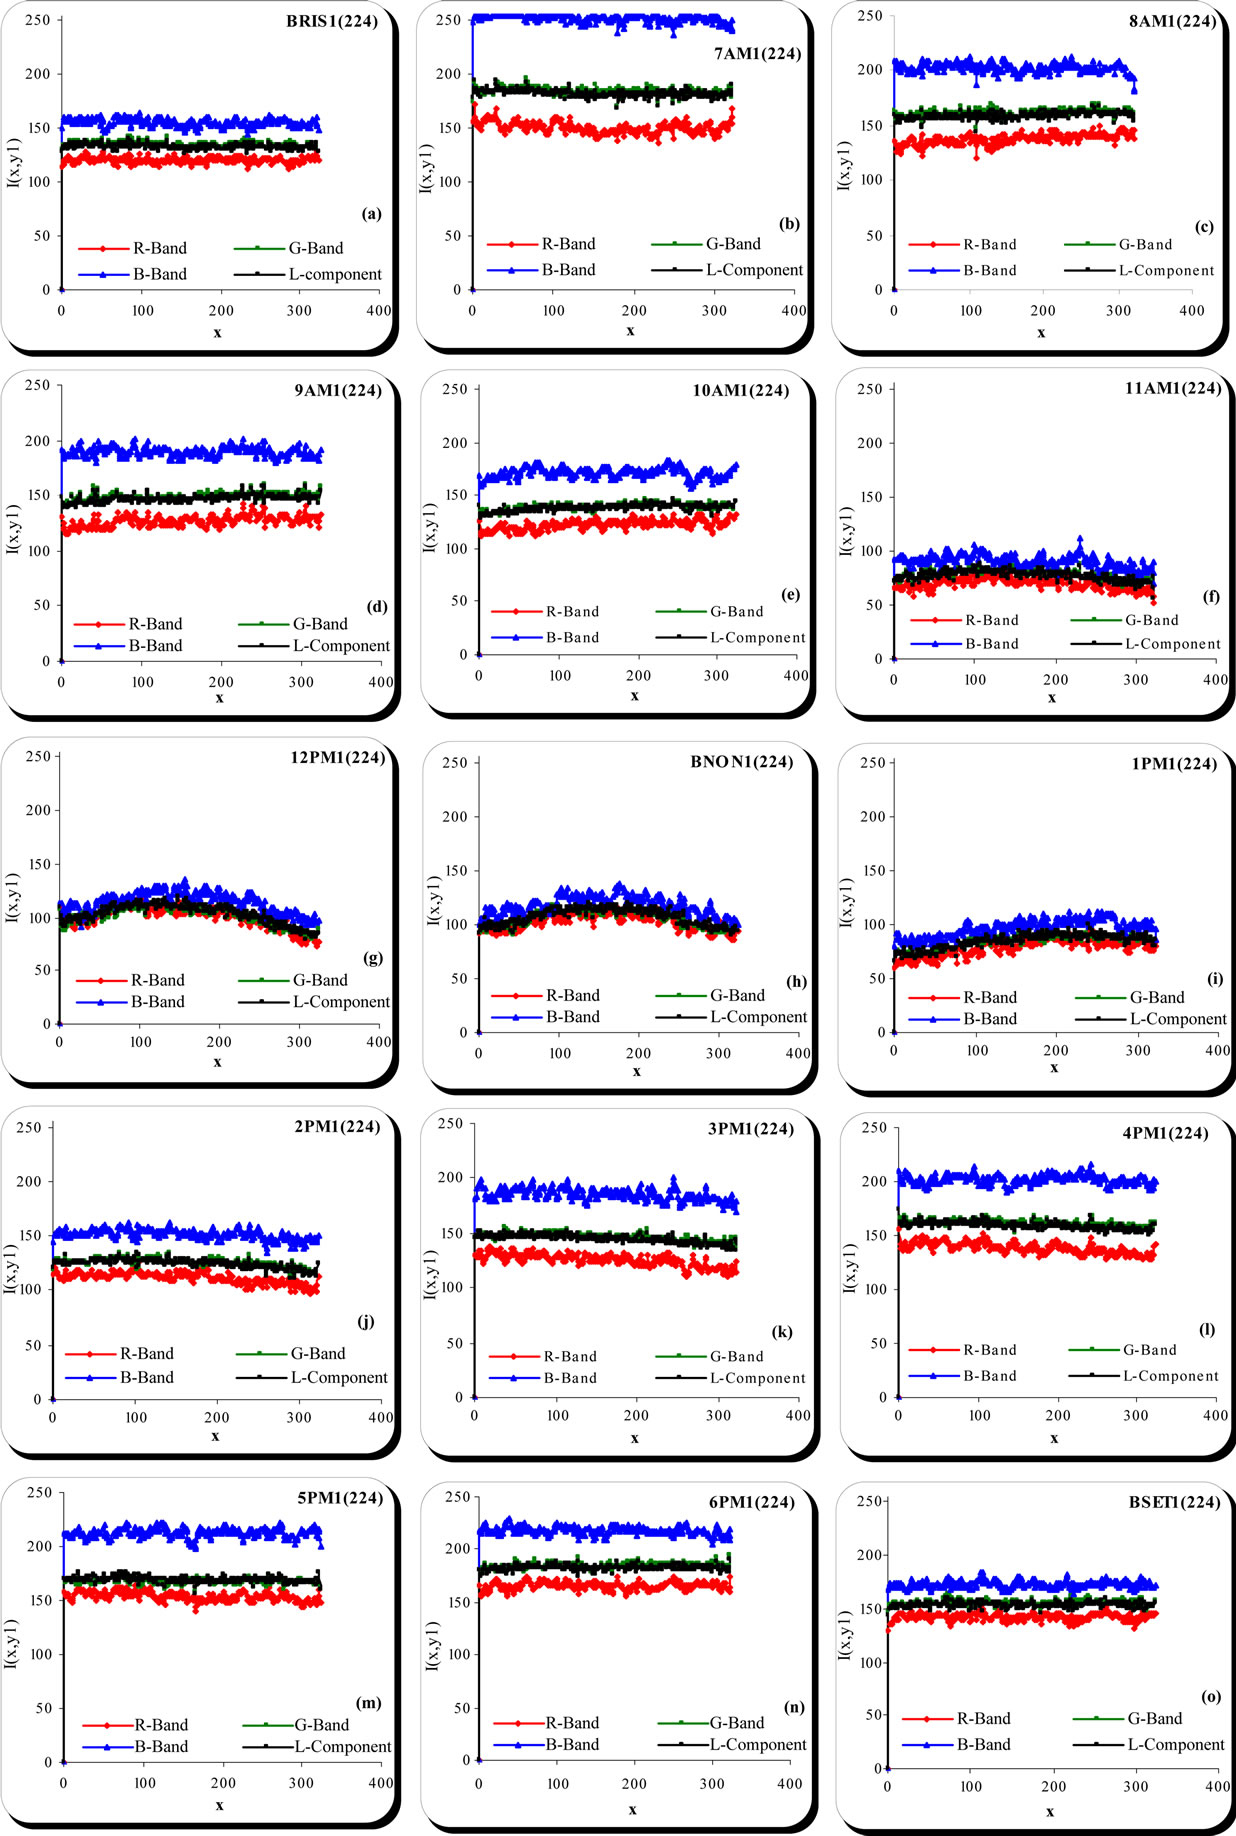
Figure 5. Diurnal intensity variation with time for the horizontal line number 224 extracted from each image captured from sunrise to sunset in a partly cloudy steady state for weather condition in March 20, 2010 by using a tilted angle equal to 33.2˚ and 40 × 40 cm2 of window’s aperture area.
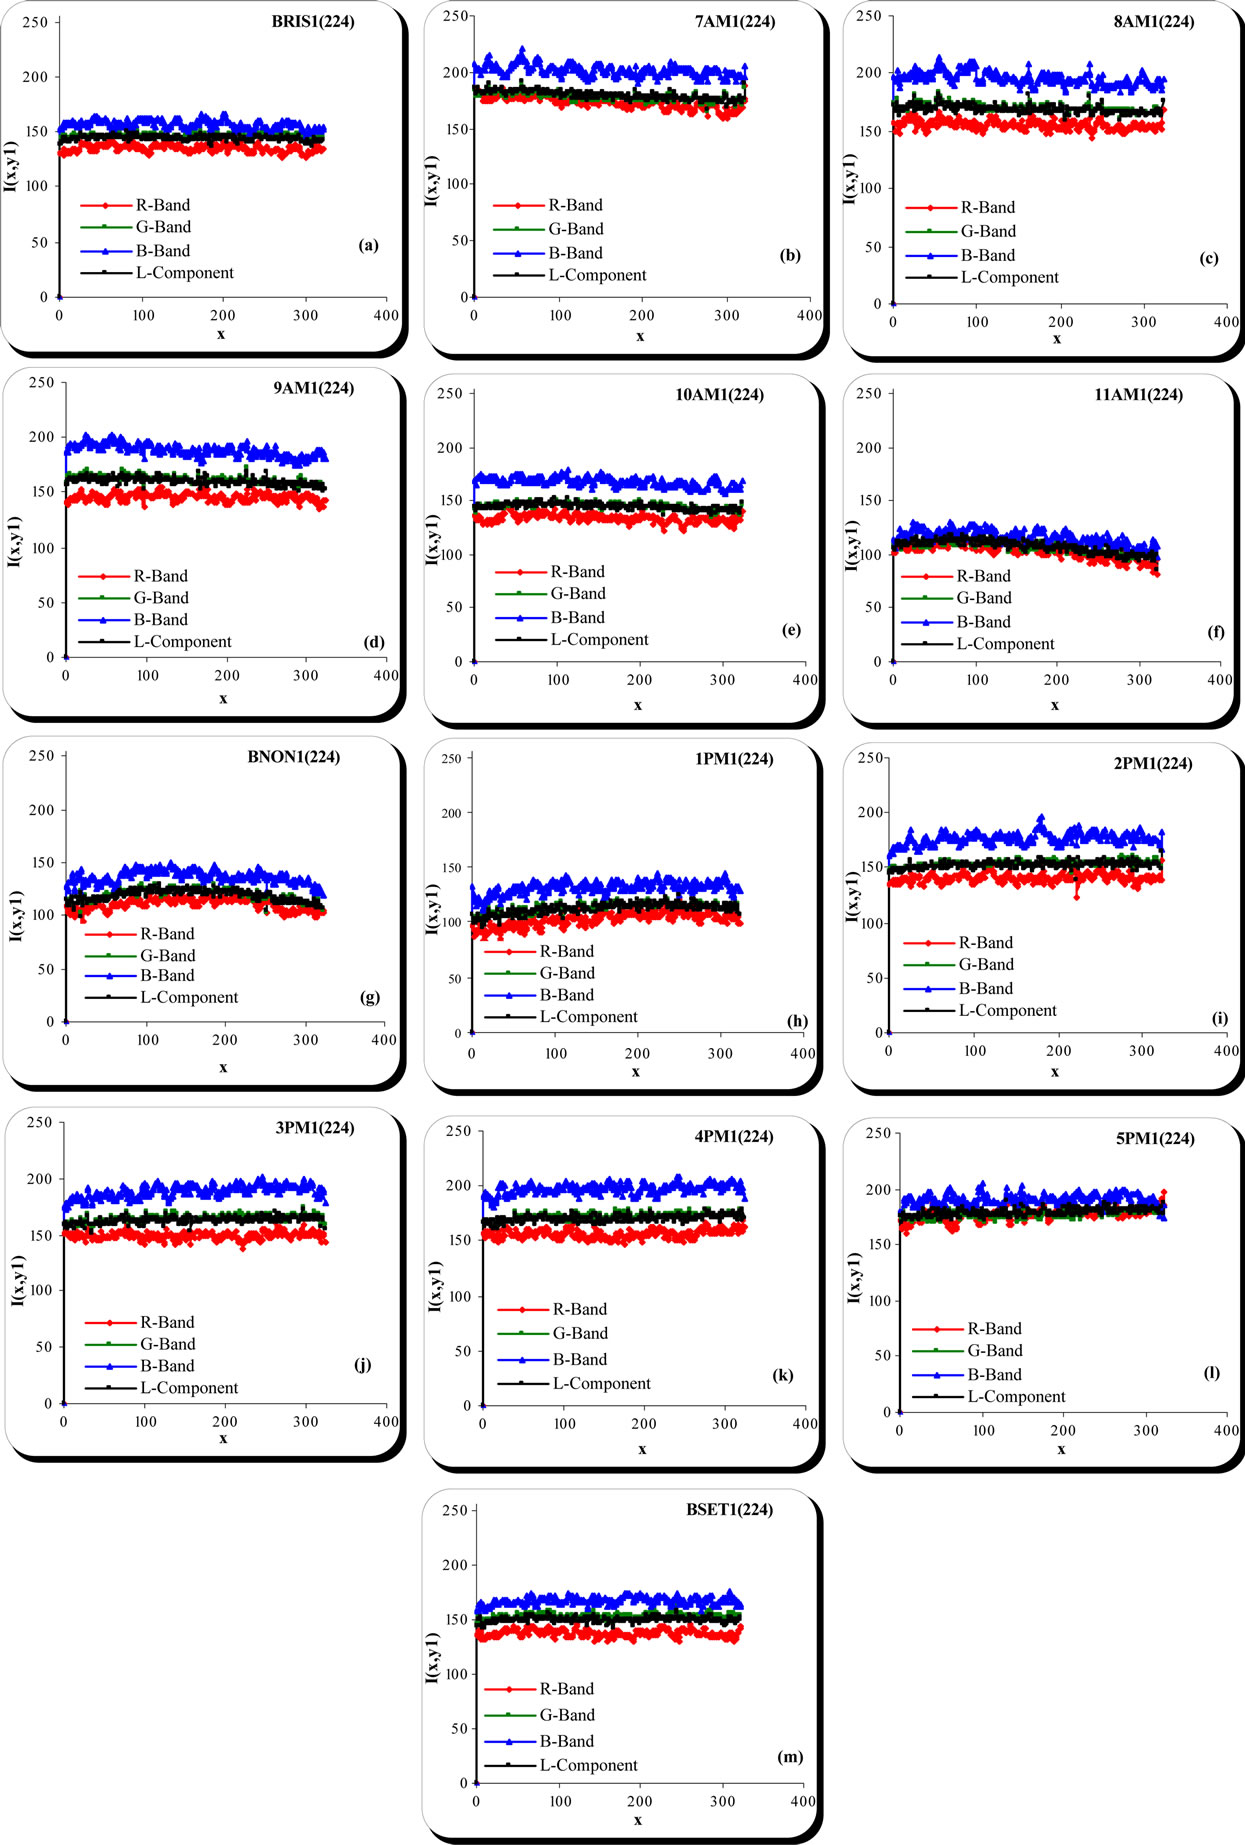
Figure 6. Diurnal intensity variation with time for the horizontal line no. 224 extracted from each image captured from sunrise to sunset in a steady hazy state for weather condition at September 23, 2010 by using tilted angle equal to 33.2˚ and 40 × 40 cm2 of window’s aperture area.
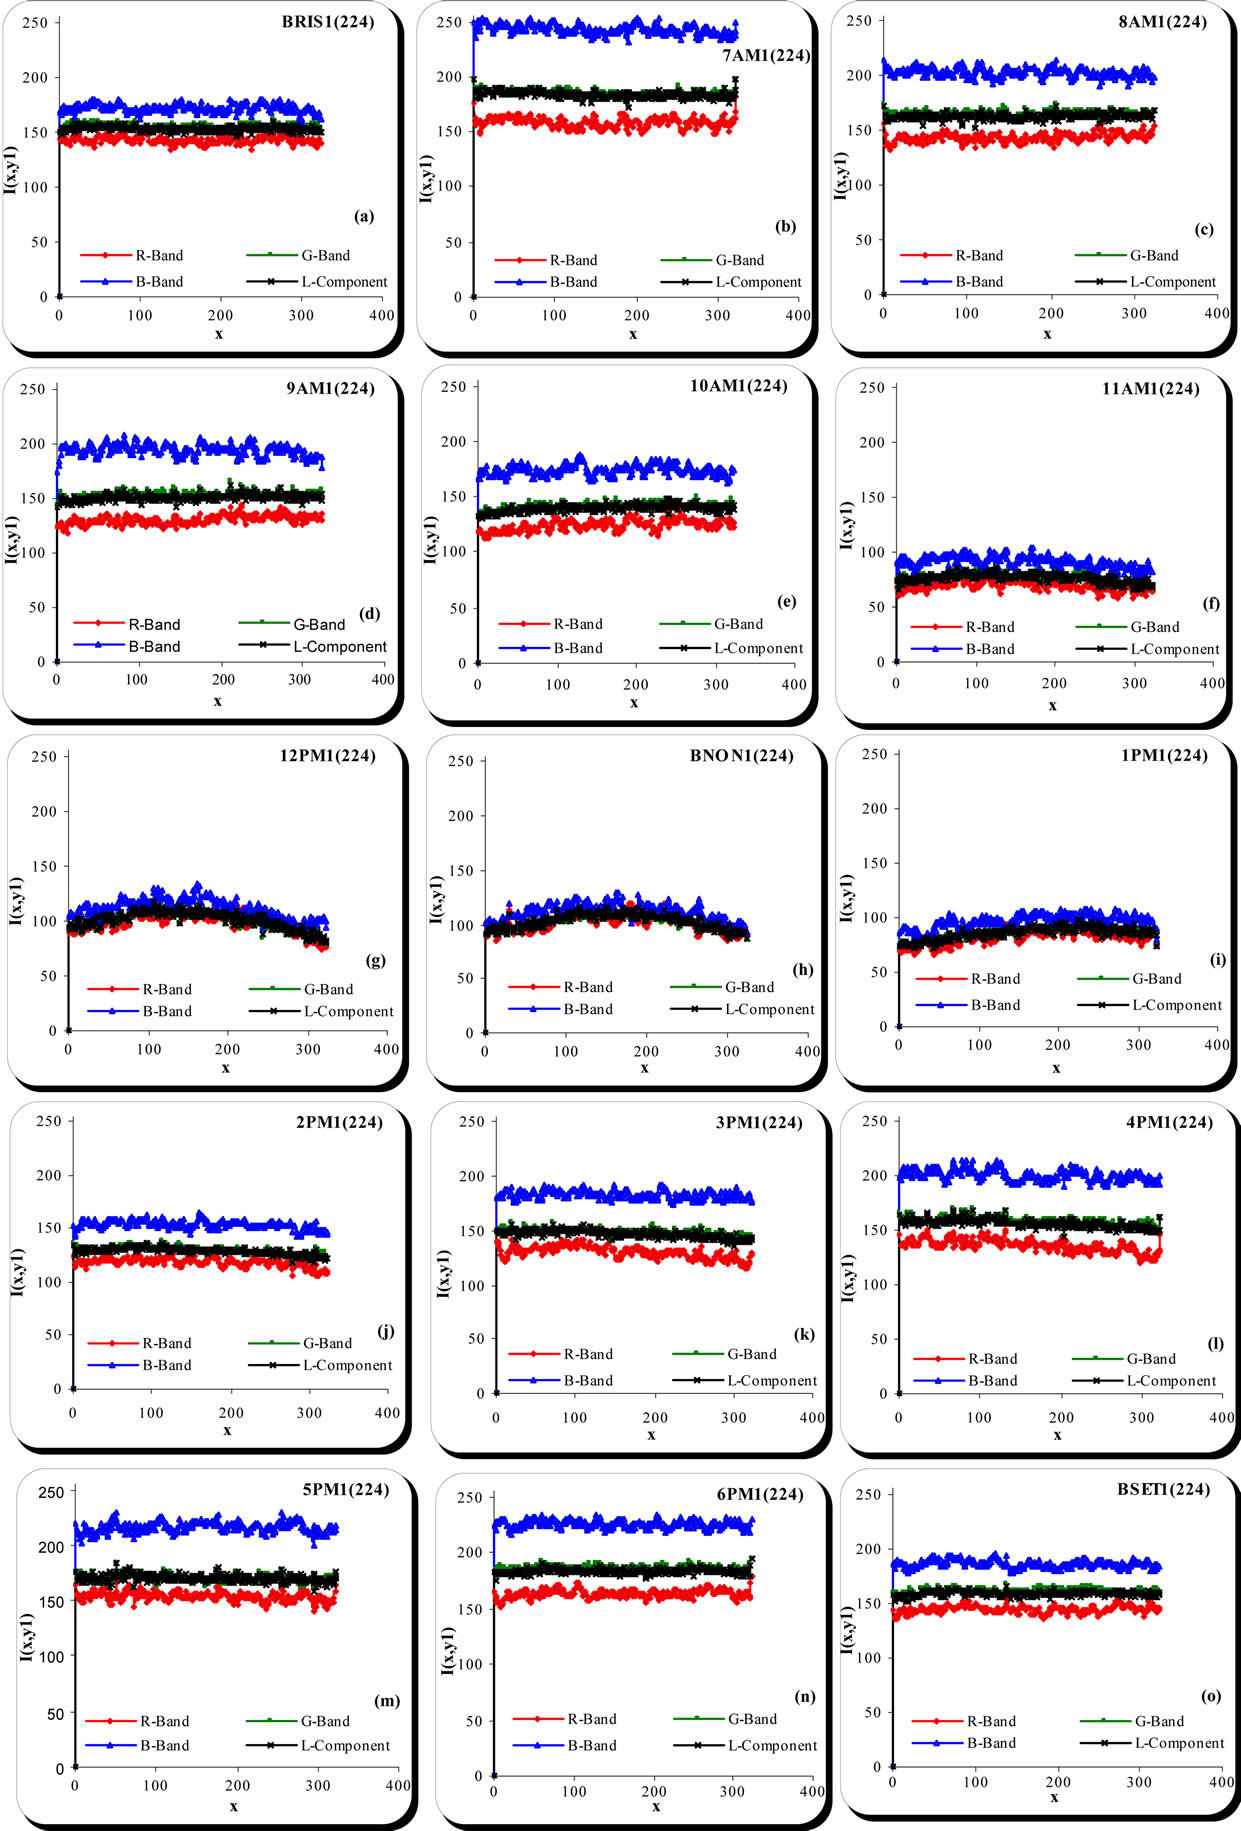
Figure 7. Diurnal intensity variation with time for the horizontal line no. 224 extracted from each image captured from sunrise to sunset in a steady clear weather condition in March 22, 2010 by using a tilted angle equal to 32.8˚ and 40 × 40 cm2 of window’s aperture area.
L-component sited in a situation such that B-band is the brightest one, red is the smallest and a coincidence effects for both G-band and L-component. The diurnal variation for line’s intensity can be best described by the next observations:
• At sunrise: the corresponding variation for intensity values occurred around the value 150. A noticeable separation (split) for the blue band can be seen in the partly cloudy day in Figure 5(a) to come closer gradually in the hazy day as shown in Figure 6(a).
• At 7 AM: Rayleigh scattering effect plays a strong role here. This obviously can be seen in the case of the partly cloudy day such that B-band reaches its highest value (i.e. 255) in Figure 5(b) to a decreased one in the hazy day around the value 200 in Figure 6(b).
• The period between 8 AM and 10 AM: a continuous separation between the RGB bands can be seen between its widest split in the partly cloudy day to narrowest one noticed in the hazy day with a decreasing state of the corresponding line’s intensity for each of the partly cloudy, hazy and clear days presented in the (c,d and e) for each of Figures 5, 6 and 7.
A significant role for weather condition can be noticed at 11 AM, solar noon and 1 PM. A coincidence state for line’s intensity for all bands and L-component in the partly cloudy and clear days can be noticed while an expectation one occurred in the hazy day; this can be discussed in the next observations:
• At 11 AM: the corresponding intensity value of the extracted line continuous in its decreasing state in the case of partly cloudy and clear days under 100 presented in (f) of Figures 5 and 7 respectively, while the expectation state occurred in the hazy day. In such day, Mie scattering takes an effect which appeared in the complete coincidence case for all bands above 100 in the intensity value. This is observed in Figure 6(f).
• At solar noon: in a general view, the corresponding line’s intensity curvatures in its shape for all bands. The effect of Mie scattering appeared strongly in the case of partly cloudy and clear days while it isn’t for the hazy one.
• At 1 PM: due to Mie scattering’s effect, a coincidence case for RGB bands with a decreasing curvature between 50 and 100 in the case of partly cloudy and clear days can be seen in (i) for Figures 5 and 7 respectively. In the hazy day presented in Figure 6(h), B-band begun to be separated with an increase in the corresponding line’s intensity value.
• The period between 2 PM and 4 PM and for all the selected days, Rayleigh scattering affects again. Its effect appeared in the noticeable separation between RGB bands that can be seen with a maximum split occurred in the partly cloudy day shown in (j, k and l) for Figure 5 and minimum one in the hazy day as in (i, j and k) of Figure 6. For all dates, the previous notice accompanied with a gradually increasing state occurred for the corresponding line’s intensity values.
• At 5 PM: it is similar to that presented in the above case with a significant split in the case of partly cloudy and clear days as in (m) of Figures 5 and 7 respectively and a small split near to coincidence in the hazy one can be obviously distinguished in Figure 6(l).
• At sunset hour: a distinct separation between bands caused by Rayleigh scattering can be seen. Among the adopted three days, a maximum split especially for B-band occurred at that time in the case of the clear day shown in Figure 7(o).
Rayleigh scattering is the dominant type of scattering at sunrise/sunset shapes in all figures. In such situation, the light from the sun does not saturate the CCD detector. The green was significantly brighter than the red and the blue is the brightest one. This is consistent with Rayleigh scattering which emphasizes the shorter wavelengths. The highest saturation occurred at early morning hour due to Rayleigh scattering (intensity value for B-band ≈ 255 as shown in Figure 5(b). The color after that becoming less saturated. This can be interpreted as blue mixed with an increasing fraction of white light, which is consistent with the light being a combination of Rayleigh and Mie scattering in intermediate times to the solar noon shown in (c,d,e,j,k) for all figures. As we approach the normality state of the sun’s direction to the acquisition system (at solar noon explained in (g & h) for each of Figures 5 and 7, Mie scattering accounts for a larger fraction of the total light and the Mie scattered light is essentially white, this is not the case at the hazy day. In such a day, Mie began to be appeared at 11 AM and 5 PM as in Figures 6(f) and 6(l) respectively.
12. Conclusion
For both the clear and partly cloudy days and from the previous observations, one can notice the symmetric behavior for RGB bands and L-component intensity distribution which is caused by different types of scattering while it isn’t the case for the hazy one. Thus, our measurement for intensity introduces and gives us an essential tool to prove the reality of the symmetric behavior for RGB bands and L-component intensity distribution which is caused by scattering types for the clear and partly cloudy days while it isn’t for the hazy one.
REFERENCES
- T. Nishita, T. Sirai, K. Tadamura and E. Nakamae, “Display of the Earth Taking into Account Atmospheric Scattering,” Proceedings of the 20th Annual Conference on Computer Graphics and Interactive Techniques, New York, 1993, pp. 175-182. doi:10.1145/166117.166140
- G. J. Klinker, S. A. Shafer and T. Kanade, “A Physical Approach to Color Image Understanding,” International Journal of Computer Vision, Vol. 4, No. 1, 1990, pp. 7-38. doi:10.1007/BF00137441
- Z. Şen, “Solar Energy in Progress and Future Research Trends,” Progress in Energy and Combustion Science, Vol. 30, No. 4, 2004, pp. 367-416.
- B. Sportisse, “Fundamentals in Air Pollution from Processes to Modelling,” Springer Science+Business Media, New York, 2010.
- R. H. B. Exell, “The Intensity of Solar Radiation,” King Mongkut’s University of Technology Thonburi, 2000. www.jgsee.kmutt.ac.th/exell/solar/intensity.rtf
- K. Nassau, “Color for Science, Art and Technology,” Elsevier Science B. V., The Netherlands, 1998.
- A. M. Al-Hillou, A. A. D. Al-Zuky and F. E. M. AlObaidi, “Digital Image Testing and Analysis of Solar Radiation Variation with Time in Baghdad City,” Atti Della Fondazione Giorgio Ronchi, ANNO LXV, No. 2, 2010, pp. 223-233.
- W. Osten, “Optical Inspection of Microsystems,” Taylor & Francis Group LLC., Boca Raton, 2007.
- J. R. Parker, “Algorithms for Image Processing and Computer Vision,” John Wiley & Sons, Inc., New York, 1997.
- C. B. Neal, “Television Colorimetry for Receiver Engineers,” IEEE Transactions on Broadcast and Television Receivers, Vol. BTR-19, No. 3, 1973, pp. 149-162. doi:10.1109/TBTR1.1973.299756
- H. Maruyama, M. Ito, F. Arai and T. Fukuda, “On-Chip Fabrication of Optical Multiple Microsensor Using Functional Gel-Microbead,” International Symposium on Micro-NanoMechatronics and Human Science, 11-14 November 2007, pp. 124-129.
- F. E. M. Al-Obaidi, “A Study of Diurnal Variation of Solar Radiation Over Baghdad City,” Ph.D. Thesis, Department of Physics, College of Science, Al-Mustansiriyah University, Iraq, 2011.
- Weather Underground Home Page. http://www.wunderground.com