Agricultural Sciences
Vol.08 No.07(2017), Article ID:77900,15 pages
10.4236/as.2017.87047
Quantitative Analysis of the Relationship between Ruminal Redox Potential and pH in Dairy Cattle: Influence of Dietary Characteristics
Yayu Huang1,2, Jean Philippe Marden3, Chaouki Benchaar4, Christine Julien3, Eric Auclair3, Corine Bayourthe1,2*
1Physiologie et Systèmes d’ Elevage, UMR1388 Génétique, Université de Toulouse INPT ENSAT, Castanet-Tolosan, France
2Physiologie et Systèmes d’ Elevage, UMR1388 Génétique, INRA, Castanet-Tolosan, France
3Phileo Lesaffre Animal Care, Marcq-en-Baroeul, France
4Agriculture and Agri-Food Canada, Sherbrooke Research and Development Centre, Sherbrooke, Canada

Copyright © 2017 by authors and Scientific Research Publishing Inc.
This work is licensed under the Creative Commons Attribution International License (CC BY 4.0).
http://creativecommons.org/licenses/by/4.0/


Received: June 8, 2017; Accepted: July 22, 2017; Published: July 25, 2017
ABSTRACT
The ruminal redox potential (Eh) can reflect the microbiological activity and dynamics of fermentation in the rumen. It might be an important indicator of rumen fermentation in combination with pH. However, the ruminal Eh has been rarely studied in dairy cows due to the difficulty of its measurement, and the relationship between ruminal Eh and pH is not clear. The objective of this study was to investigate the relationship between ruminal Eh and pH of dairy cows by meta-analysis of systematic measurements from different experi- ments. A database was constructed from 22 experiments on cannulated dairy cattle including 57 dietary treatments. The ruminal pH and Eh were measured without air contact between 0 and 8 h post-feeding. The results demonstrated a quadratic correlation between ruminal Eh and pH with a reliable within- animal variation (Eh = −1697 + 540.7 pH −47.7 pH2, nobservation = 70, nanimal = 26, P < 0.001, RMSE = 56, AIC = 597). The dietary characteristics (NDF, NDFf, OM, starch, degradable starch, soluble sugars contents, and the dietary ionic balance) influencing the ruminal pH also affected the ruminal Eh, but not always to the same extent. Some of them still influenced the relationship between ruminal Eh and pH. While the mechanism of the interaction between ruminal Eh and pH remains to be elucidated, it would be interesting to associate Eh to microbial profile, ruminal VFA concentration and milk produ- ction performance in future studies.
Keywords:
Redox Potential, pH, Rumen, Diet, Dairy Cow

1. Introduction
Oxidation-reduction conditions are classically assessed by measuring the redox potential (Eh), also called oxidation-reduction potential (usually named ORP) expressed in millivolts (mV). It measures the ability of a solution to accept or donate electrons and corresponds to the potential difference between a platinum electrode and a standard hydrogen electrode [1] . Oxidation-reduction and acid- base reactions are essential for the maintenance of all living organisms. The chemistry of living organisms relies even more on oxidation-reduction reactions than it does on acid-base reactions, which are more focused on proton transfers [1] [2] .
The role of Eh has been reported in many biological media such as dairy products [3] , wine [4] and rumen fluid [5] [6] [7] . The ruminal Eh can reflect the microbiological activity and dynamics of fermentation in the rumen [8] . As a matter of fact, ruminal Eh is a mixed potential because of the strong fermentative activity involving numerous oxido-reduction couples. It reflects a weighted average of the potentials contributed by each of the redox couples as mentioned by De Laune and Reddy [9] for soil. The ruminal milieu is anaerobic with an Eh markedly negative, reflecting a strong reducing power in absence of oxygen [6] . It has been reported that dry matter intake can cause an increase of Eh, and the higher Eh also seems to be associated with higher concentrate proportions in the diet and lower ruminal pH [7] , which may indicate digestive disorder. Indeed, a low Eh seems to be more favorable to the strict anaerobic bacteria such as fibrolytic and lactate utilizing bacteria [10] . Therefore, the ruminal Eh might be an important indicator of rumen function along with other ruminal variables. Until now, no threshold of ruminal Eh value has been proposed to evaluate rumen function. Since the ruminal pH is considered as the most direct indicator of the rumen digestive disorder and has been extensively studied [11] [12] , comparing with ruminal pH could be helpful to interpret ruminal Eh value.
However, compared to other ruminal parameters, the Eh is rarely discussed in dairy cows, and the relationship between ruminal Eh and pH is not clear. Indeed, the ruminal Eh measurement method is not standardized. Three methods of Eh potentiometric measurements have been reported in the literature. The first one consisted of a manual suction-strainer device that pumped out ruminal fluid from a cannulated animal to measure Eh on collected hand-samples in contact with atmospheric air, after a stabilization period of 25 to 30 min as recom- mended by Andrade et al. [13] and adapted by Giger-Reverdin et al. [14] . The two others are ex vivo measurements performed on continuously pumped rumen fluid without air contact [6] and in vivo measurements performed continuously by wireless probes inside the rumen as described by Penner et al. [15] and adapted by Qin et al. [16] . Considerable difference in ruminal Eh values has been reported. The major difference is due to the different reference electrodes used. By definition, Eh is the potential difference between a platinum electrode and a standard hydrogen electrode. Some authors [13] [17] who used a reference electrode of calomel or silver chloride did not correct the raw Eh data (+199 mV at 39˚C). Also, the accurate ruminal Eh measurement requires strict anaerobic conditions which are not always satisfied [6] .
For several years, our research team has conducted numerous experiments with simultaneous measurements of ruminal Eh and pH of dairy cows fed various diets under anaerobic conditions by ex vivo and in vivo methods. Analysis of these aggregated measurements could provide a better understanding of factors controlling ruminal Eh and pH, and might demonstrate a quantifiable relationship between ruminal Eh and pH. The objective of this study was to investigate the relationship between ruminal Eh and pH of dairy cows by meta-analysis of systematic measurements from different experiments.
2. Materials and Methods
2.1. Selection of Studies
A database was constructed from 22 experiments with cannulated dairy cattle including 57 dietary treatments (Table 1). As explained above, due to the heterogeneity of the ruminal Eh values reported in the literature, associated with time of measurement, anaerobic conditions and electrode used [5] [7] [8] [13] [14] [18] [19] , we included in the database only experiments conducted by our research group and two others conducted in Agriculture and Agri-Food Canada (Research and Development Centre, Sherbrook, QC) to ensure a consistency of measurement methods among studies. It includes either published [7] [18] [20] [21] [22] and unpublished studies [23] [24] . Both lactating (12 experiments) and non-lactating cows (10 experiments) were used. Qualitative factors such as physiological status of animals (lactating vs. non-lactating) and site of the experiment (France vs. Canada) were collected.
All animal housing and handling procedures were in accordance with the guidelines for animal research of the French Ministry of Agriculture [25] . Cannulation techniques provided for humane treatment of cows, adhering to locally approved procedures, and were similar to those described by Streeter et al. [26] . All animals were housed in individual tie stalls throughout the experiment with free access to water. Each experimental period covered an adaptation period (2 to 3 weeks) to the different dietary treatment and a measurement period (3 days).
The diets were formulated to meet energy and protein requirements, with two equal distributions at 0900 and 1700 h. The composition of the diets (Table 2) varied widely (e.g. the proportion of concentrate ranged from 0 to 63%). Some of the dietary characteristics such as neutral detergent fiber from forages (NDFf), ruminally degradable starch, rumen protein balance (RPB) were estimated by the

Table 1. Summarize of 22 experiments in the database.
1Nexp = number of experiments; 2Method 1 = measurements performed with probes on continuously pumped rumen fluid [6] ; Method 2 = measurements performed continuously with probes inside the rumen and wireless device [15] .
online software “systool.fr” [27] using the equations published in Sauvant and Nozière [28] . The influence of dietary ionic balance on acid-base balance of animal has been reported [29] [30] [31] , it can be expressed (in mEq/kg of DM) as the dietary cation anion difference (DCAD = Na + K-Cl-S) or electrolytic balance (EB = Na + K − Cl). We also calculated these values according to the INRA tables [32] for all the diets used in the data base.
2.2. Measurement of Ruminal Eh and pH
A total of 775 kinetics of ruminal Eh and pH measurements were gathered together. Each kinetic includes 9 measurements of ruminal pH and Eh taken at 1 h
Table 2. Descriptive variables of the diets composition (n = 57) for data set used in the meta-analysis.
DM = dry matter; OM = organic matter; RPB = rumen protein balance; NDF = neutral detergent fibre; NDFf = NDF from forages; CP = crude protein; DCAD = dietary cation anion difference (Na + K-Cl-S, in mEq/kg of DM); EB = electrolytic balance (Na + K − Cl, in mEq/kg of DM); SD = standard deviation.
intervals from the morning diet distribution to 8 hours after. The average Eh and pH of these 9 measurements have been calculated for each kinetic. The measure- ment of ruminal Eh and pH on each animal under each dietary treatment was repeated in three consecutive days during the measurement period.
All Eh and pH values were measured under strict anaerobic conditions, by ex vivo (Method 1) [6] , or in vivo method (Method 2) [15] . In Method 1, rumen fluid was pumped continuously through a rubber tube into a 50-mL-double- walled thermo controlled vessel outside the rumen, the Eh and pH were measured by electrodes dipped in the collected rumen fluid without air contamination. In Method 2, a wireless real-time data logger (Dascor, Escondido, CA, USA) was submersed into the ventral rumen sac via the ruminal cannula after calibration, and the Eh and pH were measured by external sensors of the data logger and stored in the memory chip. For both methods, the accuracy Eh electrode was checked by measuring the standard solution at 220 mV (Fishier Scientific) before and after each measurement.
Considering both methods used an Eh platinum electrode, all records of the potential difference were corrected relative to the standard hydrogen electrode (+199 mV at 39˚C) [33] . Moreover, as Huang et al. [34] observed an effect of the method on the Eh value, due to the difference of sensors and location of measurements, the Eh values measured by Method 2 were corrected (+35.4 mV) to avoid the influence of method effect.
2.3. Statistical Analysis
Interpretation of the database was based on a statistical meta-analysis [35] [36] . At each step of the meta-analysis process, graphical observations were made to check the coherence of relationships and to identify obviously abnormal values. All analyses were performed using the statistical software R version 2.15.1 (R Development Core Team, 2012).
2.3.1. Influence of Dietary Characteristics on Eh and pH
The average Eh and pH of each dietary treatment were calculated for this analysis. The experiment effect was considered to be random. The within-experiment correlation was calculated using a mixed model. The general form of the mixed model was:

where i = number of studies, j = number of observations, B0 + B1Xij is the fixed effect part of the model and si + biXij+ eij is the random effect part of the model. The goodness of fit of the model was evaluated using the Akaike Information Criterion (AIC) [37] . Because a reliable within-experiment response requires a minimal variation of descriptive variables, only the experiments tested a sufficient range of dietary characteristics (OM > 25 g/kg, starch > 70 g/kg, soluble sugar > 20 g/kg, CP > 18 g/kg, NDF > 80 g/kg, DCAD > 50 mEq/kg, EB > 100 m Eq/kg) were selected for within-experiment analysis.
For each relationship, the number of treatments (ntreat) and of experiments (nexp) used in the analysis are reported. Treatments with high normalized residuals (<−3 or >+3) were identified and discarded from the model as statistical outliers if they had a high leverage effect based on Hi calculation (Hi > 3× k/n, where k is number of independent variables in the model and n is the number of observations) and Cook distance (Cook > 1) [35] . A one-way ANOVA was used to test whether ruminal Eh or pH varied according to the qualitative factors such as physiological status and site of the experiment.
2.3.2. Relationship between Ruminal Eh and pH
Since the individualized ruminal Eh and pH measurements are available, the average Eh and pH of each animal in each dietary treatment (3 repetitions) were calculated to take into account the variability within one animal under different dietary treatments. Only the animals (70 observations from 26 animals) presenting a sufficient range of ruminal pH (≥0.2) were selected to this analysis. The within-animal correlation was calculated using a mixed model. The animal effect was considered to be random. The model was:

where i = number of animals, j = number of observations, B0 + B1Xij is the fixed effect part of the model and si + biXij+ eij is the random effect part of the model.
The influence of co-variables (OM, NDF, NDFf, total starch, degradable starch, CP, soluble sugars, DCAD, EB, and RPB contents in diets) on the relationship between ruminal Eh and pH was tested. The first step consisted in highlighting the co-variables influencing the residuals (i.e. the difference between observed Eh and predicted Eh by the equation). The influence of all co-variab- leson residuals (observed minus predicted Eh) was tested using the Stepwise procedure. In the second step of the analysis, the significant co-variables were included in the model.
3. Results
A summary of Eh and pH value in the database is given in Table 3. Both Eh (ranged from −233.4 to −99.6 mV) and pH (ranged from 5.48 to 6.76) covered a wide range.
3.1. Influence of Dietary Characteristics on Ruminal Eh and pH
Table 4 reports the relationship between ruminal Eh and dietary characteristics. Ruminal Eh was positively correlated to OM (P = 0.022), total starch (P = 0.012), degradable starch (P = 0.041), and soluble sugars (P < 0.001) contents, and negatively correlated to total NDF (P = 0.024), NDFf (P = 0.049), DCAD (P < 0.001), and EB (P < 0.001). The ruminal Eh was not related to CP (P = 0.713), and RPB (P = 0.209). No experiment tested the effect of intake and only two experiments tested a sufficient range of proportion of concentrate (≥30%), which did not permit the analysis of within-experiment relationship between ruminal Eh and these two parameters.
The quadratic adjustment was significant between ruminal Eh and DCAD ( , P = 0.010, RMSE = 9, AIC = 187)
Table 3. Summary of the redox potential and pH value in the database.
1SD = standard deviation.
Table 4. Relationship between ruminal redox potential and dietary characteristics.
OM = organic matter; DM = dry matter; RPB = rumen protein balance; NDF = neutral detergent fibre; NDFf = NDF from forages; CP = crude protein; DCAD = dietary cation anion difference (Na+K-Cl-S, in mEq/kg of DM); EB = electrolytic balance (Na + K − Cl , in mEq/kg of DM); nexp = number of experiments; ntreat = number of treatments; RMSE = residual mean standard error; AIC = akaikeinformation criterion.
and between ruminal Eh and EB ( , P = 0.003, RMSE = 8, AIC = 183). The ruminal Eh was significantly affected by physiological status (?188.5 ± 24.0 and ?169.1 ± 20.8 mV for non-lactating and lactating cows respectively, P = 0.002), but not affected by the site of experiment (P = 0.353).
Table 5 reports the relationship between ruminal pH and dietary characteristics. Ruminal pH was positively correlated to NDF (P = 0.008), NDFf (P = 0.012), DCAD (P = 0.004), and EB (P = 0.001), and was negatively correlated to OM (P = 0.018), starch (P = 0.004), degradable starch (P = 0.018), and soluble sugars (P < 0.001) contents. It was not related to CP (P = 0.195) and RPB (P = 0.518).
No quadratic adjustment was significant for relationship between ruminal pH and dietary characteristics (data not shown). The ruminal pH was significantly affected by physiological status (6.32 ± 0.25 and 5.99 ± 0.17 for non-lactating and lactating cows respectively, P < 0.001), but not affected by the measurement method of Eh (P = 0.942), and the site of the experiment (P = 0.950).
3.2. Relationship between Ruminal Eh and pH
The relationship between ruminal Eh and pH is presented in Figure 1. The ruminal Eh and pH were negatively correlated. The linear relationship (Equation (1)) and quadratic adjustment (Equation (2)) were both significant (P < 0.001):
 (1)
(1)
 (2)
(2)
3.3. Variables Influencing the Relationship between Ruminal Eh and pH
The intake (P < 0.001), soluble sugars contents (P = 0.008), DCAD (P = 0.003) were selected by the Stepwise analysis and significantly influenced the residuals
Table 5. Relationship between ruminal pH and dietary characteristics.
OM = organic matter; DM = dry matter; RPB = rumen protein balance; NDF = neutral detergent fibre; NDFf = NDF from forages; CP = crude protein; DCAD = dietary cation anion difference (Na + K-Cl-S, in mEq/kg of DM); EB = electrolytic balance (Na + K − Cl , in mEq/kg of DM); nexp = number of experiments; ntreat = number of treatments; RMSE = residual mean standard error; AIC = akaikeinformation criterion.
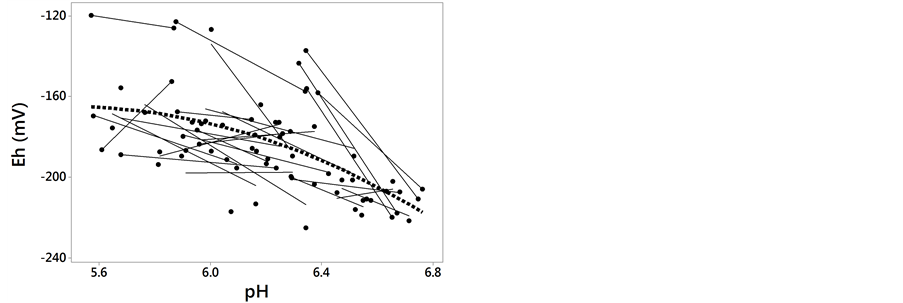
Figure 1. Relationship between ruminal redox potential (Eh) and pH. Each symbol represents the data from one animal in one experiment. The solid lines represent the linear regression of the data from each animal. The dotted line represents the average within-animal quadratic adjustment of all observations (Eh = ?1697 + 540.7 pH ?47.7 pH 2, nobservations = 70, nanimals = 26, P < 0.001, RMSE = 16, AIC = 597, R2 = 0.77).
of Equation (2). Once included in Equation (2), only the DMI was significant (P = 0.03) and slightly improved the equation:
 (3)
(3)
4. Discussion
Meta-analyses use scientific methods based on statistics to summarize and quantify knowledge acquired through previously conducted studies [35] . Until now, there is alimited number of studies reporting ruminal Eh measurements. Unlike a classical empirical modeling of biological responses based on exhaustive data collection from published experimental results, our study used the aggregation of measurements from our experiments in order to ensure the homogeneity of Eh values and avoided the considerable influence of measurement method explained previously. Use of such analysis leads to a better understanding of factors that controlling the variables.
The database of present study covered a wide range of ruminal Eh and pH values. The range of ruminal Eh value in dairy cattle in our database (−233.4 to −99.6 mV) is comparable with that in sheep (−260 to −150 mV) [8] [19] , in goat (−190 to −145 mV) [5] and in dairy cow (−241 to −185 mV) [38] . Some authors reported much lower ruminal Eh values: from −340 to −302 mV in sheep [17] and from −352 to −327 mV in goat [13] . It is due to the different reference electrodes used as explained above. The significant effect of physiological status on ruminal Eh and pH was expected and could be explained by dietary difference between lactating and non-lactating cows.
4.1. Dietary Characteristics Influencing Ruminal Eh
The influence of dietary concentrate proportion on ruminal Eh observed in previous studies [5] [8] [14] was not confirmed by our analysis due to the limited number of experiments (n = 2) presenting a sufficient range of dietary concentrate proportion. However, the variables associated with slowly or rapidly degradable materials contents (NDF, NDFf, OM, starch, degradable starch and especially soluble sugars, which resulted low RMSE and AIC) showed consistent correlation with ruminal Eh.
Few studies investigated the influence of these dietary characteristics on ruminal Eh. However, the effect of slowly or rapidly degradable diet on ruminal Eh has been reported. Andrade et al. [13] observed a higher ruminal Eh for the goats fed rapidly degradable diet (−327 mV) compared to that of goats fed slowly degradable diet (−352 mV). These Eh values were lower than ours due to the different reference electrodes used, but the difference of ruminal Eh caused by two type of diet was significant (P < 0.001). Our results are in agreement with these observations.
To our knowledge, the effect of dietary ionic balance (DCAD and EB) on ruminal Eh has never been reported. According to our results, the DCAD and EB showed consistent correlation with ruminal Eh. The quadratic adjustment of the within-experiment relationship resulted slightly higher AIC (187 and 183 for DCAD and EB respectively) but lower RSME (9 and 8 for DCAD and EB respectively). The mechanism of this effect remains unclear. But it is known that Eh can affect mineral availability. As demonstrated in soil, Eh is a factor that strongly influences the mobility of many elements such as N, P, S, K and Na. Conversely, Eh is influenced by the various elements [1] . Considering that the effect of dietary ionic balance was not investigated as a determining factor by the experiments in the database, it deserves to be confirmed by a classic experiment with in vivo measurements.
4.2. Dietary Characteristics Influencing Ruminal pH
The influence of OM, NDF, NDFf, starch, degradable starch and soluble sugars contents on ruminal pH is well documented. Among these variables, the relationship between NDF and starch content and ruminal pH are frequently studied. The relationship (y = 5.53 + 0.022x) between pH and diet NDF content (% DM) reported by Pitt et al. [39] is close to the relationship obtained in our study. By analyzing results from 23 studies of lactating dairy cows fed pasture, Kolver and de Veth [40] reported a within study equation between ruminal pH and NDF content (% DM) with a numerically lower slope than ours (y = 5.84 + 0.0075x, P = 0.014, n = 100), when taking into account the difference of unit of NDF (g/kg DM in our analysis). Regarding the influence of degradable starch in the rumen (% of intake dry matter) on ruminal pH (dairy and beef cattle), Sauvant and Peyraud [11] reported a similar relationship (y = 6.4 ? 0.01x) compared to ours.
The DCAD and EB are close (the only difference is that the EB does not consider sulfur ions) and highly correlated [41] . Both influence ruminal pH. Their influence on acid-base balance of animal has been described [42] . Indeed, Na and K are absorbed from the gastrointestinal tract in exchange for the secretion of a proton, whereas Cl and S are often absorbed in exchange for the secretion of a bicarbonate ion [31] [43] . Increasing DCAD in the diet allows the cows to overcome the saturation of the renal mechanisms for saving HCO3 and contributes to increase blood bicarbonate concentration which could be recycled into the rumen to limit the decrease of ruminal pH. Several studies reported that a shift from negative or null DCAD to highly positive values increases DMI and milk yield [42] [44] . A meta-analysis [30] grouping 27 experiments reported positive relationship between EB and blood pH, EB and bicarbonate content in blood, EB and pH of urine. Our results showed clear positive relationship between DCAD or EB and ruminal pH, which is in agreement with the hypothesis of the acid-base balance mechanism in ruminant. The equation between ruminal pH and DCAD obtained by our analysis is consistent with that of Iwaniuk and Erdman [45] , obtained by a meta-analysis of 63 published journal articles (y = 6.31 + 0.0003x, P = 0.034, r2 = 0.19, n = 83). Considering these results, DCAD and EB deserve to be more often measured and taken into account in future studies.
4.3. Relationship between Ruminal Eh and pH
The results of present study confirmed the negative relationship between ruminal Eh and pH reported by previous studies in goats [5] [13] [46] . The slope of the linear relationship in our study is similar to that of Giger-Reverdin et al. [46] . The lower average ruminal Eh value (−354 ± 22 mV) reported by these authors could be explained by the different measurement methods used as explained previously. By gathering together a large data base of wide range ruminal Eh and pH values, we further demonstrated a quadratic correlation Equation (2) between ruminal Eh and pH with a reliable within-animal variation of the variable. Considering that in biological media, such as rumen, many oxidation-reduc- tion reactions involve protons, it is not surprising that ruminal Eh and pH are related [1] [13] as is shown by the Nernst’s equation [47] .
It is noteworthy that the diet characteristics (NDF, NDFf, OM, starch, degradable starch, soluble sugars contents, and the dietary ionic balance) influencing the ruminal pH also affected ruminal Eh, but not always in same extent. Indeed, the complex reactions which determine Eh are not necessarily the same reactions which determine pH: for example, when rapidly-oxidizable organic matter is added, the Eh could be changed without changing pH [48] . Also, Friedman et al. [49] highlighted the Eh as a key factor in the structuring of anaerobic microbial communities through their experimental system separating Eh from pH effect.
In our database, we can observe some high pH values (e.g. pH > 6, without SARA according to the ruminal pH thresholds proposed in the literature) associated with high Eh which is unfavorable to activities of fibrolytic and lactate utilizing bacteria, and also some low Eh values associated with low pH (Figure 1). Therefore, in some circumstances, the Eh could better reflect the fermentation dynamics than pH and vice versa.
The measurement of ruminal pH alone might not be sufficient for diagnosing digestive disorder in some cases. The simultaneous measurement of ruminal Eh and pH could be useful to provide complementary information about the rumen fermentation. Nevertheless, no threshold has been proposed to evaluate the rumen digestive disorder. In order to initiate the use of ruminal Eh, we could propose a preliminary threshold of ruminal Eh > −166 mV (correspond to pH < 6 according to Equation (2)) indicating digestive disorder.
5. Conclusion
By gathering together a large database of uniformly measured ruminal Eh and pH under anaerobic conditions, the present study demonstrated a quadratic correlation between ruminal Eh and pH. The analysis highlights the influence of dietary characteristics on ruminal Eh. Within experiments, a good prediction of ruminal Eh could be made using soluble sugars content and the dietary ionic balance. The dietary characteristics (NDF, NDFf, OM, starch, degradable starch, soluble sugars contents, and the dietary ionic balance) influencing the ruminal pH also affected the ruminal Eh, but not always in same extent. Some of them still influence the relationship between ruminal Eh and pH. The mechanism of the interaction between ruminal Eh and pH remains to be elucidated; it would be interesting to associate microbial profile and ruminal VFA concentration and milk production performance in future studies.
Acknowledgements
We would like to thank Prof. Philippe Schmidely for his help in the statistical analysis of the results.
Cite this paper
Huang, Y.Y., Marden, J.P., Benchaar, C., Julien, C., Auclair, E. and Bayourthe, C. (2017) Quantitative Analysis of the Relationship between Ruminal Redox Potential and pH in Dairy Cattle: Influence of Dietary Characteristics. Agricultural Sciences, 8, 616-630. https://doi.org/10.4236/as.2017.87047
References
- 1. Husson, O. (2013) Redox potential (Eh) and pH as Drivers of Soil/Plant/ Microorganism Systems, A Transdisciplinary Overview Pointing to Integrative Opportunities for Agronomy. Plant Soil, 362, 389-417.
https://doi.org/10.1007/s11104-012-1429-7 - 2. Falkowski, P.G., Fenchel, T. and Delong, E.F. (2008) The Microbial Engines That Drive Earth’s Biogeochemical Cycles. Science, 320, 1034-1039.
https://doi.org/10.1126/science.1153213 - 3. Brasca, M., Morandi, S., Lodi, R. and Tamburini, A. (2007) Redox Potential to Discriminate among Species of Lactic Acid Bacteria. Journal of Applied Microbiology, 103, 1516-1524.
https://doi.org/10.1111/j.1365-2672.2007.03392.x - 4. Tomlinson, J.W. and Kilmartin, P.A. (1997) Measurement of the Redox Potential of Wine. Journal of Applied Electrochemistry, 27, 1125-1134.
https://doi.org/10.1023/A:1018407230924 - 5. Marounek, M., Bartos, S. and Kalachnyuk, G.I. (1982) Dynamics of the Redox Potential and rH of the Rumen Fluid of Goats. Physiologia Bohemoslovenica, 31, 369-374.
- 6. Marden, J.P., Bayourthe, C., Enjalbert, F. and Moncoulon, R. (2005) A New Device for Measuring Kinetics of Ruminal pH and Redox Potential in Dairy Cows. Journal of Dairy Science, 88, 277-281.
https://doi.org/10.3168/jds.S0022-0302(05)72685-0 - 7. Julien, C., Marden, J.P., Bonnefont, C., Moncoulon, R., Auclair, E., Monteils, V. and Bayourthe, C. (2010) Effects of Varying Proportions of Concentrates on Ruminal-Reducing Power and Bacterial Community Structure in Dry Dairy Cows Fed Hay-Based Diets. Animal, 4, 1641-1646.
https://doi.org/10.1017/S1751731110000972 - 8. Broberg, G. (1958) Measurements of the Redox Potential in Rumen Contents. IV. In vivo measurements. Nordisk Veterinaermedicin, 10, 263-268.
- 9. De Laune, R.D. and Reddy, K.R. (2005) Redox Potential. In: Hillel, D., Ed., Encyclopedia of Soils in the Environment, Elsevier Ltd., Amsterdam, 366-371.
https://doi.org/10.1016/B0-12-348530-4/00212-5 - 10. Pinloche, E., McEwan, N., Marden, J.P., Bayourthe, C., Auclair, E. and Newbold, C. J. (2013) The Effects of a Probiotic Yeast on the Bacterial Diversity and Population Structure in the Rumen of Cattle. PloS ONE, 8, e67824.
https://doi.org/10.1371/journal.pone.0067824 - 11. Sauvant, D. and Peyraud, J.L. (2010) Diet Formulation and Risk Assessment of Acidosis. INRA Productions Animales, 23, 333-342.
- 12. Plaizier, J.C., Khafipour, E., Li, S., Gozho, G.N. and Krause, D.O. (2012) Subacute Ruminal Acidosis (SARA), Endotoxins and Health Consequences. Animal Feed Science and Technology, 172, 9-21.
- 13. Andrade, P.V.D., Giger-Reverdin, S. and Sauvant, D. (2002) Relationship between Two Parameters (pH and Redox Potential) Characterizing Rumen Status. Rencontres Recherches Ruminants, 9, 332.
- 14. Giger-Reverdin, S., Rigalma, K., Desnoyers, M., Sauvant, D. and Duvaux-Ponter, C. (2014) Effect of Concentrate Level on Feeding Behavior and Rumen and Blood Parameters in Dairy Goats, Relationships between Behavioral and Physiological Parameters and Effect of Between-Animal Variability. Journal of Dairy Science, 97, 4367-4378.
https://doi.org/10.3168/jds.2013-7383 - 15. Penner, G.B., Beauchemin, K.A. and Mutsvangwa, T. (2006) An Evaluation of the Accuracy and Precision of a Stand-Alone Submersible Continuous Ruminal pH Measurement System. Journal of Dairy Science, 89, 2132-2140.
https://doi.org/10.3168/jds.S0022-0302(06)72284-6 - 16. Qin, C., Bu, D., Sun, P., Zhao, X., Zhang, P. and Wang, J. (2017) Effects of Corn Straw or Mixed Forage Diet on Rumen Fermentation Parameters of Lactating Cows Using a Wireless Data Logger. Animal Science, 88, 259-266.
https://doi.org/10.1111/asj.12616 - 17. Mathieu, F., Jouany, J.P., Senaud, J., Bohatier, J., Bertin, G. and Mercier, M. (1996) The Effect of Saccharomyces cerevisiae and Aspergillus oryzae on Fermentations in the Rumen of Faunated and Defaunated Sheep: Pprotozoal and Probiotics Interactions. Reproduction Nutrition Development, 36, 271-287.
https://doi.org/10.1051/rnd:19960305 - 18. Marden, J.P., Julien, C., Monteils, V., Auclair, E., Moncoulon, R. and Bayourthe, C. (2008) How Does Live Yeast Differ from Sodium Bicarbonate to Stabilize Ruminal pH in High Yielding Dairy Cows? Journal of Dairy Science, 91, 3528-3535.
https://doi.org/10.3168/jds.2007-0889 - 19. Barry, T.N., Thompson, A. and Armstrong, D.G. (1977) Rumen Fermentation Studies on Two Contrasting Diets. 1. Some Characteristics of the in Vivo Fermentation, with Special Reference to the Composition of the Gas Phase, Oxidation/Reduction State and Volatile Fatty Acid Proportions. The Journal of Agricultural Science, 89, 183-195.
https://doi.org/10.1017/S0021859600027362 - 20. Michelland, R.J., Monteils, V., Combes, S., Cauquil, L., Gidenne, T. and Fortun-Lamothe, L. (2011) Changes over Time in the Bacterial Communities Associated with Fluid and Food Particles and the Ruminal Parameters in the Bovine Rumen before and after a Dietary Change. Canadian Journal of Microbiology, 57, 629-637.
https://doi.org/10.1139/w11-053 - 21. Monteils, V., Rey, M., Cauquil, L., Troegeler-Meynadier, A., Silberberg, M. and Combes, S. (2011) Random Changes in the Heifer Rumen in Bacterial Community Structure, Physico-Chemical and Fermentation Parameters, and in Vitro Fiber Degradation. Livestock Science, 141, 104-112.
- 22. Julien, C., Marden, J.P., Auclair, E., Moncoulon, R., Cauquil, L., Peyraud, J.L. and Bayourthe, C. (2015) Interaction between Live Yeast and Dietary Rumen Degradable Protein Level: Effects on Diet Utilization in Early-Lactating Dairy Cows. Agricultural Sciences, 6, 1-13.
https://doi.org/10.4236/as.2015.61001 - 23. Marden, J.P. (2007) The Mode of Action of the Yeast Saccharomyces cerevisiae Sc 47 in Ruminants: A Thermodynamic Approach in Dairy Cows. PhD Thesis, INP Toulouse, Toulouse, 195 p.
- 24. Julien, C. (2011) Interactions between Diet Composition and Live Yeast Sc47 (ACTISAF R): Effects on Redox Status and Fermentative Activity in the Rumen of Dairy Cows. PhD Thesis, INP Toulouse, Toulouse, 235.
- 25. Anonymous (1988) Order of 18 April 1988 Laying down the Conditions for Granting Authorization to Experiment. Journal Officiel de la République Francaise, 5608-5610.
- 26. Streeter, M.N., Wagner, D.G., Hibberd, C.A. and Owens, F.N. (1990) Comparison of Corn with Four Sorghum Grain Hybrids: Site and Extent of Digestion in Steers. Journal of Animal Science, 68, 3429-3440.
https://doi.org/10.2527/1990.68103429x - 27. Chapoutot, P., Nozière, P. and Sauvant, D. (2013) “Systool”, a New Calculator for the New French “Systali” Project. 64th Annual Meeting of the European Federation of Animal Science, Nantes, 138.
- 28. Sauvant, D. and Nozière, P. (2016) Quantification of the Main Digestive Processes in Ruminants: The Equations Involved in the Renewed Energy and Protein Feed Evaluation Systems. Animal, 10, 755-770.
https://doi.org/10.1017/S1751731115002670 - 29. Ross, J.G., Spears, J.W. and Garlich, J.D. (1994) Dietary Electrolyte Balance Effects on Performance and Metabolic Characteristics on Finishing Steers. Journal of Animal Science, 72, 1600-1607.
- 30. Meschy, F. (2010) Mineral Nutrition of Ruminants. Editions Quae, Versailles.
- 31. Apper-Bossard, E., Faverdin, P., Meschy, F. and Peyraud, J.L. (2010) Effects of Dietary Cation-Anion Difference on Ruminal Metabolism and Blood Acid-Base Regulation in Dairy Cows Receiving Two Contrasting Levels of Concentrate in Diets. Journal of Dairy Science, 93, 4196-4210.
https://doi.org/10.3168/jds.2009-2975 - 32. INRA (2007) Feeding of Cattle, Sheep and Goats. Tables INRA 2007, Editions Quae, Versailles.
- 33. Nordstrom, D.K. (1977) Thermochemical Redox Equilibria of Zo Bell’s Solution. Geochimicaet Cosmochimica Acta, 41, 1835-1841.
- 34. Huang, Y., Julien, C., Marden, J.P. and Bayourthe, C. (2016) Relationship between Ruminal Redox Potential and pH in Dairy Cattle. Proceedings of the 20th Congress of the ESVCN, Berlin, 123.
- 35. Sauvant, D., Schmidely, P., Daudin, J.J. and St-Pierre, N.R. (2008) Meta-Analyses of Experimental Data in Animal Nutrition. Animal, 2, 1203-1214.
https://doi.org/10.1017/S1751731108002280 - 36. St-Pierre, N.R. (2001) Invited Review: Integrating Quantitative Findings from Multiple Studies Using Mixed Model Methodology. Journal of Dairy Science, 84, 741-755.
https://doi.org/10.3168/jds.S0022-0302(01)74530-4 - 37. Wang, Z. and Goonewardene, L.A. (2004) The Use of MIXED Models in the Analysis of Animal Experiments with Repeated Measures Data. Canadian Journal of Animal Science, 84, 1-11.
https://doi.org/10.4141/A03-123 - 38. Krizova, L., Richter, M., Trinacty, J., Ríha, J. and Kumprechtova, D. (2011) The Effect of Feeding Live Yeast Cultures on Ruminal pH and Redox Potential in Dry Cows as Continuously Measured by a New Wireless Device. Czech Journal of Animal Science, 56, 37-45.
- 39. Pitt, R.E., Van Kessel, J.S., Fox, D.G., Pell, A.N., Barry, M.C. and Van Soest, P.J. (1996) Prediction of Ruminal Volatile Fatty Acids and pH within the Net Carbohydrate and Protein System. Journal of Animal Science, 74, 226-244.
https://doi.org/10.2527/1996.741226x - 40. Kolver, E.S. and De Veth, M.J. (2002) Prediction of Ruminal pH from Pasture-Based Diets. Journal of Dairy Science, 85, 1255-1266.
https://doi.org/10.3168/jds.S0022-0302(02)74190-8 - 41. Meschy, F. and Peyraud, J.L. (2004) Strong Ion Content of Forages, Dietary Cation Anion Difference and Acid-Base Balance Values. Rencontres Recherches Ruminants, 11, 255-258.
- 42. Apper-Bossard, E., Peyraud, J.L. and Dourmad, J.Y. (2009) Effects of Dietary Cation-Anion Difference on Performance and Acid-Base Status: A Review. INRA Productions Animales, 22, 117-130.
- 43. Apper-Bossard, E., Peyraud, J.L., Faverdin, P. and Meschy, F. (2006) Changing Dietary Cation-Anion Difference for Dairy Cows Fed with Two Contrasting Levels of Concentrate in Diets. Journal of Dairy Science, 89, 749-760.
https://doi.org/10.3168/jds.S0022-0302(06)72136-1 - 44. Hu, W. and Murphy, M.R. (2004) Dietary Cation-Anion Difference Effects on Performance and Acid-Base Status of Lactating Dairy Cows: A Meta-Analysis. Journal of Dairy Science, 87, 2222-2229.
https://doi.org/10.3168/jds.S0022-0302(04)70042-9 - 45. Iwaniuk, M.E., Weidman, A.E. and Erdman, R.A. (2015) The Effect of Dietary Cation-Anion Difference Concentration and Cation Source on Milk Production and Feed Efficiency in Lactating Dairy Cows. Journal of Dairy Science, 98, 1950-1960.
https://doi.org/10.3168/jds.2014-8704 - 46. Giger-Reverdin, S., Duvaux-Ponter, C., Rigalma, K. and Sauvant, D. (2006) Effect of Chewing Behaviour on Ruminal Redox Potential Variability in Dairy Goats. Rencontres Recherches Ruminants, 13, 138.
- 47. Krishtalik, L.I. (2003) pH-Dependent Redox Potential: How to Use It Correctly in the Activation Energy Analysis. Biochimicaet Biophysica Acta, 1604, 13-21.
- 48. Bohn, H.L. (1969) The EMF of Platinum Electrodes in Dilute Solutions and Its Relation to Soil pH. Soil Science Society of America Journal, 33, 639-640.
https://doi.org/10.2136/sssaj1969.03615995003300040044x - 49. Friedman, N., Shriker, E., Gold, B., Durman, T., Zarecki, R. and Mizrahi, I. (2017) Diet-Induced Changes in Redox Potential Underlie Compositional Shifts in the Rumen Archaeal Community. Environmental Microbiology, 191, 174-184.
https://doi.org/10.1111/1462-2920.13551