Agricultural Sciences
Vol.06 No.01(2015), Article ID:53433,10 pages
10.4236/as.2015.61010
Characterization of the Geographical and Varietal Origin of Wheat and Bread by Means of Nuclear Magnetic Resonance (NMR), Isotope Ratio Mass Spectrometry (IRMS) Methods and Chemometrics: A Review
Francesco Longobardi, Daniela Sacco, Grazia Casiello, Andrea Ventrella, Antonio Sacco*
Dipartimento di Chimica, Università degli Studi di Bari “A. Moro”, Bari, Italy
Email: *antonio.sacco@uniba.it
Copyright © 2015 by authors and Scientific Research Publishing Inc.
This work is licensed under the Creative Commons Attribution International License (CC BY).
http://creativecommons.org/licenses/by/4.0/


Received 4 December 2014; accepted 28 December 2014; published 21 January 2015
ABSTRACT
In recent years, food authentication, in terms of geographical and varietal/animal origins, is considered of primary importance at all levels of the production process. Therefore, it is clear that there is an economic basis to develop analytical methods able to certify the declared origin of food products, in order to protect consumers and honest producers from fraud and unfair competition, respectively; consequently, during recent years, several food authentication techniques have been proposed. This review attempted to present in a critical way the contribution of High Resolution Nuclear Magnetic Resonance (HR-NMR) and Isotope Ratio Mass Spectrometry (IRMS) techniques in the assessment of quality and authenticity, mainly in terms of characterization of geographical and varietal origin, of wheat and wheat products, focusing on the most important studies to this direction.
Keywords:
NMR, IRMS, Wheat, Bread, Geographic Origin

1. Introduction
In recent years, food quality and authentication are becoming of primary importance for both consumers and industries, at all levels of the production process, from raw materials (farm) to finished products (fork). Moreover, consumers all around the world have shown an increasing interest for typical food products with reliable indicators of geographical origin. Typical food products have an important economical role both on National and International level as confirmed by certifications and trademarks of quality (e.g. Protected Denomination of Origin, PDO and Protected Geographical Identification, PGI), assigned to guarantee typicity and quality standards.
This requirement is expanding to several product typologies, including pasta and durum wheat breads. For example, in some Italian regions the promotion of production disciplinary for PDO certifying durum wheat bread authenticity is requested by producers. So, it could be important to facilitate and to boost the initiative of access to PDO for production of typical bread, integrated to the local production of durum wheat and to the traditional working technique. Although, from the legislative point of view, quality standards have been established through the requirement of quality labels that specify the chemical composition of each product, appropriate controls and analyses are quite often not available to enforce these approaches.
Just one example is the requirement for geographical origin of several foods, which consists of a paper documentation rather than an instrumental determination. Thus, a significant discrepancy exists between the higher standards of quality and the inappropriate analytical approaches used to address the problem. For this purpose it is necessary to set objective tests to verify the authenticity of the geographical origin of the durum wheat used. Therefore, it is necessary to carry out an analytical monitoring on durum wheat samples produced in different geo- graphical areas in order to find “authenticity markers” that could be employed to characterize typical products.
Chemometric methodologies, applied to food composition in several researches, sometimes successfully proved that the geographical and varietal origin of the samples can be related to some chemical compounds. In particular, Armanino et al. [1] found differences for the species and for the origin of wheat samples by chemical analysis. However, these methods show several limitations, like the time consumption and the request of too many analytical methods to obtain information about the presence of different classes of compounds. On the other hand, Nuclear Magnetic Resonance (NMR) spectroscopy provides the possibility of obtaining information on the presence of many compounds in a single spectrum. For this reason, the interest for the applications of NMR to food science is growing, as confirmed by the high number of papers published in the last years [2] -[6] and by the regular International Conference on Application of Magnetic Resonance in Food Science [7] . Moreover, remarkable advantages have been also obtained by using the High Resolution Magic Angle Spinning Nuclear Magnetic Resonance (HR-MAS NMR), due to its possibility of analyzing solid food products, avoiding any pre-treatments of the samples which could determine loss of informations [8] -[10] .
Another suitable method for the authentication of food products is the Isotope Ratio Mass Spectrometry (IRMS). This technique has shown to provide interesting information on the origin of food products, because the isotopic compositions are governed by the geo-climatic conditions under which plant grows [11] -[15] . Generally, the isotopic compositions of plant materials reflect various factors such as the isotopic compositions of the source materials (e.g., CO2, H2O, NH4, and NO2) and their assimilation processes as well as the growth environment. For example, the carbon isotopic composition of plant materials strongly depends on the carbon fixation process, such as the C3 or C4 cycle.
The oxygen isotopic composition mainly reflects that of local groundwater such as precipitation and meltwater. A dependence of the 18O/16O ratio (δ18O) with the geo-climatic conditions of the area of production has been demonstrated for various foods, as for example in vegetable oils [16] . The nitrogen isotopic composition of plant mainly depends on geo-climatic conditions, as well as on fertilisation. Nowadays stable isotopes are more and more used to verify the authenticity of foodstuffs and of their origin too [17] -[20] .
In this review, the mainly NMR and IRMS studies for the characterization of geographical and varietal origin of wheat and wheat products, were reported and discussed.
2. Results and Discussion
1H HR-MAS NMR and IRMS were applied to analyse two different cultivars (Colosseo and Simeto) of durum wheat produced in different Italian geographical areas (northern, central and southern) [21] . For the statistical analysis, the data set included the intensities of some NMR resonances and the isotopic ratios of 13C/12C and 15N/14N.
Three principal components (PCs) were extracted from the principal component analysis (PCA), explaining 78% of the total variance, and the samples seemed to cluster into three groups on PC2, corresponding to different geographical origins, whereas the different cultivars were discriminated on PC3. This meant that the examined parameters hold information useful to discriminate the samples.
Discriminant analysis (DA) was applied to the same parameters to classify the durum wheat samples into separate groups according to geographical origin. The prediction ability of the model for the training set was 100%. The same model applied to the validation set produced a 100% success rate (Figure 1). A correct classifi- cation, i.e. 100%, was also obtained applying DA for the discrimination of the samples according to the cultivar.
In conclusion, NMR and IRMS gave important informations about the geographical and varietal origin of the samples. Isotopic data contributed most in the discrimination of the samples according to the geographical origin; therefore it seems reasonable to stress the importance of this technique in the analysis of food products.
An investigation regarded the characterization of the geographical origin of durum wheat semolina exclusively on the basis of isotopic composition [22] . The study was carried out on thirty-five samples of durum wheat, subdivided as follows: 20 samples from Italy, 4 from Turkey (Tur), 7 from Canada (Can) and 4 from Australia (Aus). The Italian samples were distinguished according to their geographical position, in northern [NI] (mean latitude 44˚), central [CI] (mean latitude 42˚), and southern [SI] (mean latitude 41˚).
The δ13C, δ18O and δ15N mean and standard deviation values for the different origins are reported in Table 1.
It was possible to establish by each single isotope a scale of isotopic values for the considered geographic origins:
13C: Aus > Can > SI > Tur > CI > NI
18O: Aus > Tur > SI > CI > NI > Can
15N: Can > SI > Aus > Tur > CI > NI
It was possible to observe different isotopic patterns for the various origins considered.
More information were obtained from the individual isotopic values considering the three couples: 18O vs 13C , 15N vs 13C , 15N vs 18O.
As far as Italian durum wheat flours were concerned, samples from south Italy showed in general higher values with respect to north and central Italy, with the exception of 18O values, similar to samples from central Italy. Southern samples came from Apulia, except one sample coming from Sicily, an island located at lower latitude
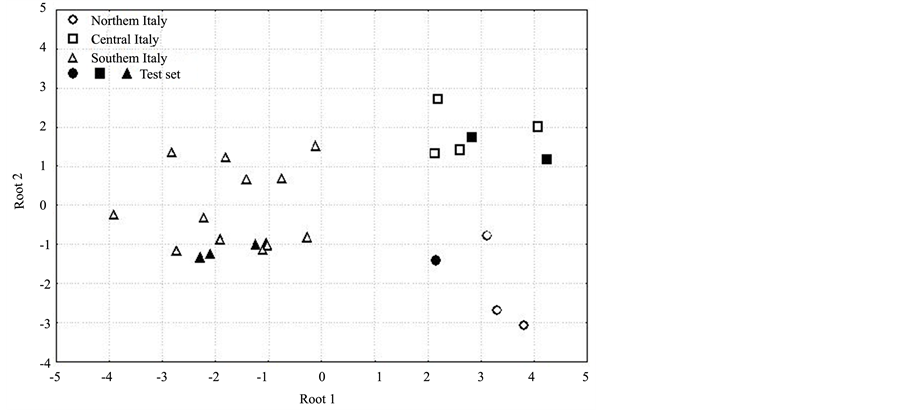
Figure 1. Plot of three geographical origins for wheat flours samples on the first two discriminant functions for spectroscopic data. Reprinted from Ref. [21] . Copyright (2002) with permission from AACC International.

Table 1. Mean and standard deviation (SD) of isotopic parameters of durum wheat samples coming from different geographic origin. Reprinted from Ref. [22] . Copyright (2002) with permission from John Wiley and Sons.
than Apulia. This sample was the one showing in absolute the highest values for the three considered isotopes. North and central Italy origin could be distinguished mainly on the basis of their δ18O values.
Canadian samples were characterised by low δ18O values very close to the samples from north Italy (mean 24.98‰) and both tended to have lower values than the other countries (mean 29.49‰). This can be explained by the fact that Canada and north Italy are characterised by a humid and cold climate while the other geographical locations generally are warmer and dryer. On the other hand, Canadian and north Italy samples were easily separated considering 13C and 15N values. Furthermore, on the basis of δ18O values it was possible to classify the Canadian samples into two groups, probably coming from two different regions: one group characterised by lower δ18O values (mean value 23.57‰) and a second one showing higher values (mean value 25.73‰). A splitting into two groups was evident for Australian samples especially when 15N isotope was considered.
A more complicated situation was found considering samples from Turkey. Taking into account δ 13C and δ18O values it was possible to observe the slitting of the samples into two groups, mostly due to the contribution of 18O isotope.
Taking into account δ13C and δ18O values, samples coming from
In a paper of Brescia et al. [23] , δ13C and δ18O of samples of durum and tender wheat flours were determined. The samples were obtained from the most renowned bakers in southern Italy: nine durum wheat samples came from well-known production areas in the region of Apulia (Laterza [L] and Altamura [A]) and Basilicata (Matera [M]); and seven tender wheat samples came from Apulia (Monte Sant’Angelo [MSA]) and Abruzzo (Vasto [V]).
The results of the isotopic parameters of durum and tender wheat flours showed a significant difference in the 13C/12C ratio for the flours, in particular, durum wheat flours samples showed a higher average 13C content (δ13C = ?25.0) than tender wheat flours samples (δ13C = ?26.0). This is an important result that could be used to investigate fraud, whereby white flour is added to durum wheat flour, which is common in pasta production.
From the analysis of the 18O/16O parameter it was not possible to distinguish durum wheat flour samples according to their geographical origin. The authors attributed this result to the sensitivity of the δ18O to the climatic conditions in which the plants grow concluding that these did not differ significantly in the areas considered (
In a paper appeared on 2007 [24] a complete characterisation of four typical durum wheat breads produced in Italy was presented, from the starting semolinas to the final product, also considering the intermediate dough. Four towns, with an established bread-making tradition in
1H HR-MAS NMR spectra of the analyzed samples reveal principally signals due to lipids and polysaccharides as described in [23] . δ13C and δ15N ratios were determined on the flours, dough and bread samples by means of the IRMS technique. The mean values obtained are reported in Table 2.
The average values of δ15N significantly discriminated flour, dough and bread samples according to geographical origin while δ13C values were not significantly different for the samples and this result could be expected since they are mainly affected by the pathway of CO2 fixation used by the plant species, that is common for all the studied samples.
The intensities of the signals present in the 1H HR-MAS NMR spectra of all the samples were calculated. The data obtained and the isotopic parameters were gathered in three data sets for flours, dough and breads. Multivariate statistical analysis was performed to evaluate if the data contained useful information for the discrimination of the samples according to their geographical origin.
As far as flours are concerned, a significant differentiation was found between samples from Bonorva (Sardinia) and the others by plotting PC1 vs PC2 (data not showed).
The discrimination of the samples was improved with respect to flours using the DA approach, with 87% of classification ability and 76% of predictive capacity (Figure 2).
The differences between the samples were reduced when bread samples were considered. This behavior was certainly due to the chemical modifications that occur during the processing, and in particular after cooking. This result was expected from the observed features of the bread spectra. Nevertheless, due to the higher δ15N values of Bonorva samples, these bread samples were very well differentiated from the others.
In a paper from Lamanna et al. [25] , 1H-NMR was used to detect metabolic profiles of wheat flours samples of different geographical and botanical origin. For the experiments, 100 durum wheat farms falling within the
Table 2. Mean and standard deviation (SD) of isotopic parameters of the analyzed samples calculating by using original data reported on Ref. [24] .
Altamura, Minervino and Poggiorsini locations (Apulia region, Southern Italy) were considered. The procedure to obtain the solutions for filling the NMR tubes was described in detail by the authors. In the statistical procedure the analysis of variance (ANOVA) was used in combination with the linear discriminat analysis (LDA) to maximize the ability of LDA in predicting unknown samples [26] [27] . Figure 3 shows the first two linear
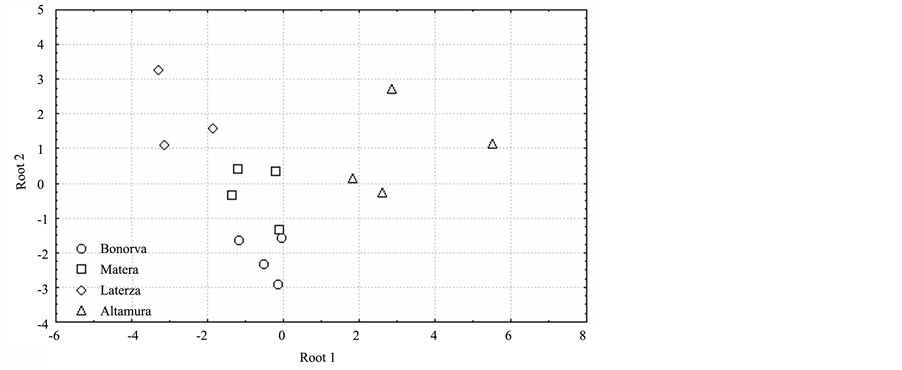
Figure 2. Plot of the geographical origins for dough samples on the first two discriminant functions for NMR and IRMS data. Reprinted from Ref. [24] . Copyright (2007) with permission from Elsevier.

Figure 3. Linear discriminant analysis of a reduced number of Nuclear Magnetic Resonance (NMR) variables for the geographical origin classification. The red circle, blue down triangles and yellow up triangles represent, respectively, “Altamura”, “Minervino” and “Poggiorsini” geographical classes in the training set. The same symbols in black represent the class assigned by the LDA model to the validation samples. Misassigned samples are surrounded by larger symbols representing the real geographical origin of the corresponding validation sample. Reprinted from Ref. [25] . Copyright (2010) with permission from John Wiley and Sons.
discriminant functions for the geographical origin problem.
It is clear from Figure 3 that the NMR spectra contain sufficient information to assess the geographical origin of wheat.
Branch et al. [28] reported a preliminary study in determining the geographical origin of wheat using isotope ratio inductively coupled plasma mass spectroscopy with 13C and 15N mass spectroscopy. Twenty samples consisting of nine North American, seven Canadian and four European (three French, one German) wheat samples were analyzed. The values for δ13C and δ15N by geographic origin are shown in Figure 4. It is clear from the plot that δ13C is a good indicator of origin but δ15N is not.
The authors affirmed that a DA model is not required in the case as the δ13C values can be used directly to classify the samples. Within each country of origin there were, however, subgroups, also classifiable by using DA but, due to the small size of the data set in this pilot study was not possible to validate the model with a rest set. In particular, there were only one German and two USA samples of unknown origin. The best DA model for the subgroups was based on two variables (δ13C and δ15N). This model predicted all the subgroups correctly as shown in the canonical analysis plot (Figure 5), but could not be validated, and so it could not be excluded that possible over-fitting occurred.
In a short paper Gallegos et al. [29] sought to achieve preliminary isotopic fingerprint identification for the wheat from Córdoba Province in Argentina. Eighteen samples of wheat were analyzed. The stable isotope values obtained for carbon and nitrogen in the analyzed samples allowed to provide the following considerations. Statistically, the δ13C mean was −24.0‰, with a standard deviation of 0.7 and a variance of 0.6. The δ15N mean was 2.7‰, with a standard deviation of 0.8 and a variance of 0.6. The δ13C results reflected the typical C3 metabolic pathway for carbon fixation in the photosynthesis of wheat, but were also a consequence of the local, unique, environmental geographic and ecological conditions. The δ15N values, around 2.7‰, reflected fertilizer techniques, with minor contributions of environmental, geographic and ecological conditions. The comparison with the results obtained from Branch et al. [28] is displayed in Figure 6.
The authors concluded that in both scatter plot and box plots the difference on the isotopic fingerprint from Argentina, North America (Canada and USA) and Europe is evident. As a consequence and independent of the common C fixation pathway for wheat it is possible to distinguish samples of different continents, with the use of carbon and nitrogen isotopes.

Figure 4. δ13C and δ15N values by geographical origin. Reprinted from Ref. [28] . Copyright (2012) with permission from Royal Society of Chemistry.
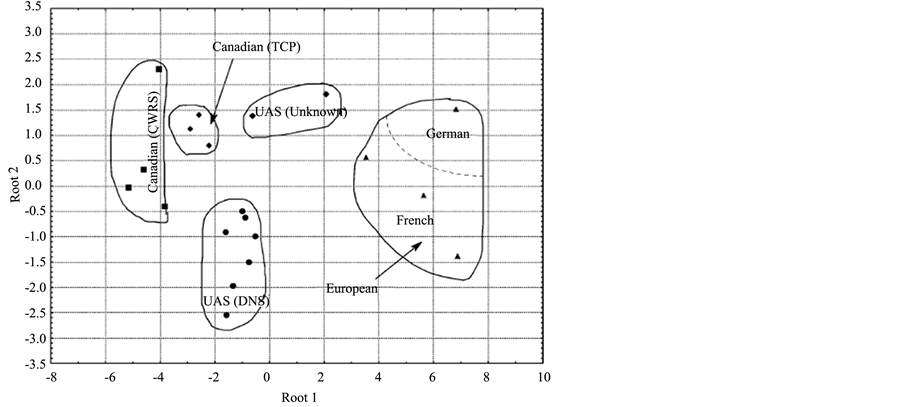
Figure 5. Canonical plot of within geographical region wheat subgroups. Reprinted from Ref. [28] . Copyright (2012) with permission from Royal Society of Chemistry.
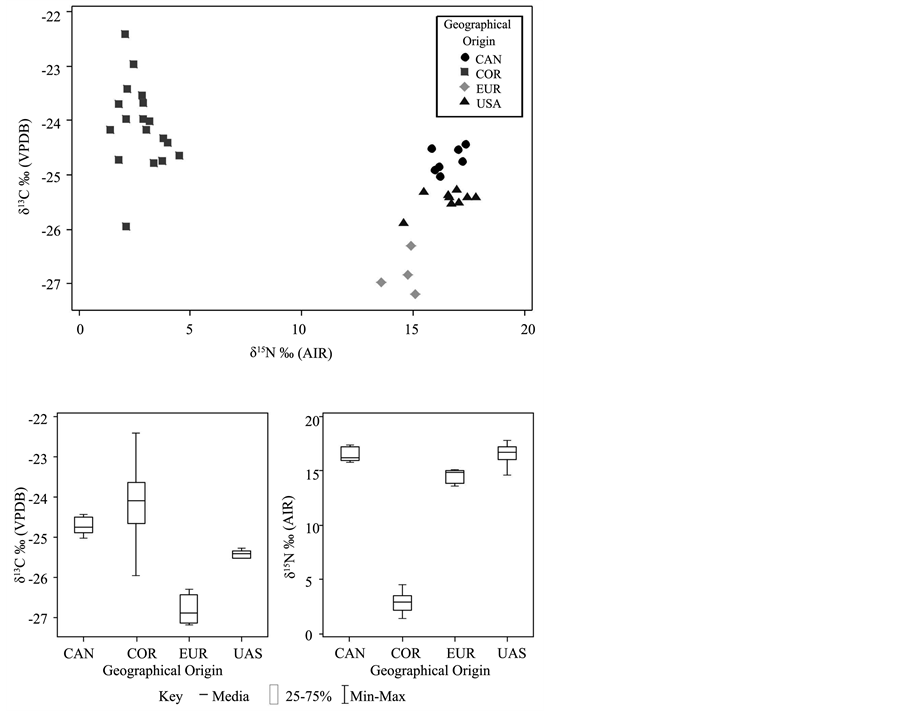
Figure 6. Isotopic results obtained by Gallegos et al. [29] compared with the data from Branch et al. [28] . Geographical origin key: COR (Córdoba Province, Argentina) CAN (Canada), EUR (Europe), USA (United States of America). Reprinted from Ref. [29] .
Recently, Podio et al. [30] published a paper with the aim to investigate if elemental and isotopic signatures of Argentinean wheat can be used to develop a reliable fingerprint to assess its geographical provenance. For this study the authors analysed 80 wheat samples cultivated at three different regions ( 27 in
Nevertheless, δ13C values from Córdoba were significantly higher than values observed in samples from Entre Rios and
3. Conclusion
The quality assessment and authentication of wheat and bread produced thereof, is of primary importance owing to the development of products with specific regional and varietal characteristics (PDO labels) and the increasing demand of the consumers for high quality products, also in term of the geographical origin. Studies involved in this review have provided evidence that both NMR and IRMS are important tools for establishing, scientifi- cally, the geographical and varietal origin of wheat and wheat products by selecting appropriate chemometric- data treatments. However, the first conclusion that arises from this review is that the accurate assessment of the quality and/or identity of a food product seem very promising when the combination of many different parameters is applied. This multi-factorial approach needs that all data must be carefully interpreted and cross-vali- dated with tools of multivariate statistics in order to establish links to the geographical origin. Indeed, the results reported by Sacco et al., showed that the methodology of coupling different analytical techniques enabled a better discrimination of wheat products according to their geographical origin. These techniques provide the so called “fingerprints” of the foodstuffs, which by comparison with authentic samples can be used to detect certain fraudulent practices and to authenticate the geographical origin. They can also provide an efficient mean to enforce the restricted rules associated to PDO labelled products. Nevertheless, a more in-depth overview of the studies herein reported, reveal some weak points that may reduce the significance of the final conclusions. Just one example is represented by sampling (limited number of samples even restricted to particular place of production). Sampling design appears to be one of the most important steps for quality control and authentication for all foodstuffs, and perhaps the most important step to build a reliable classification/prediction model for geographical identification. Ideally, the samples must represent all the factors, or at least the most important of these, that have influence on the composition of the food. For food products, like wheat, major factors affecting its chemical composition are pedo-climatic conditions (e.g. altitude, climate), agronomic practices, time and conditions of storage. The poor sampling (a limited number of samples and/or unequal numbers of samples per class) or the uncorrected choice of regions and place of production involved in the study, may lead to a false classification rate. In particular, if the number of samples collected is comparable or smaller than the number of variables (predictors) the statistical procedures may create an optimized linear combination of variables that tend to “overfit” the data, but leading to models unable to correctly predict unknown samples. Therefore, a consideration regarding the quality of wheat and derived products, that this review may suggest, is to extend the evaluation to other areas of production, taking into account the recent situation of the national and international trade markets, aiming to a more representative collection of samples from the statistical point of view. Finally, the authors of this review believe that a closer collaboration between the research laboratories and the producers, combining the scientific knowledge with the experience of production and marketing will form a strong team that could be able to solve several problems related to the food quality authentication for the benefit of the consumers.
References
- Armanino, C. and Festa, M.R. (1996) Characterization of Wheat by Four Analytical Parameters. A Chemometric Study. Analytica Chimica Acta, 331, 43-51. http://dx.doi.org/10.1016/0003-2670(96)00164-X
- Longobardi, F., Ventrella, A.,
- Dais, P. and Hatzakis, E. (2013) Quality Assessment and Authentication of Virgin Olive Oil by NMR Spectroscopy: A Critical Review. Analytyca Chimica Acta, 765, 1-27. http://dx.doi.org/10.1016/j.aca.2012.12.003
- Longobardi, F., Ventrella, A., Bianco, A., Catucci, L., Cafagna, I., Gallo, V., Mastrorilli, P. and Agostiano, A. (2013) Non-Targeted 1H NMR Fingerprinting And Multivariate Statistical Analyses for the Characterisation of the Geographical Origin of Italian Sweet Cherries. Food Chemistry, 141, 3028-3033. http://dx.doi.org/10.1016/j.foodchem.2013.05.135
- Laghi, L., Picone, G. and Capozzi, F. (2014) Nuclear Magnetic Resonance for Foodomics beyond Food Analysis. Trends in Analytical Chemistry, 59, 93-102. http://dx.doi.org/10.1016/j.trac.2014.04.009
- Jung, Y., Lee, J., Kwon, J., Lee, K.-S., Ryu, D.H. and Hwang, G.-S. (2010) Discrimination of the Geographical Origin of Beef by 1H NMR-Based Metabolomics. Journal of Agricultural and Food Chemistry, 59, 10458-10466. http://dx.doi.org/10.1021/jf102194t
- Renou, J.P., Belton, P.S. and Webb, G.A., Eds. (2011) Magnetic Resonance in Food Science. An Exiting Future. Royal Society of Chemistry Publishing,
- Shintu, L., Caldarelli, S. and Franke, B.M. (2007) Pre-Selection of Potential Molecular Markers for the Geographic Origin of Dried Beef by HR-MAS NMR Spectroscopy. Meat Science, 76, 700-707. http://dx.doi.org/10.1016/j.meatsci.2007.02.010
- Vermathen, M., Marzorati, M. and Vermathen, P. (2012) Exploring High-Resolution Magic Angle Spinning (HR-MAS) NMR Spectroscopy for Metabonomic Analysis of Apples. Chimia, 66, 747-751. http://dx.doi.org/10.2533/chimia.2012.747
- Valentini, M., Ritota, M., Cafiero, C., Cozzolino, S., Leita, L. and Sequi, P. (2011) The HRMAS-NMR Tool in Foodstuff Characterisation. Magnetic Resonance in Chemistry, 49, 121-125. http://dx.doi.org/10.1002/mrc.2826
- Smith, B.N. and Epstein, S. (1971) Two Categories of 13C/12C Ratios for Higher Plants. Plant Physiology, 47, 380-384. http://dx.doi.org/10.1104/pp.47.3.380
- Bricout, J. (1973) Control of Authenticity of Fruit Juices by Isotopic Analysis. Journal of the Association of Official Analytical Chemists, 56, 739-742.
- Bréas, O., Reniero, F. and Serrini, G. (1994) Isotope Ratio Mass Spectrometry: Analysis of Wines from Different European Countries. Rapid Communications in Mass Spectrometry, 8, 967-970. http://dx.doi.org/10.1002/rcm.1290081212
- Rossmann, A., Schmidt, H.L., Reniero, F., Versini, G., Moussa, I. and Merle, M.H. (1996) Stable Carbon Isotope Content in Ethanol of EC Data Bank Wines from Italy, France and Germany. Zeitschrift für Lebensmittel-Untersuchung und -Forschung, 203, 293-301. http://dx.doi.org/10.1007/BF01192881
- Martin, G.J., Mazure, M., Jouitteau, C., Martin, Y.L., Aguile, L. and Allain, P. (1999) Characterization of the Geographic Origin of Bordeaux Wines by a Combined Use of Isotopic and Trace Element Measurements. American Journal of Enology and Viticulture, 4, 409-417.
- Bréas, O., Guillou, C., Reniero, F., Sada, E. and Angerosa, F. (1998) Oxygen-18 Measurement by Continuous Flow Pyrolysis/Isotope Ratio Mass Spectrometry of Vegetable Oils. Rapid Communications in Mass Spectrometry, 12, 188- 192. http://dx.doi.org/10.1002/(SICI)1097-0231(19980227)12:4<188::AID-RCM137>3.0.CO;2-7
- Osorio, M.T., Moloney, A.P., Schmidt, O. and Monahan, F.J. (2011) Beef Authentication and Retrospective Dietary Verification Using Stable Isotope Ratio Analysis of Bovine Muscle and Tail Hair. Journal of Agricultural and Food Chemistry, 59, 3295-3305. http://dx.doi.org/10.1021/jf1040959
- Longobardi, F., Casiello, G., Sacco, D., Tedone, L. and Sacco, A. (2011) Characterisation of the Geographical Origin of Italian Potatoes, Based on Stable Isotope and Volatile Compound Analyses. Food Chemistry, 124, 1708-1713. http://dx.doi.org/10.1016/j.foodchem.2010.07.092
- Malec-Czechowska, K. and Wierzchnicki, R. (2013) A Study of Stable Isotope Composition of Chosen Foodstuffs from the Polish Market. Nukleonika, 58, 323-327.
- Longobardi, F., Casiello, G., Ventrella, A., Mazzilli, V., Nardelli, A., Sacco, D., Catucci, L. and Agostiano, A. (2015) Electronic Nose and Isotope Ratio Mass Spectrometry in Combination with Chemometrics for the Characterization of the Geographical Origin of Italian Sweet Cherries. Food Chemistry, 170, 90-96. http://dx.doi.org/10.1016/j.foodchem.2014.08.057
- Brescia, M.A., Di Martino, G., Fares, C., Di Fonzo, N., Platani, C., Ghelli, S., Reniero, F. and Sacco, A. (2002) Characterization of Italian Durum Wheat Semolina by Means of Analytical and Spectroscopic Determinations. Cereal Chemistry, 79, 238-242. http://dx.doi.org/10.1094/CCHEM.2002.79.2.238
- Brescia, M.A., Di Martino, G., Guillou, C., Reniero, F. and Sacco, A. (2002) Differentiation of the Geographical Origin of Durum Wheat Semolina Samples on the Basis of Isotopic Composition. Rapid Communication in Mass Spectrometry, 16, 2286-2290. http://dx.doi.org/10.1002/rcm.860
- Brescia, M.A., Sgaramella, A., Ghelli, S. and Sacco, A. (2003) 1H HR-MAS NMR and Isotopic Investigation of Bread and Flour Samples Produced in Southern Italy. Journal of the Science of Food and Agriculture, 83, 1463-1468. http://dx.doi.org/10.1002/jsfa.1561
- Brescia, M.A., Sacco, D., Sgaramella, A., Pasqualone, A., Simeone, R., Peri, G. and Sacco, A. (2007) Characterization of Different Typical Italian Bread by Means of Traditional, Spectroscopic and Image Analyses. Food Chemistry, 104, 429-438. http://dx.doi.org/10.1016/j.foodchem.2006.09.043
- Lamanna, R., Cattivelli, L., Miglietta, M.L. and Troccoli, A. (2011) Geographical Origin of Durum Wheat Studied by 1H-NMR Profiling. Magnetic Resonance in Chemistry, 49, 1-5. http://dx.doi.org/10.1002/mrc.2695
- Guyon, I. and Elisseeff, A. (2003) An Introduction to Variable and Feature Selection. Journal of Machine Learning Research, 3, 1157-1182.
- Marini, F., Magrì, A.L., Balestrieri, F., Fabretti, F. and Marini, D. (2004) Supervised Pattern Recognition Applied to the Discrimination of the Floral Origin of Six Types of Italian Honey Samples. Analityca Chimica Acta, 515, 117-125. http://dx.doi.org/10.1016/j.aca.2004.01.013
- Branch, S., Burke, S., Evans, P., Fairman, B. and Wolff Briche, C.S.J. (2003) A Preliminary Study in Determining the Geographical Origin of Wheat Using Isotope Ratio Inductively Coupled Plasma Mass Spectrometry with 13 C , 15N Mass Spectrometry. Journal of Analytical Atomic Spectrometry, 18, 17-22. http://dx.doi.org/10.1039/b207055n
- Gallegos, E., Ostera, H.A., Cagnoni, M.C., Wunderlin, D. and Peral Garcia, P. (2010) Carbon and Nitrogen Isotopes on Wheat from Córdoba Province, Argentina: Implications for Provenance Studies. Proceedings of the VII SSAGI, South American Symposium on Isotope Geology, Brasilia, 25-28 July 2010, 362-365.
- Podio, N.S., Baroni, M.V., Badini, R.G., Inga, M., Ostera, H.A., Cagnoni, M., Gautier, E.A., Garcia, P.P., Hoogewerff, J. and Wunderlin, D.A. (2013) Elemental and Isotopic Fingerprint of Argentinean Wheat. Matching Soil, Water, and Crop Composition to Differentiate Provenance. Journal of Agricultural and Food Chemistry, 61, 3763-3773. http://dx.doi.org/10.1021/jf305258r
- Werth, M. and Kuzyakov, Y. (2010) 13 C Fractionation at the Root-Microorganisms-Soil Interface: A Review and Outlook for Partitioning Studies. Soil Biology and Biochemistry, 42, 1372-1384. http://dx.doi.org/10.1016/j.soilbio.2010.04.009
NOTES

*Corresponding author.