International Journal of Geosciences
Vol.3 No.5(2012), Article ID:24980,11 pages DOI:10.4236/ijg.2012.35111
Groundwater Flow Patterns and Hydrochemical Facies Distribution Using Geographical Information System (GIS) in Damaturu, Northeast Nigeria
1Department of Geology, Modibbo Adama University of Technology, Yola, Nigeria
2Department of Geology, University of Maiduguri, Maiduguri, Nigeria
Email: *solomonnyusuf@yahoo.com
Received August 9, 2012; revised September 7, 2012; accepted October 5, 2012
Keywords: Groundwater; Chemical Facies; GIS; Rock-Water Interaction; Cations and Anions
ABSTRACT
The present study attempts to define the relationship between groundwater flow systems and the distribution of chemical facies with the aid of Geographical Information System (GIS). The study also identifies the different geochemical processes responsible for the chemical evolution of groundwater chemistry. Analytical results of 23 groundwater samples reveal mean values of cations as Na+ (84.2 mg/l), K+ (4.2 mg/l), Ca2+ (27 mg/l), Mg2+ (11.5 mg/l) and Fe2+ (0.6 mg/l). The anion mean values are  (4.5 mg/l),
  (3.7 mg/l), Cl– (22.5 mg/l) and
  (2.2 mg/l). Based on mean values, the cations are in order of abundance as Na+ > Ca2+ > Mg2+ > K+ > Fe2+ while the anions reveal order of abundance as Cl– >
  >
>  >
> . The geographical information system (GIS) using Inverse Distance Weighted (IDW) delineate two groundwater zones into: Ca-Mg-SO4-Cl and Na-SO4-Cl water types. The Ca-Mg-SO4-Cl constitutes about 35% of the chemical facies and its evolutionary trend is due to simple hydrochemical mixing between Ca-Mg-HCO3 and Na-SO4-Cl facies and reverse cation exchange. The Na-SO4-Cl facies constitutes about 65% of the chemical facies and represents fossil groundwater. The Ca-Mg-SO4-Cl facies is dominant in the recharge areas while Na-SO4-Cl facies prevails in discharge areas. Rock-water interaction diagrams indicate precipitation induced chemical weathering along with dissolution of rock-forming minerals. The scattered plots among ions revealed geochemical processes as carbonate weathering, silicate weathering, cation exchange and sulphate reduction. HCA identified effects of rock-water interaction and anthropogenic effects as responsible for the modification of groundwater chemistry in the area.
1. Introduction
Variation in groundwater chemistry changes along droundwater flow path from recharge area towards the discharge area. The complexities in the flow system influence the natural spatial variability in groundwater chemistry on local or regional scale [1]. This variability is caused by dissolution of ions in soils, sediments and rocks as water travels along mineral surfaces in the pores and fractures of unsaturated zone and the aquifer [2]. Groundwater flow systems may be mapped and correlated with hydrochemical patterns to varying degrees [3]. The authors also stressed that the mapping of groundwater flow systems may aid in the separation of potable from non potable water. The major ions which constitute the bulk chemistry of groundwater act as natural tracers that are important in delineating groundwater flow path. The use of major ions as natural tracers has therefore become a common method to delineate flow path in aquifers [4]. Generally, the approach is to divide samples into hydrochemical facies which represent group of samples with similar chemical characteristics that can be correlated with location [5]. The authors went further to stress that understanding the chemical composition of groundwater will aid in the development and management of groundwater for various uses. The present study attempts to define the relationship between groundwater flow systems and the distribution of chemical facies with the aid of Geographical Information System (GIS). The study will also identify the different geochemical processes responsible for the chemical evolution of groundwater chemistry. The study area is located between latitudes 11˚40'N to 11˚48'N and longitudes 11˚54'E to 12˚01'E (Figure 1). Water supplied to the people is obtained from hand-dug well and boreholes. The population
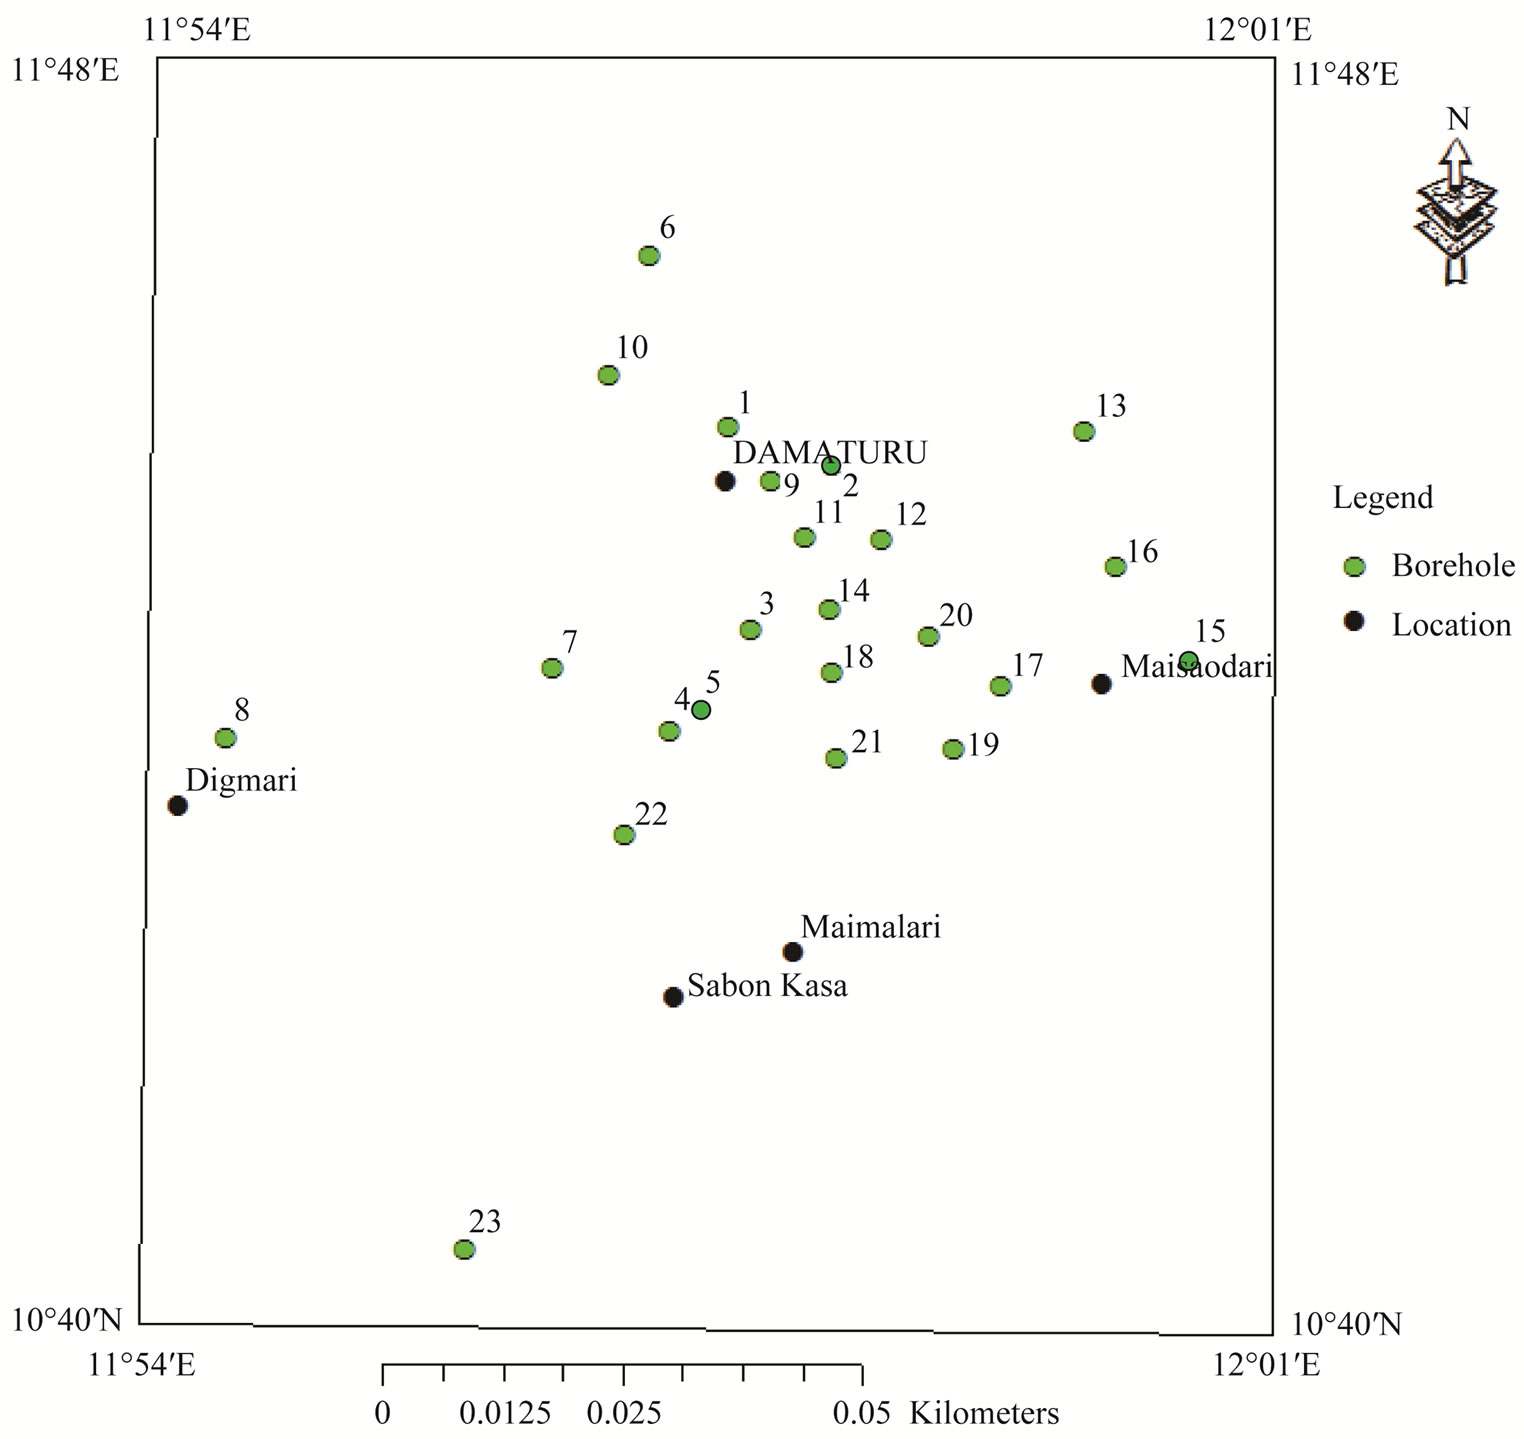
Figure 1. Map of the study area showing sampling points.
of the area is 88,014 [6], and falls within the Sahel savannah with sparse, short grass-cover [7]. The area exhibits a tropical dry season climatic conditions. The hottest months are March, April and May with temperatures varying from 39˚C to 42˚C [8]. Annual rain fall ranges from 500 mm to 1000 mm and rainy season starts normally from June to September in the northern part and May to October in Southern part [9].
2. Geology and Hydrogeology
The study area is located in the northeast sedimentary basin of Nigeria. The Nigerian sector of the Chad basin covers about 152,000 Km2 of territory of Bornu, Bauchi, Plateau and Kano States and constitutes only about 6.5% of the entire basin [10]. The basin contains about 4.65 Km of marine and continental sediments consisting of the Bima Sandstone, Gongila Formation, Fika Shale, Keri Keri and Chad Formations [11]. The study area is underlain by the Fika Shale, Keri Keri and Chad Formations (Figure 2). The Fika shale is coniacian jn age [12], and lithologically, it consists of blue black shales, gypsiferous with thin limestone [13]. It underlies the southeastern part of the study area. The Keri Keri Formation is a continental sequence of Paleocene age deposited under a wide range of conditions, lacustrine and deltaic type sediment being the most common [7]. The lithology is essentially loose medium to coarse grained sands and grits with minor clays and silts [14]. Groundwater occurs mainly under water-table condition with clay lenses giving rise to perched aquifers in some localities. The authors went further to stress that though groundwater occurs in the formation, yields may be small due to low permeability of the sediments and the saturated rocks may be at a considerable depth. The Formation has thickness of about 220 m in the west and southwest of the Chad basin [15]. The Formation underlies the western portion of the study area around the Digmari area.
The Chad Formation is fresh water, sedimentary sequence of Pleistocene age and lithologically, it consists of a succession of clays, sandy clay and silts in which beds and lenses of sand and gravel occur at various levels [7]. Towards the centre of the Chad basin, lacustrine clays are predominant in the sequence but near the margins, fluviatile sand, grits, and gravels are much [16]. Groundwater occurrence in the Chad Formation is under
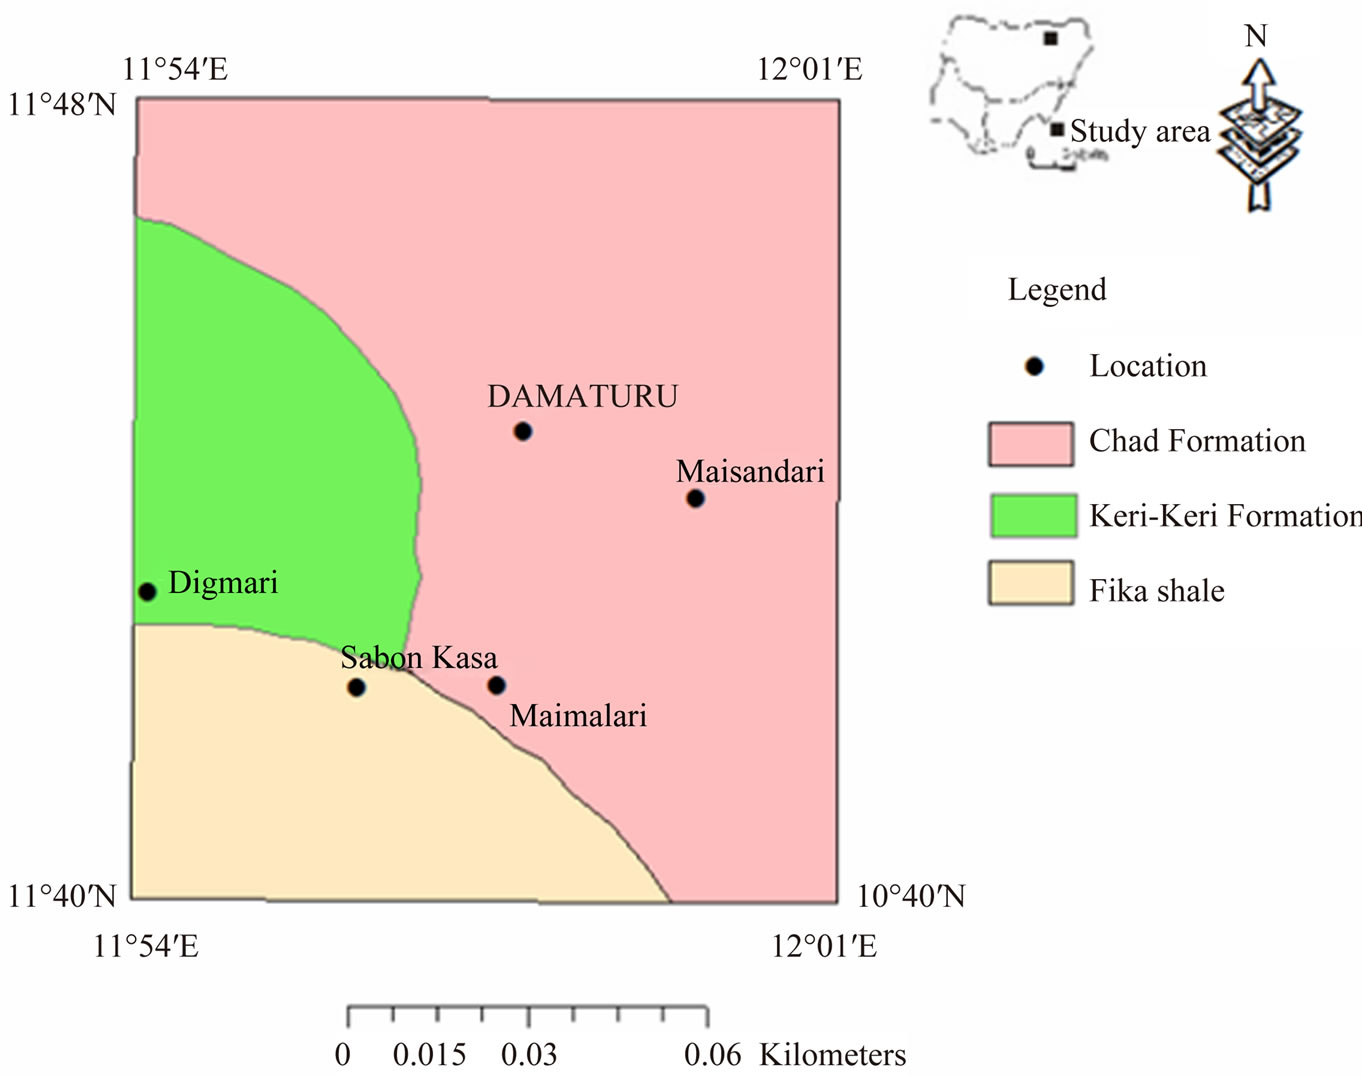
Figure 2. Geologic map of the study area.
water-table conditions, in perched aquifers, confined and semi-confined conditions [7]. The Chad Formation is the most important groundwater unit in the Chad basin. Groundwater occurs in three aquifer systems designated as upper, middle and lower groundwater aquifers [17]. The upper zone is sandy to clayey and has thickness of about 1 m to 10 m [18]. The zone is known to have a depth limit of 105 m below ground level in Maiduguri and consists of lenses of fine to very coarse grain, often pebbly sands alternating with clays and sandy clays [14]. The zone apparently does not extend far to the east and south of Damaturu but may persist for some kilometers to the west [19]. It is considered that water occur under semiconfined condition by the overlying silty clay [7]. The middle aquifer is separated from the upper zone aquifer by about 150 m of plastic clays. The middle zone is under confined condition by these clays, which is in turn separated from the lower zone aquifer by another layer of about 120 m thickness of clay and shale [14]. The zone varies in thickness from few metres to over 122 m [7]. The thickness varies from 61 m to 91 m in the study area [19]. The zone is the most heavily tapped artesian aquifer in the basin, and yields of boreholes could be as high as 90 m3/hr [18]. The lower zone consists of mainly lacustrine and deltaic sediments that contain ferruginous grit. It is separated from the middle zone by about 150 m thick clay [18]. The zone extends from about 463 m to 533 m below ground surface. The lower zone has been successfully located and developed as a source of groundwater by five wells at Maiduguri but it appears to have a relatively limited lateral extent near the town [7]. The Chad Formation underlies the central part of the study area and extends towards the north, northeastern and southeastern parts of the study area around Damaturu, Maisandari and Maimalari areas, respectively.
Depths of boreholes in the study area were found to range from 102 m to 216 m with an average of 129 m while depth to water ranges from 46.5 m to 66.8 m [19].
3. Materials and Methods
A total of 23 water samples were collected from boreholes use for water supply (Figure 1). According to Chilton [20], sampling of the discharge of existing boreholes is the most commonly used method. The sampling points were choosen in random based on the availability of the water sources, Before the collection of water samples, field parameters such as pH, EC and TDS were determined in the field using pH meter (Wagtech) and TDS/conductivity meter (HACH). Bicarbonate and carbonate were also determined at the well head during the sampling campaign using titrimetric method. The water samples were collected in one liter containers which were rinsed with samples to be collected [21] method. The samples were analyzed chemically using HACH spectrophotometer (DR/2000, USA) and flame photometer (ELE International. The water samples were analyzed at the Yobe State Water Corporation laboratory. Water levels were also measured from each of the 23 boreholes using electric water level sounder. The positions and altitudes of the boreholes were determined using Global Positioning System (GPS), and static water levels were subtracted from the altitudes to obtain the hydraulic head values. The results of the chemical analysis and hydraulic head values were inputted into GW_chart software to identify the different chemical facies characterizing each sample and hydraulic head distribution. Each of the chemical facies obtained from the GW_chart software was given a code, and was then inputted into ARC GIS geo-data base to generate the spatial distribution map of the water types [1]. The GIS method employed the use of 3D Inverse Distance Weighted (IDW)
The Statistical Package for Social Sciences (SPSS) [22] was used for the statistical analysis. The standardized z-scores was applied for R-mode hierarchical cluster analysis (HCA) to classify the data into groups based on similarity or dissimilarity [23]. In the HCA, Squared Euclidean distance was employed as a measure of similarity/ dissimilarity among the chemical parameters. The Squared Euclidean distance between any two locations x and y is determined using the equation as:
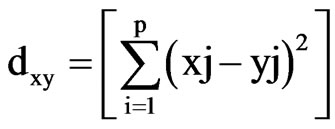 (1)
(1)
where j represents the parameter under consideration. The HCA [24] was used to detect multivariate similarities in groundwater quality data. The results are presented as dendrogram of the groups and their proximity.
GIS Modeling
The map showing the sampling points was scanned and imported into Arc GIS version 9.2 and was georeferenced and digitized. The positions of the sampling points were determined using Global Positioning System (GPS) and transferred into the digitized map of the study area based on their coordinates. Each sample point was assigned a unique code and stored in the attribute table. The concentrations of the ions form the geo-data base where the inverse distance weighted method was used to generate the spatial distribution maps. The different groundwater facies for the study area were delineated with Arc GIS 9.2. The Arc GIS Spatial Analyst adds a comprehensive and wide range of cell-based GIS functions and among the three main types of GIS data (raster, vector and TIN), the raster data structure provides the most comprehensive modeling environment and operated for spatial analysis [25]. The hydrochemical data considered for the modeling were TDS, Na+, Ca2+, Mg2+,  ,
,  ,
,  and Cl–. The chemical parameters were inputted into Gw_chart software to identify the different water types. Each sample point was assigned a symbol available in the Gw-chart software to characterize the water type for a particular location. The water type for each location was then inputted into the Arc GIS 9.2 software and assigned id (identification number) in the attribute table. The spatial interpolation using Inverse Distance Weighted (IDW) method was employed to generate the spatial distribution map of the different water facies. Inverse Distance Weighted (IDW) is an interpolation technique in which interpolated estimates are made based on values at nearby locations weighted only by distance from the interpolation location [26]. IDW method is based on the assumption that the value of an attribute z at some unvisited point is a distance weighted average of data points occurring within a neighbourhood or window surrounding the unvisited point [27]. The unknown value is estimated by the equation;
 (2)
(2)
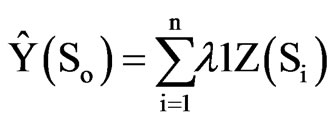
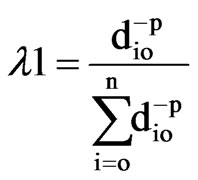
ρ Where, Ŷ (So) is the estimated value for an un-visited sampled location (So), n is the number of measured sample points surrounding the prediction location,  is the weight for each measured point, and Z(Si) is the observed value at location Si. The weight λ1 is calculated as follows:
 (3)
(3)
where,
 (4)
(4)
The weight is reduced by a factor ρ, as the distance increases, and dio is the distance between the predictions So and each of the measured location Si. Weighting of the sampled locations highly depends on the power parameter ρ, meaning that when distance increases the weight decreases exponentially. IDW belongs to the category of local deterministic methods of interpolation [28]. The disadvantage of IDW is that the quality of interpolation result can decrease, if the distribution of each sample data points is uneven, and also maximum and minimum values in the interpolated surface can occur at sample data points.
4. Results and Discussion
4.1. Hydrogeochemical Parameters of Groundwater
The results of groundwater quality data were presented statistically in form of minimum, maximum, mean and standard deviation (Table 1). Table 1 indicates that the pH of the water samples ranges from 6.0 to 8.8 with an average of 6.5, thus indicating acidic to alkaline condition. EC and TDS range from 100 µS/cm to 460 µS/cm and 55.1 mg/l to 230 mg/l with mean values of 196.4 µS/cm and 95.4 mg/l, respectively. The results of the
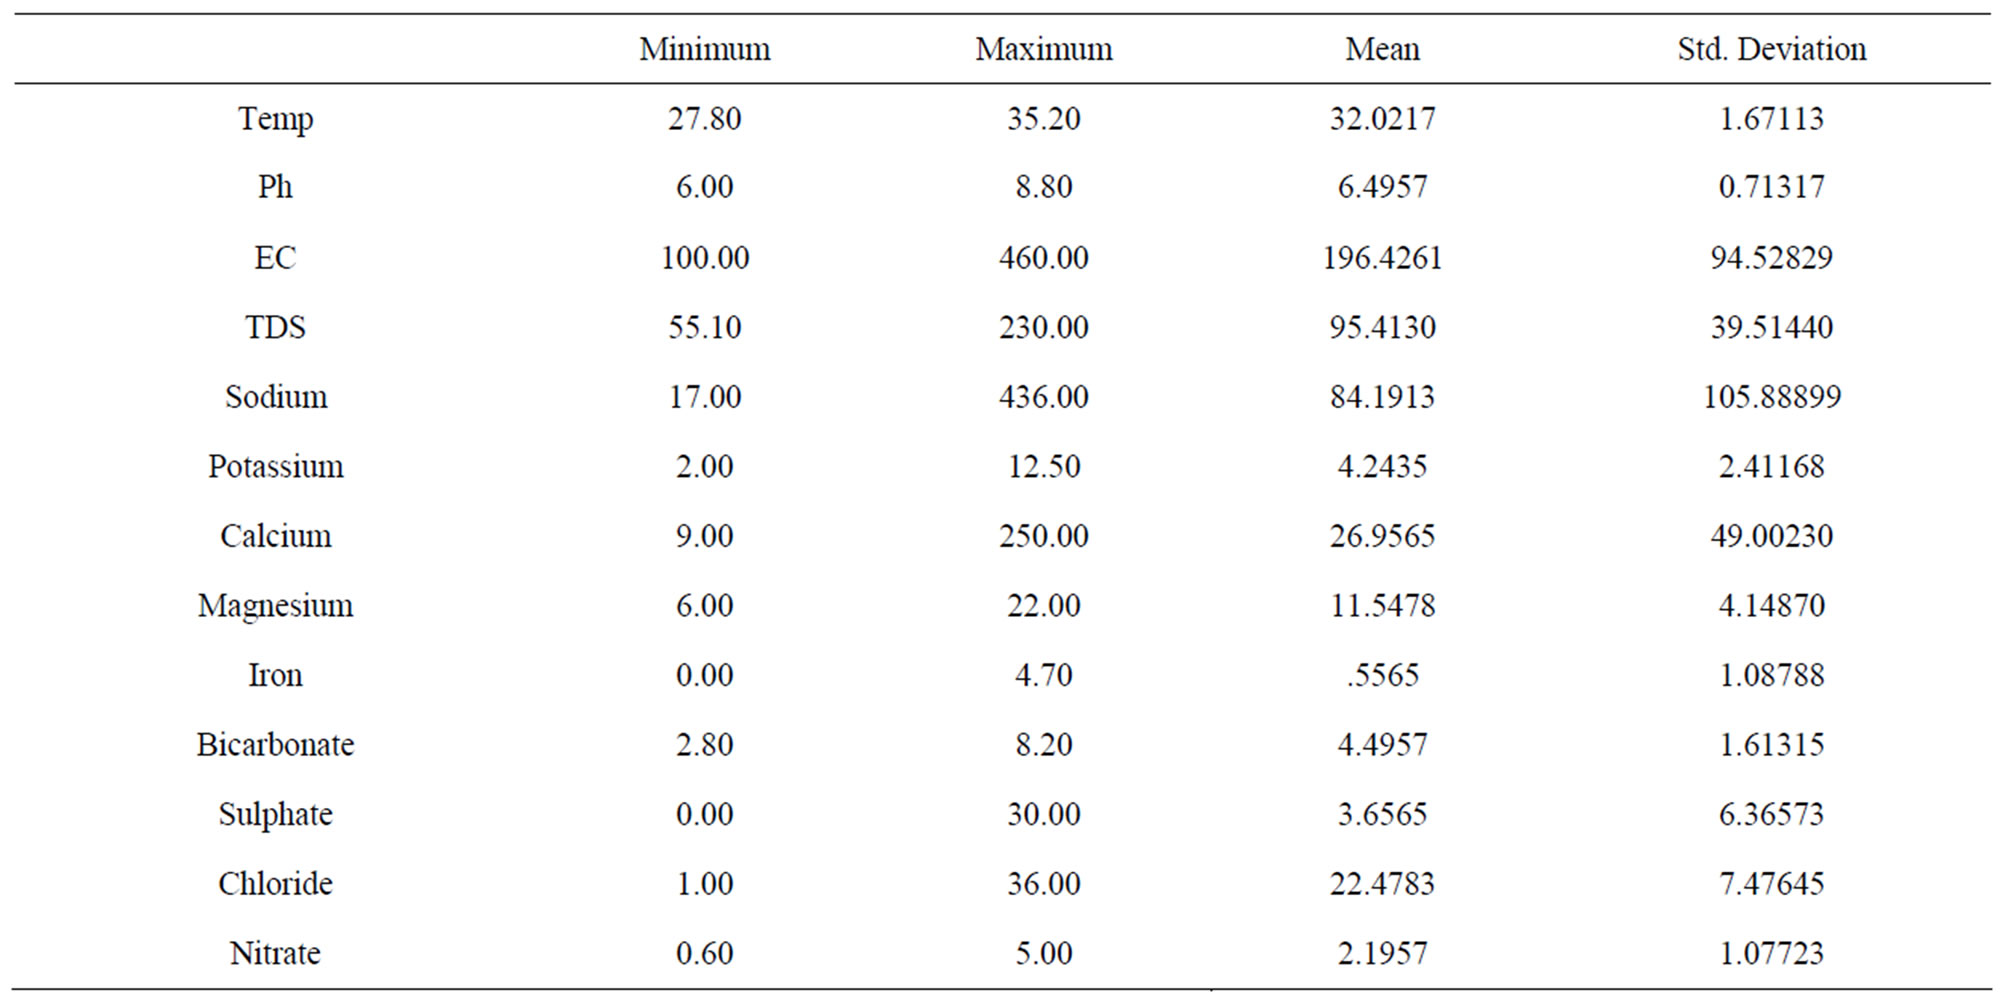
Table 1. Summary of groundwater data in the study area.
cations indicate that Na+ range from 17 mg/l to 436 mg/l, K+ ranges from 2 mg/l to 12.5 mg/l with mean values of 84.2 mg/l and 4.2 mg/l while Ca2+ ranges from 9 mg/l to 250 mg/l and Mg2+ ranges from 6 mg/l to 22 mg/l with mean values of 27 mg/l and 11.5 mg/l. Fe2+ concentrations range from 0.0 mg/l to 4.7 mg/l with mean value of 0.6 mg/l. The results of the anions reveal values from 2.8 mg/l to 8.2 mg/l for ,
,  ranges from 0.0 mg/l to 30 mg/l with averages of 4.5 mg/l and 3.7 mg/l, respectively.
  ranges from 1.0 mg/l to 36 mg/l with mean value of 22.5 mg/l while
  ranges from 0.6 mg/l to 5 mg/l with an average of 2.2 mg/l. Based on the mean values of the chemical parameters, the cations were in the order of abundance as Na+ > Ca2+ > Mg2+ > K+ > Fe2+ while the anions reveal order of abundance as Cl– >
  >
>  >
> . The spatial distribution of sodium was classified on the basis of highest desirable level of 200 mg/l [29] (Figure 3). High sodium concentrations occur in the central part of the map and extend towards the extreme north. The high sodium concentrations occur in the Keri-Keri and Chad formations and are attributed to weathering of plagioclase feldspars. Figure 4 reveals low chloride distribution over the entire area of the map and the high concentrations of chloride over the anions could be attributed to sewage effluent, application of chemical fertilizers and house hold solid wastes. Chloride could have not resulted from evaporate since the source of evaporite may be unlikely in the area. Figure 5 shows the spatial distribution of TDS which indicates concentrations occurring below permissible limit of 500 mg/l [29], which suggests that the groundwater in the area is characterized by low degree of mineralization.
4.2. Groundwater Flow Pattern and Distribution of Chemical Facies
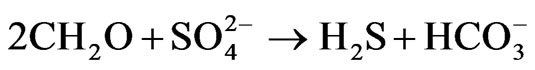
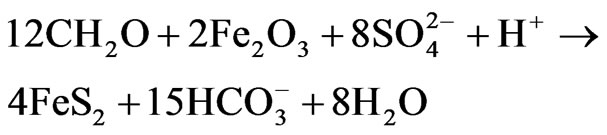
In Figure 6, the recharge areas are designated as zone A while the discharge areas are designated as zone B. Groundwater flow occurs at the extreme south and flows towards the east and western part of the study area. Another recharge area is located around the Digmari area and flows towards the discharge area east of Digmari. Recharge area also occurs around Maisandari area and flows towards the east and northeastern parts of the study area. Groundwater flow also occurs from the recharge area around Damaturu area and flows towards the extreme north, towards the south and northeastern parts. Figure 6 reveal Ca-Mg-SO4-Cl and Na-SO4-Cl water types in the study area. The Ca-Mg-SO4-Cl constitute about 35% of the water types while the Na-SO4-Cl is the dominant water type and constitutes about 65% of the water type. The Ca-Mg-SO4-Cl facies is dominant in the recharge areas (Figure 6) which is an indication that the chemical evolutionary trend appears to be strongly related to reverse cation exchange and simple hydrochemical mixing. The interaction between Ca-Mg-HCO3 and Na-SO4-Cl resulted in the evolution of the Ca-Mg-SO4- Cl water type. The Ca-Mg-HCO3 is regarded as recently recharge water and its sources are related to atmospheric precipitation and dissolution of silicate minerals [30]. The Ca and Mg could be released from silicate minerals by weathering due to the action of weak carbonic acid. Bicarbonate could result from the interaction between organic matters, nitrate, iron and hydrogensulphide through the following equations:
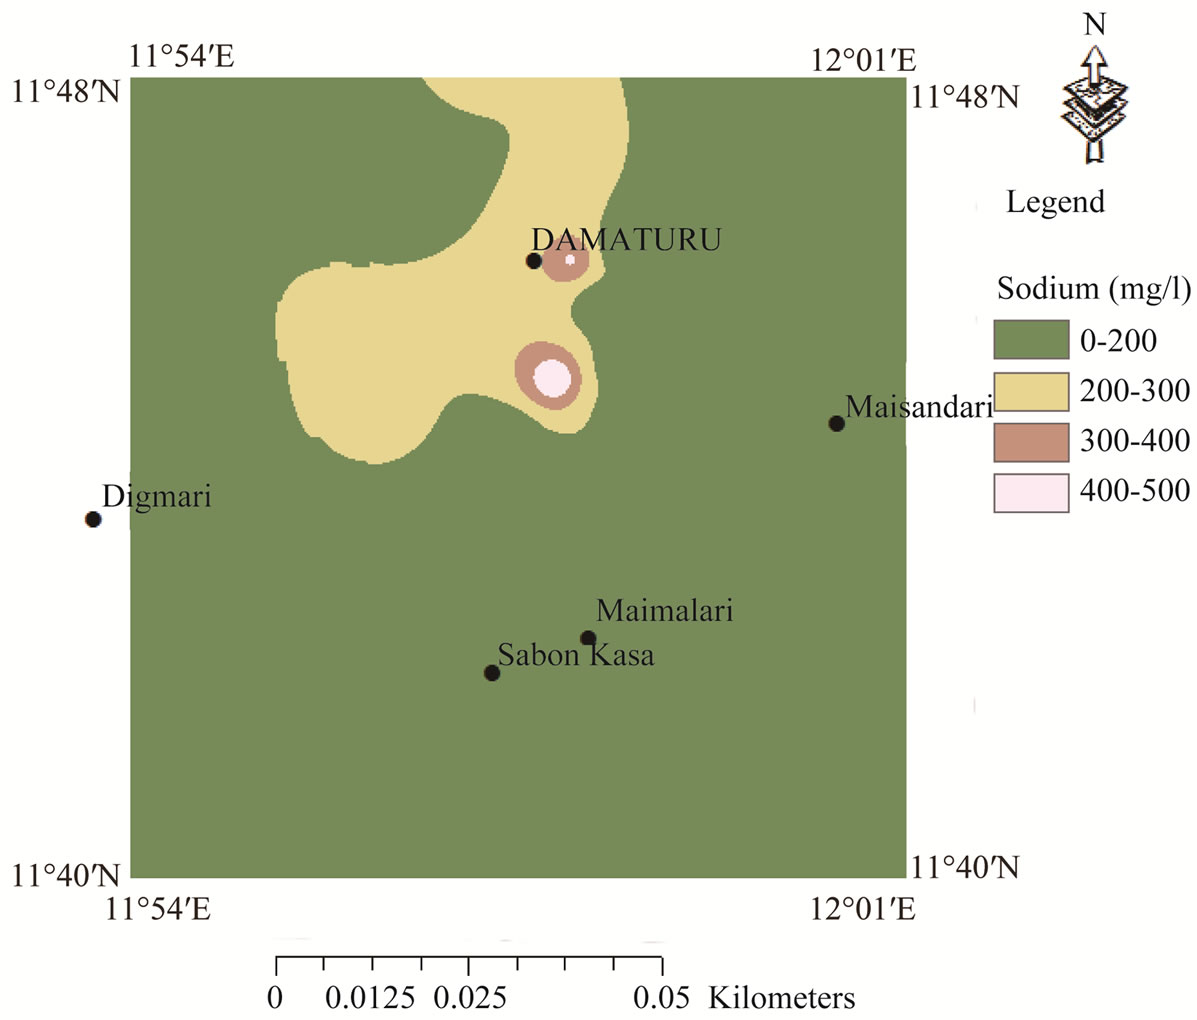
Figure 3. Spatial distribution of sodium concentrations in the study area.
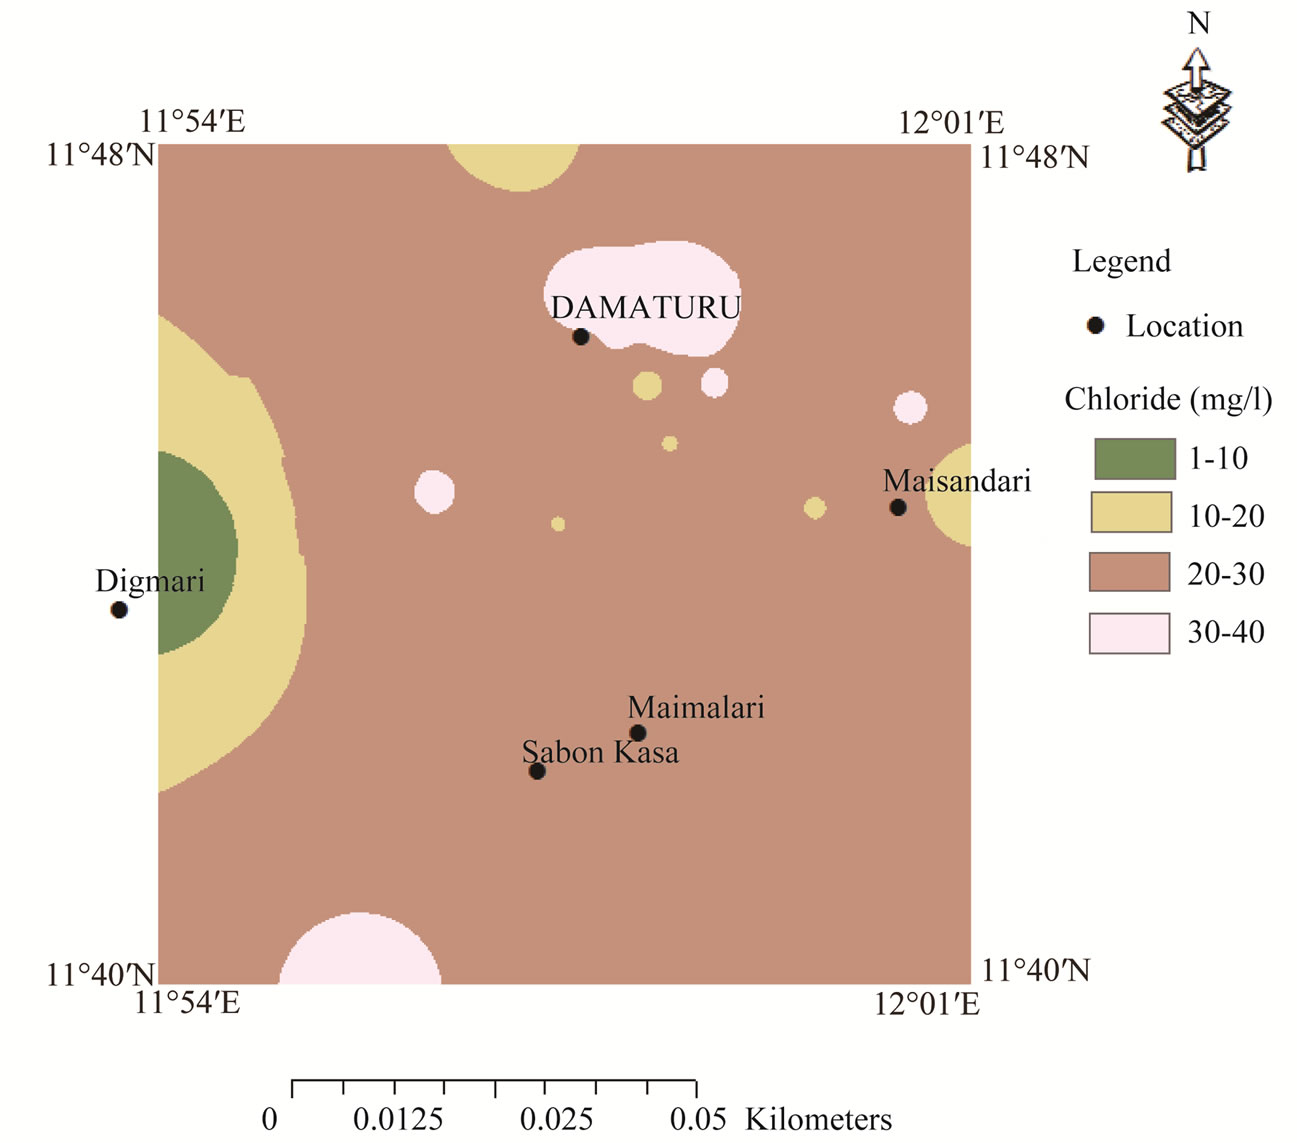
Figure 4. Spatial distribution of chloride concentrations in the study area.
 (5)
(5)
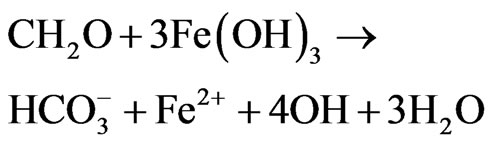 (6)
(6)
 (7)
(7)
The Na-SO4-Cl facies represents the fossil groundwater in the area which could be attributed to anthropogenic activities such as sewage effluents, application of chemical fertilizers and indiscriminate house hold solid wastes disposal. The Na-SO4-Cl facies could also be due to high rate of evapotranspiration. According to FAO WA-
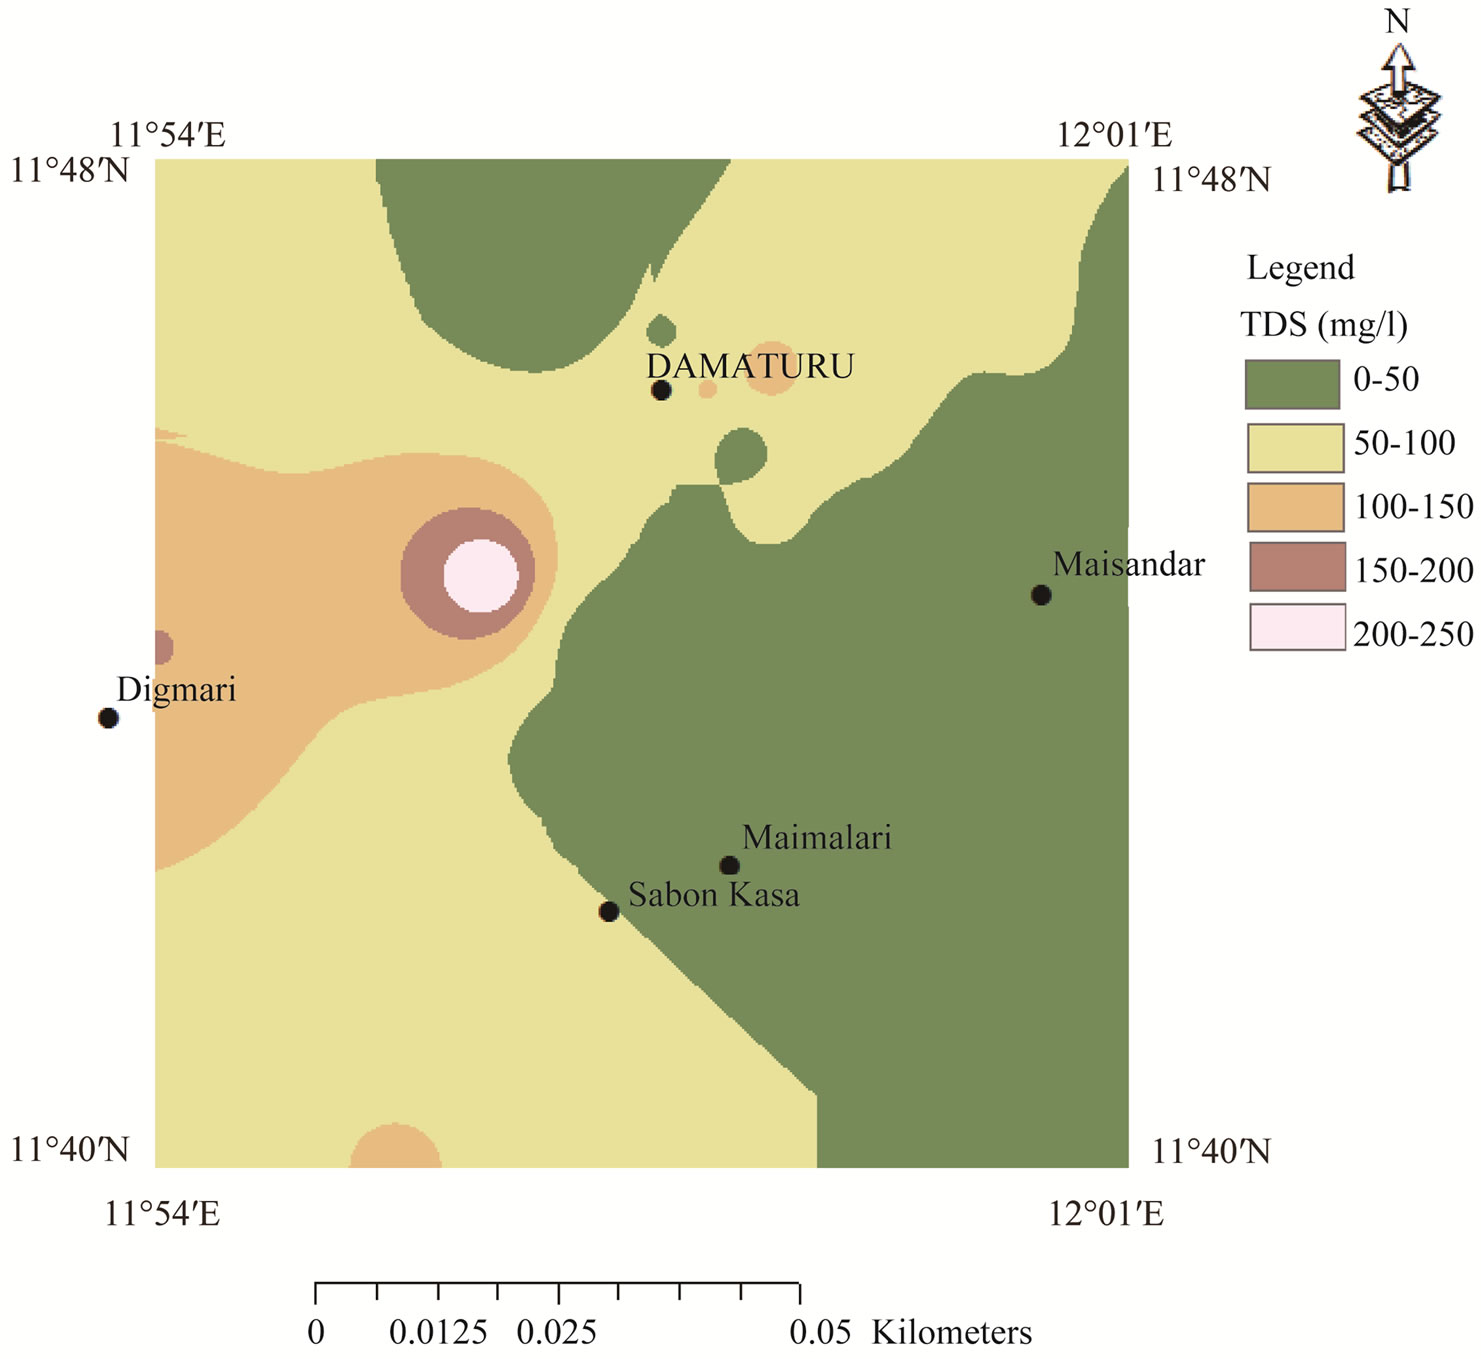
Figure 5. Spatial distribution of TDS concentrations in the study area.
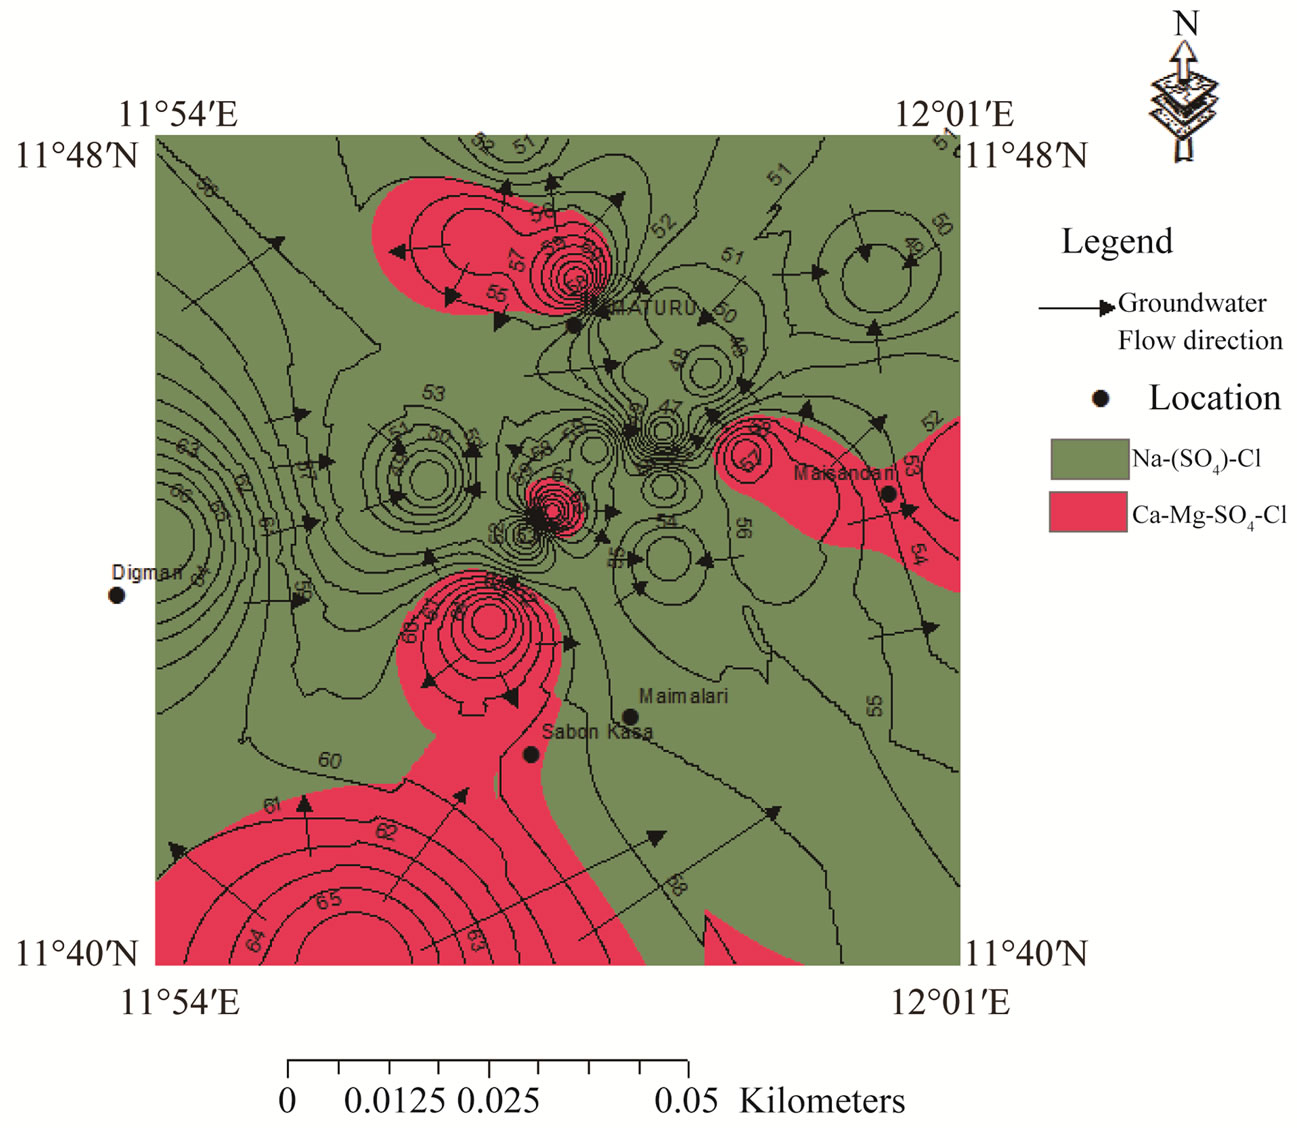
Figure 6. Groundwater flow pattern in confined aquifer and distribution of chemical facies.
TER [31] that the Chad basin is characterized by high rate of evapotranspiration of 2200 mm/yr which limit the rate of groundwater recharge. Figure 6 indicates that the Na-SO4-Cl facies prevail in the discharge areas which is an indication that cation exchange is the dominant process in the discharge areas.
4.3. Rock-Water Interaction
During weathering and water circulation in rocks and soils, ions leached out and dissolved in groundwater [32]. The geological formations, water-rock interaction and relative mobility of ions are prime factors influencing the geochemistry of groundwater [33]. The use of scattered plots for TDS vs Na/(Na + Ca) and TDS vs. Cl/(Cl + HCO3) [34] can be used to identify rock-water interaction processes. Figures 7 and 8 indicate that most points plotted in the region of rock-dominance, thus indicating precipitation induced chemical weathering along with the dissolution of rock-forming minerals which have contributed in the modification of groundwater chemistry.
4.3.1. Relative Abundance of Ions Calcium and Magnesium
Among the cations, Ca and Mg are the dominant ions in groundwater which are influenced by the dissolution of carbonate minerals [1]. [35] explained this through the scattered plots of (Ca + Mg) vs (HCO3 + SO4). In the scattered plots, the ionic concentrations falling above the equiline result from carbonate weathering [36]. Figure 9 scattered plots of (Ca + Mg) vs (HCO3 + SO4) indicate that 91% of the samples lie above the equiline of 1:1, thus indicating carbonate weathering. Carbonate weathering results from the action of rainwater impregnated with CO2 and becomes rich in carbonic acid [37]. The carbonic acid influences the dissolution of carbonate minerals (Calcite and dolomite) in the aquifer system. The release of Ca and Mg into groundwater is accomplished by the following equation:
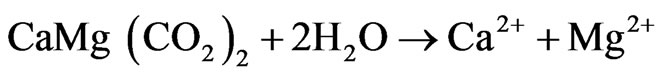 (8)
(8)
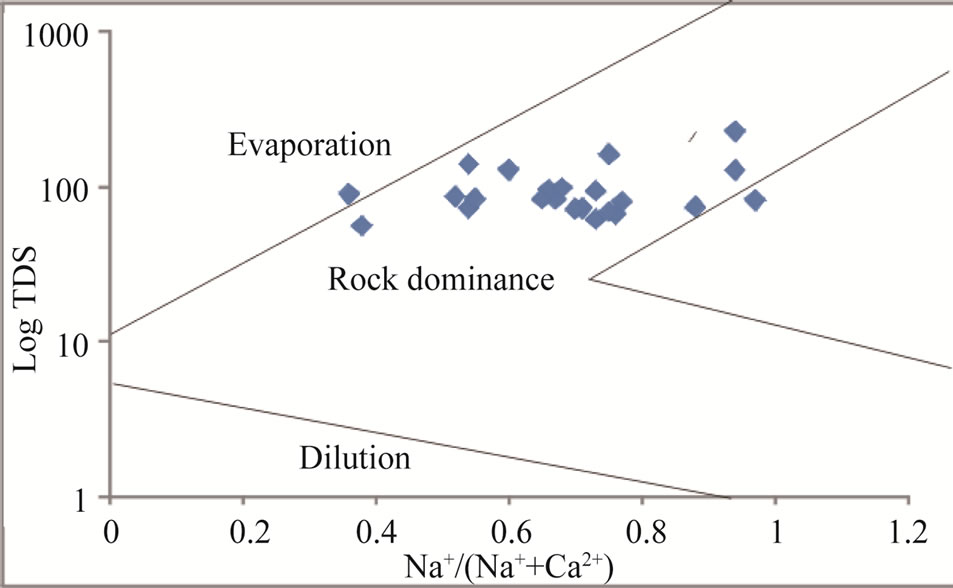
Figure 7. Rock-water interaction for the study area.
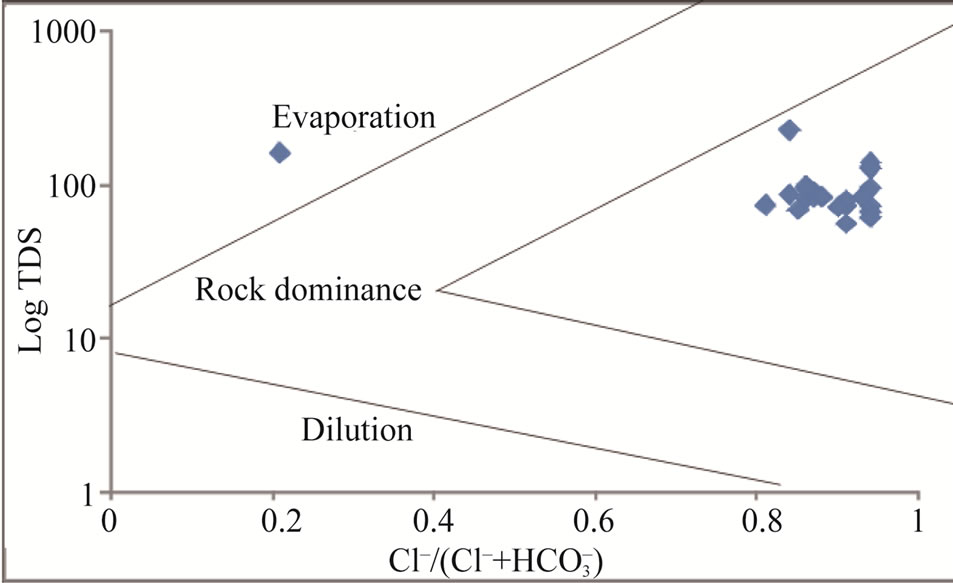
Figure 8. Rock-water interaction for the study area.
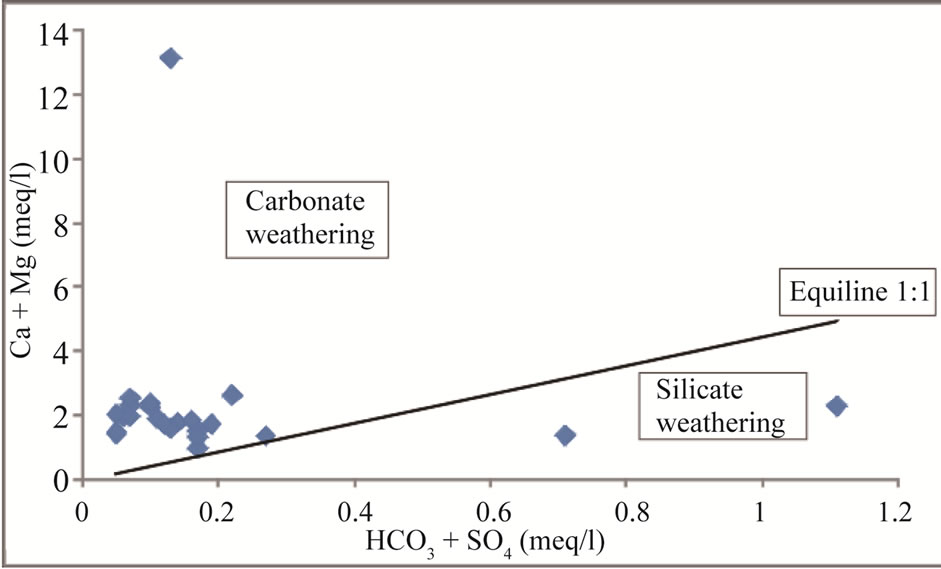
Figure 9. (Ca + Mg) vs (HCO3 + SO4) scatter diagram for the study area.
4.3.2. Sodium and Potassium
Sodium is one of the important naturally occurring cation and its concentration in fresh water is generally lower than Ca and Mg [25]. Generally, when halite dissolution is the process, Na+ vs Cl– relationship gives 1:1 ratio [37]. Figure 10 indicates that 83% of the samples plotted above the equiline, thus suggesting absence of halite dissolution. Figures 11 and 12 reveal that sodium is reduced from groundwater due to cation exchange process.
4.3.3. Bicarbonate and Sulphate
The scatter plot of Na vs HCO3 (Figure 13) reveals that  can be released by silicate weathering [37]. The increased concentration of
  compared to Na concentration in groundwater in groundwater suggests silicate weathering [38]. [37] Indicated that the weathering process is accomplished through the following equation:
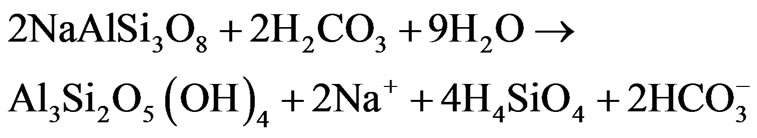 (9)
(9)
The scatter plots diagram for  vs Cl– (Figure 14) indicates that most points plotted above the equiline 1:1, only one sample plotted below the equiline. Groundwater with high chloride and low sulphate probably indicates sulphate reduction [35]. Sulphate reduction can be ex-
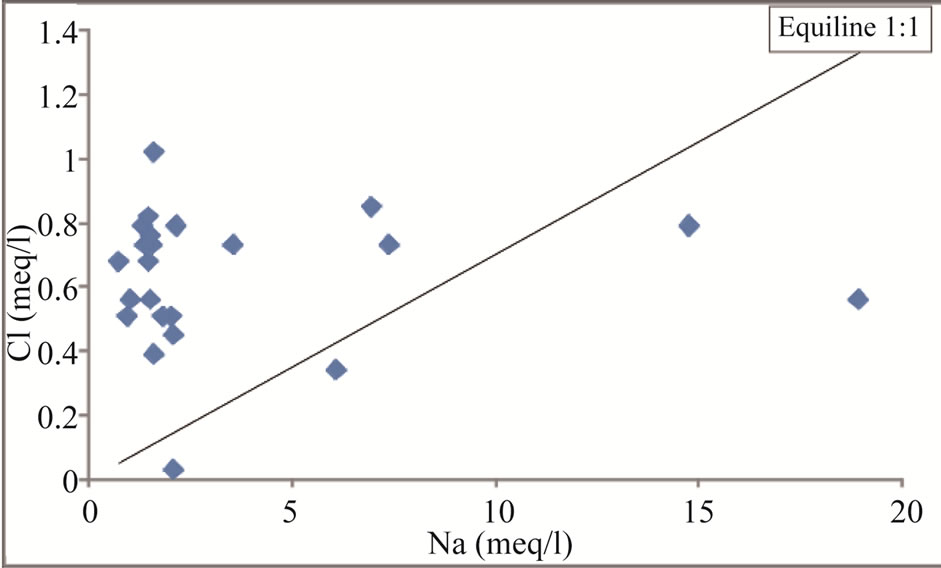
Figure 10. Na vs Cl scatter diagram for the study area.
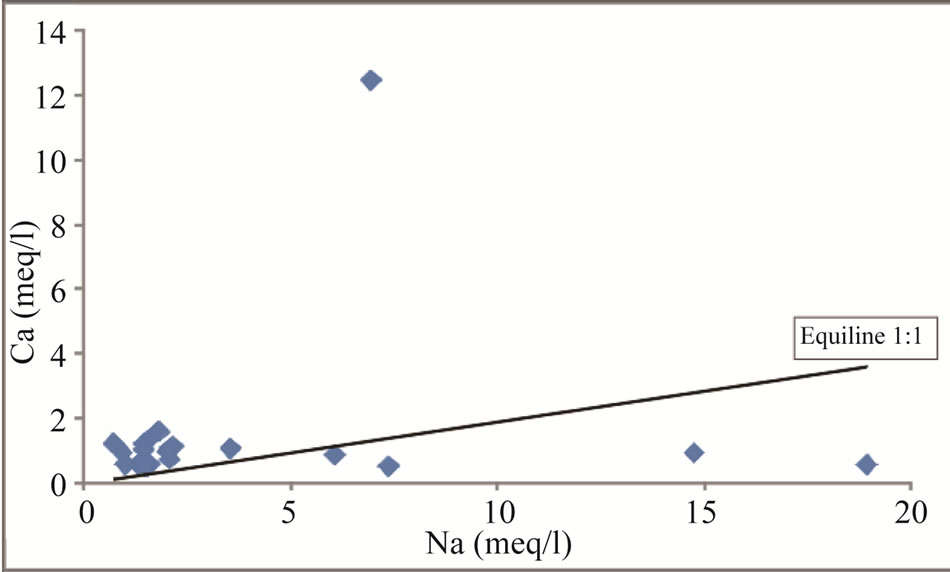
Figure 11. Na vs Ca scatter diagram for the study area.
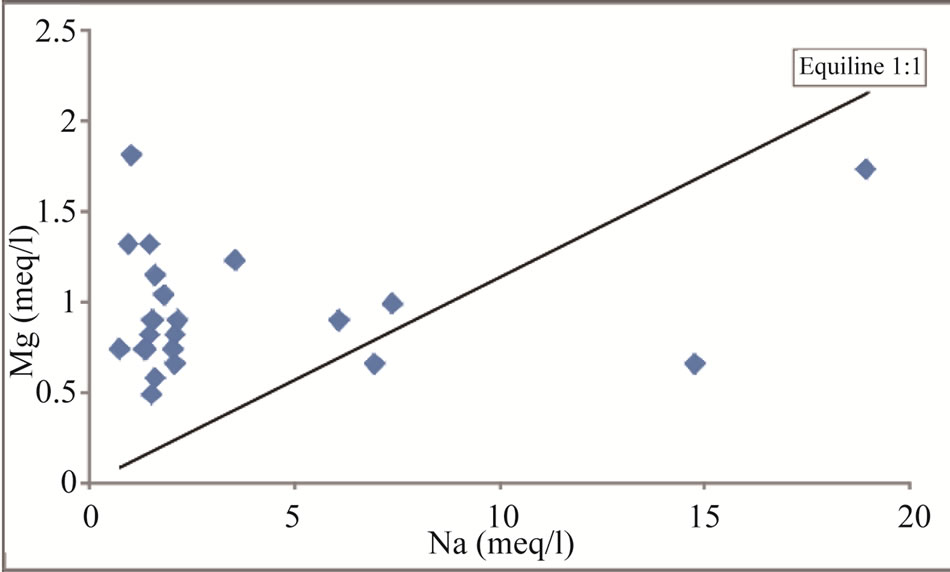
Figure 12. Na vs Mg scatter diagram for the study area.
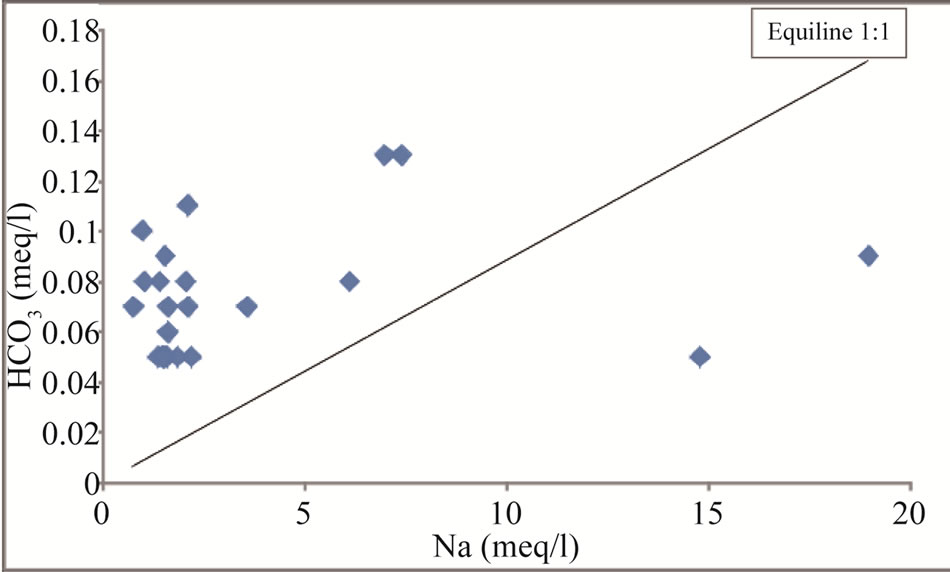
Figure 13. Na vs HCO3 scatter diagram for the study area.
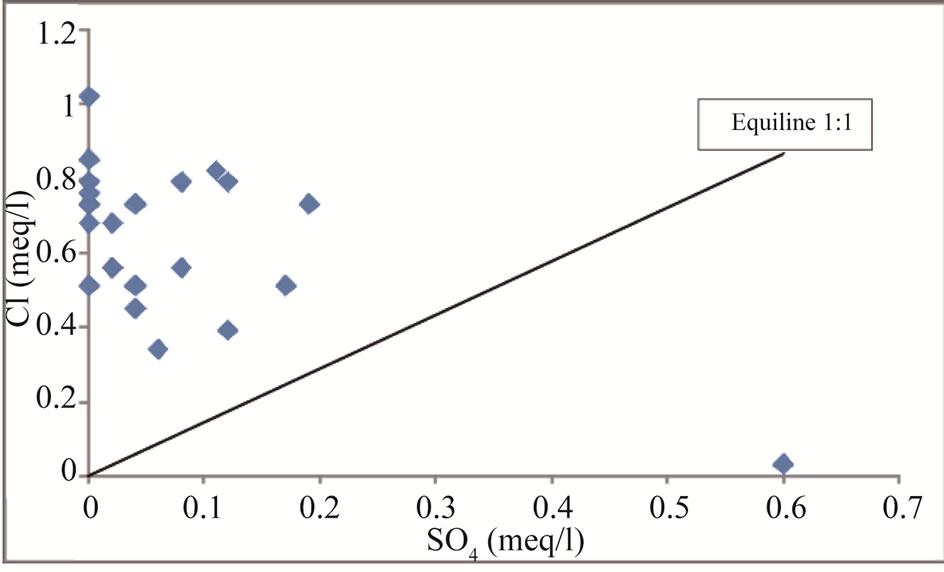
Figure 14. SO4 vs Cl scatter diagram for the study area.
plained through the following equation [39]:
 (10)
(10)
The results of the HCA is presented in form of dendrgram (Figure 15) indicates two main groups. The first group consists of pH, EC, TDS, bicarbonate, calcium and sulphate in close association. This group is interpreted as the effects of rock-water interaction, leading to silicate weathering. The second group consists of potassium, nitrate, sodium, magnesium, temperature, chloride and iron in close association. This group is interpreted as effects of anthropogenic activities, such as application of chemical fertilizers, sewage effluents and indiscriminate dumping of house hold solid wastes in the area.
5. Conclusion
Results of 23 groundwater quality data indicate that the cations reveal mean values as Na+ (84.2 mg/l), K+ (4.2 mg/l), Ca2+ (27 mg/l), Mg2+ (11.5 mg/l) and Fe2+ (0.6 mg/l). The anion mean values are  (4.5 mg/l),
  (3.7 mg/l), Cl– (22.5 mg/l) and
  (2.2 mg/l). Based on mean values, the cations were in order of abundance as Na+ > Ca2+ > Mg2+ > K+ > Fe2+ while the anions reveal order of abundance as Cl– >
  >
>  >
> . The high mean concentration of sodium is attributed to weathering of plagioclase feldspars while sewage effluents, application of chemical fertilizers and indiscriminate dumping of house hold solid wastes are the major sources of chloride in the area. The geographical information system (GIS) using Inverse Distance Weighted (IDW) delineated two groundwater zones into: Ca-Mg-SO4-Cl and Na-SO4-Cl water types. The Ca-MgSO4-Cl constitutes about 35% of the chemical facies and its evolutionary trend is due to simple hydrochemical mixing between Ca-Mg-HCO3 and Na-SO4-Cl facies and reverse cation exchange. The Na-SO4-Cl facies constitutes about 65% of the chemical facies and represents fossil groundwater. The Ca-Mg-SO4-Cl facies is domi-
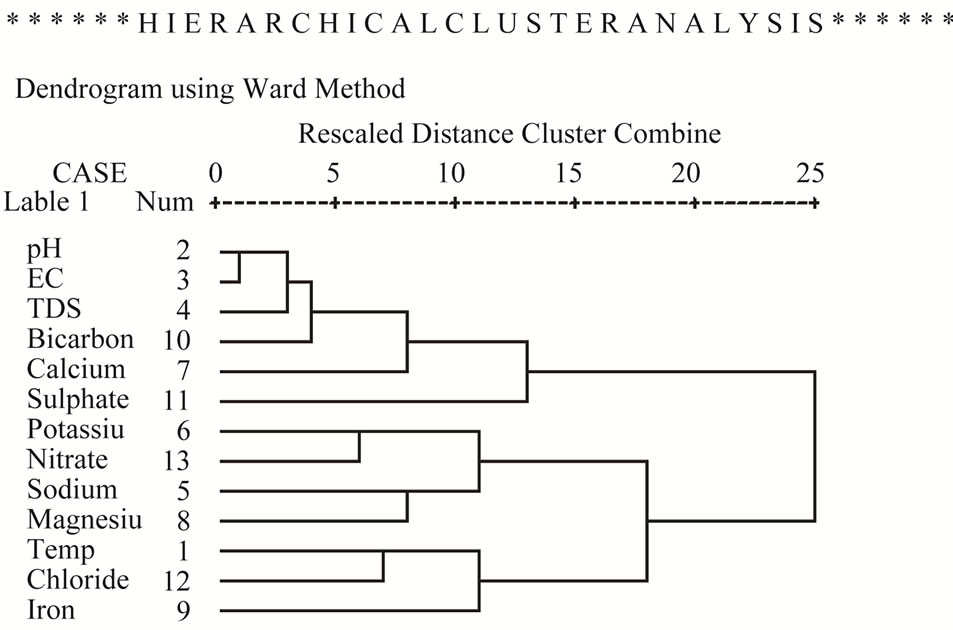
Figure 15. Dendrogram of groundwater samples in the study area.
nant in the recharge areas while Na-SO4-Cl facies prevail in discharge areas. The plots of TDS vs Na/(Na + Ca) and TDS vs Cl/(Cl + HCO3) indicates most points plotted in the region of rock-dominance, thus suggesting precipitation induced chemical weathering along with the dissolution of rock-forming minerals. Plots of scattered diagrams among ions reveal the major geochemical processes as carbonate weathering, silicate weathering, cation exchange and sulphate reduction. HCA identified effects of rock-water interaction leading to silicate weathering and anthropogenic effects following the application of chemical fertilizers, sewage effluents and indiscriminate disposal of house hold solid wastes as the major processes responsible in the modification of groundwater quality.
6. Acknowledgements
The authors are grateful to Yobe State Water Board Damaturu for helping us with field equipment and also for carrying out the chemical analysis in their laboratory.
REFERENCES
- A. Nur, J. M. Ishaku and A. Tayib, “Spatial Distribution of Chemical Facies Using Geographical Information System (GIS) in Michika, Northeastern Nigeria,” Research Journal in Engineering and Applied Sciences, Vol. 1, No. 2, 2012, pp. 102-109.
- A, Shahbazi and A. Esmaeili-Sari, “Groundwater Quality Assessment in North of Iran: A case Study of the Mazandaran Province,” World Applied Sciences Journal, Vol. 5, 2009, 92-97.
- D. U. Ophori and J. Tòth, “Patterns of Ground-Water Chemistry, Ross Creek Basin, Alberta, Canada,” Ground Water, 1989, vol. 27, No. 1, pp 20-26. doi:10.1111/j.1745-6584.1989.tb00003.x
- W. Back, “Hydrogeochemical Facies and Groundwater Flow Patterns in Northern Part of Atlantic Coastal Plain,” US Geological Survey Professional Paper, Vol. 498A, 1966, p. 42.
- J. M. Ishaku, A. Nur and J. A. Bulus, “Mapping of Groundwater Facies Using Anion Geochemistry in Angware Area, Jos Northcentral Nigeria,” Research Journal of Chemical Sciences, Vol. 2, No. 6, 2012, pp. 21-29
- NPC, “Population of the Federal Republic of Nigeria, Yobe State Statistical Tables, National Population Commission Final Results of Population Census of Nigeria,” National Population Commission.
- J. W. Du Preez and W. Barber, “The Distribution and Chemical Quality of Groundwater in Northern Nigeria,” Geological Survey of Nigeria, Vol. 36, 1965, pp. 1-93.
- D. O. Emeka and O. M. Weltime, “Trace Elements Determination in Municipal Water Supply in Damaturu Metropolis, Yobe State, Nigeria,” Bayero Journal of Pure and Applied Sciences, Vol. 1, No. 1, 2008, pp. 58-61.
- T. Hess, W. Stephens and G. Thomas, “Modelling NDVIB from Decadal Rainfall Data in the North East Arid Zone of Nigeria,” Journal of Environmental Management, Vol. 48, No. 3, 1996, pp. 249-261. doi:10.1006/jema.1996.0076
- G. E. Oteze and E. O. Fayose, “Regional Developments in Hydrogeology of the Chad Basin Water Resources,” Journal of Nigerian Association of Hydrogeologists, Vol. 1, No. 1, 1988, pp. 9-29.
- E. A. Okosun, “A Preliminary Assessment of the Petroleum Potentials from Southwest Chad Basin, Nigeria,” Borno Journal of Geology, Vol. 2, No. 2, 2000, pp. 40- 50.
- M. S. Chaanda, N. G. Obaje, U. A. Lar and A. Moumouni, “Petroleum Geochemistry of Kuchalli-1in the Nigerian Sector of the Chad Basin,” Continental Journal of Earth Sciences, Vol. 1, 2007, pp. 18-24.
- G. Matheis, “Short Review of the Geology of the Chad basin in N.E Nigeria,” In: C. A. Kogbe, Ed., Geology of Nigeria, Elizabethan publishing Co., Lagos, 1976, pp 289- 294
- M. E. Offodile, “Groundwater Supply and Development in Nigeria,” Meco Geology and Engineering Services (Jos), 2002.
- W. M. Barber and D. R. Jones, “Geology and Hydrology of Maiduguri,” Records of Geological Survey, Borno State Province, 1960.
- C. Raeburn and B. Jones, “The Chad Basin: Geology and Water Supply, Geological Survey of Nigeria,” Geological Survey Bulletin, No. 15, 1934.
- C. A. Kogbe, K. Schoeneich and E. I. Ebah, “Hydrogeological Frame Work of Maiduguri Metropolis in the Chad Basin, Northeast Nigeria,” 5th Conference of the Nigerian Association of Hydrogeologists (NAH), Minna, 1992.
- M. O. Olugboye, “Revision Notebook on Hydrogeological Practices,” World Meteorological Organization, 2008.
- Y. N. Solomon, “Hydro-Geoelectrical Investigation of Damaturu Town, Northeastern Nigeria”, M.Sc Thesis, Department of Geology, Federal University of Technology, Yola, 2006.
- J. Chilton, “Groundwater Water Quality Assessment—A Guide to Use of Biota; Sediments and Water in Environmental Monitoring,” 2nd Edition, UNESCO/WHO/UNEP, 1992.
- M. J. Barcelona, J. P. Gibb, J. A. Helfrich and E. E. Garske, “Practical Guide for Groundwater Sampling,” ISWS Contract Report 374, Illinois State Water Survey Campaign, 1985.
- Raynald Levesque and SPSS Inc., “SPSS 15.0,” SPSS Inc., Chicago, 2006.
- B. Banoeng-Yakubo, S. M. Yidama, Y. Anku, T. Akabzaa and D. Asiedu, “Water Quality Characterization in Some Birimian Aquifers of the Birim Basin, Ghana,” Journal of Civil Engineering, Vol. 13, No. 3, 2009, pp. 179-187
- J. H. Ward, “Hierarchial Grouping to Optimize Objective Function,” Journal of the American Statistical Association, Vol. 69, 1963, pp. 236-244. doi:10.1080/01621459.1963.10500845
- N. Kannan and S. Joseph, “Quality of Groundwater in the Shallow Aquifers of a Paddy Dominated Agricultural River Basin, Kerala, India,” International Journal of Civil and Environmental Engineering, Vol. 2, No. 3, 2010, pp. 160-178
- S. Naoum and I. K. Tsanis, “Ranking of Spatial Interpolation Techniques Using a GIS-based DSS,” GLOBAL NEST: The International Journal, Vol. 6, No. 1, 2004, pp. 1-20.
- C. G. Karydas, I. Z. Gitas, E. Koutsogiannaki, N. Lydakis-Simantiris and G. N. Silleous, “Evaluation of Spatial Interpolation Techniques for Mapping Agricultural Top Soil Properties in Crete,” EARSel eProceedings, Vol. 8, No. 1, 2009, pp. 26-39.
- P. A. Burrough and R. A. Mcdonnell, “Principles of Geographic Information Systems,” Oxford University Press, Oxford, 1998.
- WHO, “Guidelines for Drinking Water Quality,” Geneva, 1996.
- J. M. Ishaku, “Hydrochemical Evolution of Groundwater in Jimeta-Yola Area, Northeastern Nigeria,” Global Journal of Geological Sciences, Vol. 9, No. 1, 2011, pp. 99- 121.
- FAO WATER, “Adaptive Water Management in the Lake Chad Basin,” Addressing Current Challenges and Adapting Future Needs, World Water Week, Stockholm, 2009.
- S. Naseem, S. Hamza and E. Bashir, “Groundwater Geochemistry of Winder Agricultural Farms, Balochistan, Pakistan and Assessment for Irrigation Water Quality,” European Water, Vol. 31, 2010, pp. 21-32.
- A. F. Yousef, A. A. Saleem, A. M. Baraka and O. S. H. Aglan, “The Impact of Geological Setting on the Groundwater Occurrences in Some Wadis in Shlatein-Abu Ramad Area, SE Desert, Egypt,” European Water, Vol. 25-26, 2009, pp. 53-68.
- R. J. Gibbs, “Mechanisms Controlling World’s Water Chemistry,” Science, Vol. 170, No. 3962, 1970, pp. 1088- 1090. doi:10.1126/science.170.3962.1088
- P. S. Datta and S. K. Tyagi, “Major Ion Chemistry of Groundwater in Delhi Area: Chemical Weathering Processes and Groundwater Flow Regime,” Journal of Geological Society of India, Vol. 47, 1996, pp. 179-188.
- A. G. Dehnavi, R. Sarikhani and D. Nagaraju,” Hydrogeochemical and Rock Water Interaction Studies in East of Kurdistan, N-W of Iran,” International Journal of Environmental Sciences and Research, Vol. 1, No. 1, 2011, pp. 16-22.
- K. M. Nayak and H. K. Sahood, “Assessment of Groundwater Quality in Tangi-Choudwar and Cuttack Blocks of Cuttack District, Orissa, India,” International Journal of Earth Sciences and Engineering, Vol. 4, No. 6, 2011, pp. 973-985.
- S. R. Fisher and W. F. Mullican, “Hydrogeochemical Evaluation of Sodium-Sulphate and Sodium-Chloride Groundwater beneath the Northern Chihu Texas, USA,” Hydrogeology Journal, Vol. 5, No. 2, 1997, pp. 4-16.
- J. I. Drever, “The Geochemistry of Natural Waters,” Prentice Hall, Englewood Cliffs, 1988.
NOTES
*Corresponding author.