International Journal of Geosciences
Vol. 3 No. 4 (2012) , Article ID: 22922 , 9 pages DOI:10.4236/ijg.2012.34075
Correlation of Seismic P-Wave Velocities with Engineering Parameters (N Value and Rock Quality) for Tropical Environmental Study
Geophysics Section, School of Physics, Universiti Sains Malaysia, Penang, Malaysia
Email: andersonbery@yahoo.com.my
Received February 17, 2012; revised March 19, 2012; accepted March 28, 2012
Keywords: Geoscientists; Geophysical; N Value; Rock Quality; Environmental
ABSTRACT
The physical parameters of the subsurface from the environmental site investigation are important for geoscientists and engineers to understand and very low cost-effective method, especially when combined with geophysical (seismic) and geotechnical (borehole) surveys. These parameters can be estimated from other obtained parameters. In this study, P-wave velocities of materials (soils and rocks) are studied both in the laboratory and field measurement. The obtained P-wave velocities are then compared with the engineering parameters such N values, rock quality, friction angle, relative density, velocity index, density and penetration strength from boreholes. The empirical correlations were also found in this study for selected parameters. The estimation of engineering parameters from P-wave seismic velocity values is applicable for tropical environmental study. It is found that, the ratio (VFIELD/VLAB) when squared, was numerically close to the value of percentage RQD. We found that the empirical correlation for tropical environmental study is 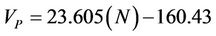 and the regression found is 0.9315 (93.15%). Meanwhile, the empirical correlation between P-wave velocities and RQD values is found as
  and the regression found is 0.8377 (83.77%). The correlation between apparent P-wave velocities with penetration strength for both study sites are found as
  and the regression coefficient is found as 0.9756. Thus, this study helps for the estimation and prediction the properties of the subsurface material (soils and rocks) especially in reducing the cost of investigation and increase the understanding of the Earth’s subsurface characterizations physical parameters.
1. Introduction
In environmental study, there are many physical parameters can take into our consideration before making important decision for civil construction. These physical parameters play important role in indicating their behaviour which is due to time and condition changes. In this study, the data for the seismic refraction (tomography) method is correlated with the borehole data collected from the study site. The correlation found in this study could help in determine the signature of engineering parameters from infield data. Effort to relate rock quality and seismic velocity have been made at intervals, during the development and integration of rock engineering and engineering geology.
The in-situ behaviour of soils is complex because it is heavily dependent upon numerous factors. To acquire appropriate understanding, it is necessary to analyze them not only through geophysics and geotechnical engineering skills but also through other associated disciplines like geology, geomorphology, climatology and other earth and atmosphere related sciences [1].
Seismic refraction investigates the subsurface by generating arrival time and offset distance information to determine the path and velocity of the elastic disturbance in the ground. The disturbance is created by shot, hammer, weight drop, or some other comparable method for putting impulsive energy into the ground. Detectors lie out at regular intervals; measure the first arrival of the energy and its time. The data are plotted in time—distance graphs from which the velocities of the different layers and their depths can be calculated.
We believe that a deeper understanding of the seismic process can contribute to improved interpretations. Much information on later seismic arrivals is now attainable by use of the engineering seismographs which display the complete seismic waveform. The interpreter will be unable to understand these arrivals without knowing something about possible seismic wave types, seismic wave parts and expected travel-time patterns. Seismic images have become more accurate with the development of more sophisticated velocity models, which contain information about the speed with which the seismic waves travel through the rock layers. This information is critical for unravelling the geologic secrets hidden below [1].
In the last decade for instance, research studies on soil (sand and fines) characterizations. The role of fines in liquefaction mechanism is not fully understood yet [2]. These fines may affect the compression characteristics of coarse grained soils as well. In some models proposed for compression behaviour of cohesionless soils such as those by [3]; effects of initial void ratio, relative density, particle shape, mineralogy, structure and applied stress conditions were mentioned. These factors were also prominent in the experimental researches related to the compression of sands [4].
Study in basic engineering properties such as the grain size distributions, hardness, strength, durability and shear strength parameters (cohesion, C' and friction angle, φ') is important to understand the behaviour for older alluvium and avoid the inherence problems [5]. Many previous researchers [6,7] studied the changes of engineering properties for igneous and sedimentary rocks but very minimal works has been carried out for older alluvium.
The main objective of this study is to determine the correlation in between seismic velocity values with engineering parameters such as N value, rock quality, friction angle, relative density, strength (force), consistency and velocity index. Beside than that, the correlation found also extent for good estimation which is important in engineering perspective especially for tropical region country.
2. Geography and Geology of Study Area
Our field investigation areas are located at south of Penang Island and Sarawak Malaysia. The major portion of Penang Island is underlain by igneous rocks (Figure 1). All igneous rocks are granites in terms of Streckeisen classification [8]. These granites can be classified on the basis of proportions of alkali feldspar to total feldspars. On this basis granites of Penang Island are further divided into two main groups: the North Penang Pluton approximately north of latitude 5˚23' and the South Penang Pluton. In the northern part of the island, the alkali feldspars that generally do not exhibit distinct crosshatched twining are orthoclase to intermediate microcline in composition. In the southern region, they generally exhibit well-developed cross-hatched twining and are believed to be microcline. The North Penang Pluton has been divided into Feringgi Granite, Tanjung Bungah Granite and Muka Head micro granite. The South Penang Pluton has been divided into Batu Maung Granite and Sungai Ara Granite [8].
Rock exposures around the Miri Town, Sarawak, and belonging to the Miri Formation (middle Miocene strata); represent the uplifted part of the subsurface sedimentary strata [9]. The Middle Miocene sandstones of the Miri Foundation are located at north-eastern Sarawak, east Malaysia (Figure 2). The Miri Formation comprises sandstone, sand and clays in varying proportions and thickness.

Figure 1. Geological map of first investigation site area (Penang, Malaysia).

Figure 2. Second investigation site area (Sarawak, Malaysia).
3. Materials and Methods Applied
In geosciences field, researchers have been used geophysical methods to study the Earth’s subsurface structure and condition. Recently, determination and monitoring of aquifer formations have been done using geophysical survey of geoelectric soundings [10] and combination of electrical resistivity and engineering soil parameters to study the clayey sand soil’s behaviour [11]. Beside than that, other researchers have used the combination of Self Potential (SP), Electromagnetic (EM) and Resistivity profiling methods in the delineation of conductive zones [12].
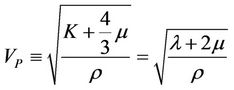
However in engineering seismology, early all work is based upon the P-wave. P-waves are a type of elastic wave, also called seismic waves, that can travel through gases (as sound waves), solids and liquids, including the Earth. P-waves are produced by earthquakes and recorded by seismographs. The name P-wave is often said to stand either for primary wave, as it has the highest velocity and is therefore the first to be recorded; or pressure wave, as it is formed from alternating compressions and rarefactions. In isotropic and homogeneous solids, the mode of propagation of a P-wave is always longitudinal; thus, the particles in the solid have vibrations along or parallel to the travel direction of the wave energy. The velocity of P-waves in a homogeneous isotropic medium is given by Equation (1):
 (1)
(1)
where K is the Hbulk modulusH (the modulus of incompressibility), μ is the Hshear modulusH (modulus of rigidity, sometimes denoted as G and also called the second H Lamé parameter H), ρ is the H density H of the material through which the wave propagates, and λ is the first H Lamé parameter H.
Of these, density shows the least variation, so the velocity is mostly controlled by K and μ. The H elastic modules H H P-wave modulus H, M, is defined so that M = K + 4μ/3 and thereby it rewritten in Equation (2) as
 (2)
(2)
Seismic imaging directs an intense sound source into the ground to evaluate subsurface conditions and to possibly detect high concentrations of contamination. Receivers called geophones, analogous to microphones, pick up “echoes” that come back up through the ground and record the intensity and time of the “echo” on computers. Data processing turns these signals into images of the geologic structure. This technology is similar in principle to active H electromagnetic survey H technology. For this seismic imaging, there are a few equipment is used to obtain the data from the field. The equipments involved in this seismic survey are a battery pack, a roll of trigger cable, two seismic cables, recording equipment (ABEM Terraloc Mark 8), 24 geophones of 14 Hertz, a striker metal plate and a log book. Terraloc Mark 8 is placed at the centre of seismic line and was connected to two seismic cables. 12 pounds hammer is used in this study in purpose of to safe the cost compare to gun. In this seismic survey, there 7 numbers of shot points with total of 168 traces recorded and 5.0 meter geophone interval was selected. This geophysical method will able to give a better analysis of the subsurface especially subsurface structure changes. Seismic refraction velocities in field are being compared with the higher frequency, typically ultrasonic measurements of the laboratory. The purpose is to determine their velocity index.
3.1. Rock-Quality Designation Method
We are also using RQD method from borehole samples. Rock-quality designation (RQD) is a rough measure of the degree of jointing or fracture in a rock mass, measured as a percentage of the drill core in lengths of 10 cm or more Rock quality designation (RQD) has several definitions. It is the borehole core recovery percentage incorporating only pieces of solid core that are longer than 100 mm in length measured along the centreline of the core. In this respect pieces of core that are not hard and sound should not be counted though they are 100 mm in length. RQD was originally introduced for use with core diameters of 54.7 mm (NX-size core). RQD has considerable value in estimating support of rock tunnels. RQD forms a basic element in some of the most used rock mass classification systems: Rock Mass Rating system (RMR) and Q-system.
RQD is defined in Equation (3) as the quotient [13]:
 (3)
(3)
where,
 = Sum of length of core sticks longer than 100 mm measured along the centre of the core.
 = Total length of core run.
3.2. Standard Penetration Test (SPT) Method
Sampling from standard penetration test (SPT) can be either undisturbed, of which in-situ testing is a form, or disturbed. The principal sampling methods used in boreholes are:
SPT test is a dynamic test as described in BS1377 and is a measure of the density of the soil. The test incorporates a small diameter tube with a cutting shoe known as the “split barrel sampler” of about 650 mm length, 50 mm external diameter and 35 mm internal diameter. The sampler is forced into the soil dynamically using blows from a 63.5 kg hammer dropped through 760 mm. The sampler is forced 150 mm into the soil then the number of blows required to lower the sampler each 75 mm up to a depth of 300 mm is recorded. This is known as the “N” value. For coarse gravels the split barrel is replaced by a 60 degree cone.
There are some limitations for these tests. Firstly, it is affected by borehole disturbance, such as piping, base heave and stress relief. Second, it is affected by equipment to make borehole and by operator. Lastly, many corrections are required for interpretation and design. For that reason, in this study we carried out other applicable method to reduce the limitations which could be able to give the subsurface condition and information related to standard penetration test. For our first effort, in this study we try to use seismic refraction method to determine the correlation in between these two methods for environmental engineering applications.
4. Results and Discussion
In this study, we used seismic refraction survey to locate the exact value of seismic velocities which can be correlated with the N values and RQD values from borehole data set. This seismic tomography result is processed using SeisOpt software. Our study not only focussed on correlation between seismic velocity analysis wit rock quality and soil’s N values, however we also extended our study to soil’s friction angle, soil’s relative density and soil’s compression strength. The main purposes we did this entire are to maximize the information of samples collected from the boreholes from both study areas. Perhaps, we able to identified the engineering characterizations of soil and rock samples from the boreholes and tie it with seismic P-wave velocity at the same depth locations.
For correlation between rock quality and seismic velocity analysis, we split the methods used into two parts. The first part is velocity determination from the seismic refraction survey and the second part is laboratory analysis for rock samples to determine their P-wave velocity. From the obtained results, then we found out the correlation for seismic velocity analysis and rock quality. Beside than that, we also study the correlation between seismic P-wave velocity changes due to their penetration strength. The seismic tomography used in this first study is 3 seismic lines which consisted of 4 borehole data sets. The seismic tomography for Line 01, Line 02 and Line 06 together with boreholes location is shown in Figures 3-5 in the next page.
Second site case is medium depth of investigation of the subsurface. The study area is located at Sarawak, Malaysia. The seismic refraction survey was conducted at the study site together with the geotechnical engineering practices in purpose to obtain the engineering parameters same as first site. There are 5 numbers of boreholes located along the seismic refraction survey line. The difference second case compared with the first case is medium depth of investigation (25 m to 40 m from the surface) and recorded N value greater than 50% of the average is counted into our consideration.
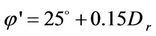
After analysing all the collected soil and rock sample from our borehole, we figure out correlation between their characterizations. Empirical correlation between N value internal friction, φ' and relative density Dr, values of cohesionless soil are available from this study. Table 1 below gives the correlation of N values with the properties of granular soils.
It is found that the mathematical correlations exist between friction angel, φ' and relative density, Dr is found as Equations (4) and (5) below.
 with fines > 5%(4)
 with fines > 5%(5)
N values are also correlated with the unconfined compression strength of cohesive soils as shown in Table 2. However, these correlations are not used in the proportioning of foundations. They can at best use as approxi mate
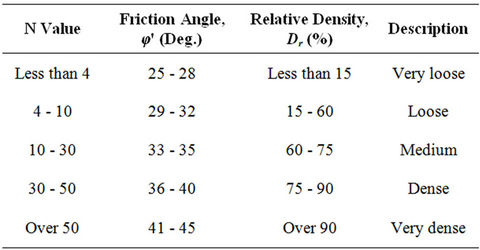
Table 1. Correlations with N values of cohesionless soils.

Figure 3. Line 01 seismic refraction section.
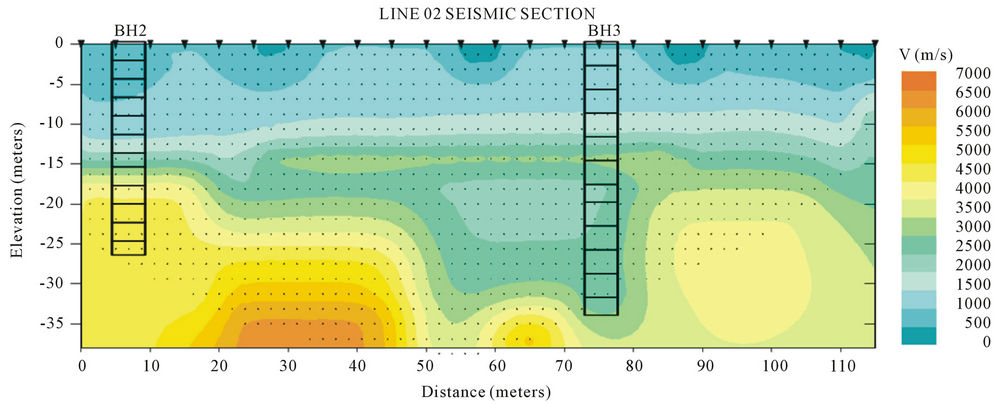
Figure 4. Line 02 seismic refraction section.

Figure 5. Line 06 seismic refraction section.

Table 2. Correlation with N values for cohesive soils.
pointers to the consistency and shear strength of cohesive soils.
RQD value is defined as the percentage of core that has core sticks greater than 10 cm long, for selected structural domains, or for specific length of core. The Table 3 and Figure 6 show the central trend of this relationship, which however shows considerable scatter. It is found that the ratio (VFIELD/VLAB) when squared, was numerically close to the value of RQD (expressed as a ration rather than a percentage. This is applicable for near surface measurements. Equation (6) below was then comparing with previous study such as [14] and the equation found in this study is acceptable for tropical rock. However, the stress face by the rock samples would affect the RQD values and also their velocity values.
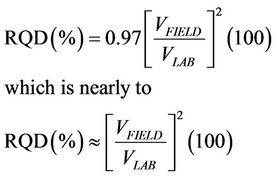 (6)
(6)
where VF is field value of VP and VL is laboratory value of VP.
From our study sites, samples are collected and brought back for the laboratory tests. From the laboratory analysis, the typical values of friction angle, φ' for some granular soils and silts are given in Table 4 below. Meanwhile in Figure 7 shows the location of boreholes at the study site in Sarawak, Malaysia. The correlation between P-wave velocity (infield) with N value and RQD for Sarawak study site also determined in this study site as shown in Table 5.
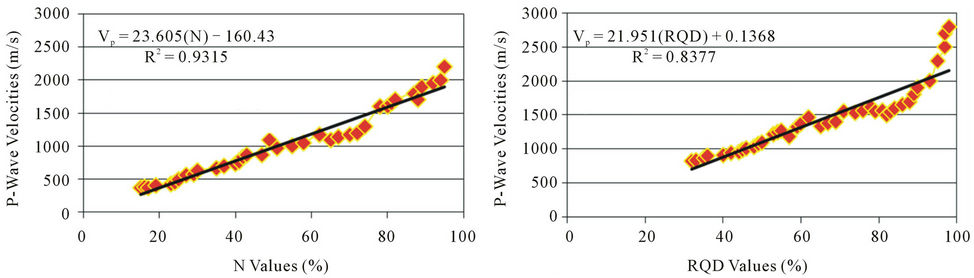
In this study, we also study the empirical correlation between Standard Penetration Test (N values), Rock Quality Designation values and infield seismic P-wave velocity values as shown in Figure 8. We found that the empirical correlation for tropical environmental study is 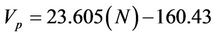 and the regression found is 0.9315 (93.15%). Meanwhile, the empirical correlation between P-wave velocities and RQD values is found as
 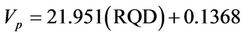 and the regression found is 0.8377 (83.77%).
From both selected study sites (Penang and Sarawak site), we were also determined correlation between apparent P-wave velocities and penetration strength. Penetration strength shows a strong influence on P-wave velocity for tropical granitic rock. Figure 9 shows the empirical correlation between apparent P-wave velocities with penetration strength values for the study site. The corelation found as 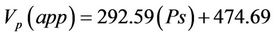 and
and
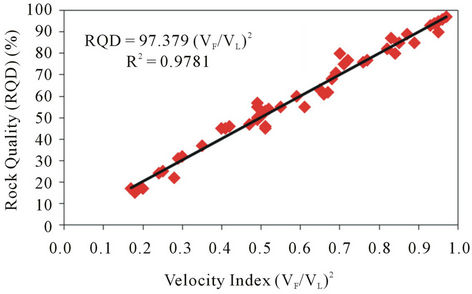
Figure 6. The trend of relationship between rock quality and velocity index.
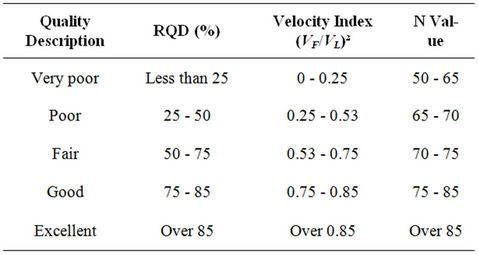
Table 3. Relationship between RQD, velocity index and N value.
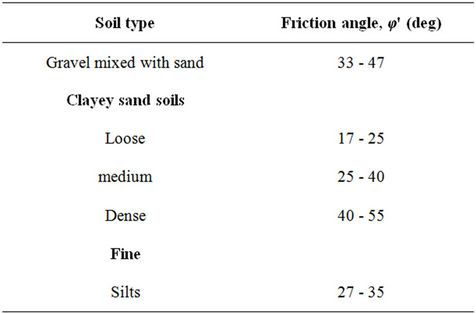
Table 4. Typical values of drained friction angle for mixes soils and silts.
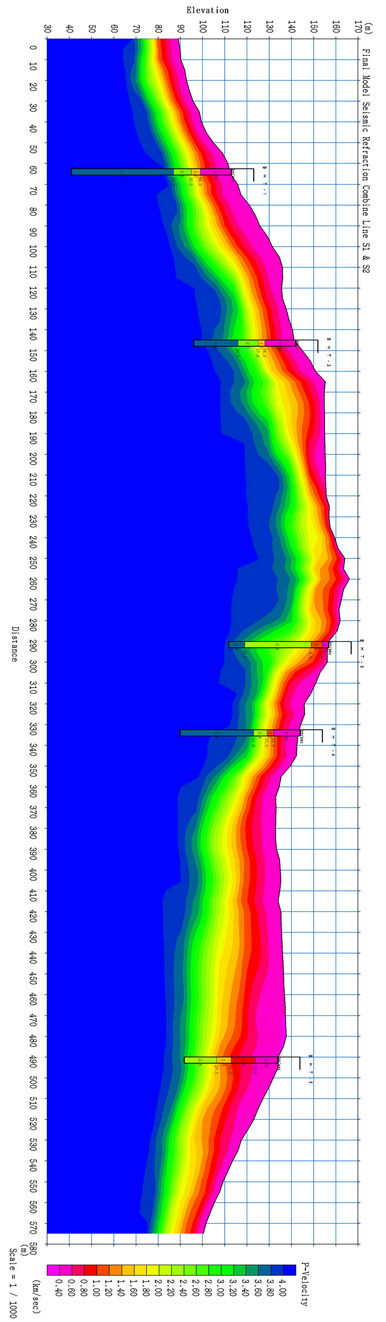
Figure 7. Seismic refraction tomography section at Sarawak, Malaysia (Second site).
 (a) (b)
Figure 8. Empirical correlation of (a) P-wave velocities with N values and (b) P-wave velocities with RQD values for both studied areas.

Table 5. Correlation between P-wave velocity (infield) with N value and RQD for medium depth investigation.

Figure 9. Correlation between apparent P-wave velocities with penetration strength values for tropical granitic rock (average from Penang and Sarawak site).
the regression coefficient is found as 0.9756.
5. Conclusion
From the both selected study sites above, the conclusion can be made based on the results obtain. Firstly the objective of this study is successfully achieved. For many environmental site investigation studies, it has proved to be a very cost-effective method, especially when combined with other geophysical or geotechnical surveys. In our study, the estimation of engineering parameters from P-wave seismic velocity values is applicable for tropical environmental study. The estimation can help in predict the engineering characterizations and seismic P-wave velocity of the subsurface material (soils and rocks). In this study, the selected areas (Penang and Sarawak site) are both have same type of bedrock (Tropical Granitic Bedrock). This study however, can be trying for other areas with different type of weather condition and latitude region. The different weather and latitude also influent the weathering rate of rock. Thus the parameters obtain will influent by the surrounding condition.
6. Acknowledgements
I would like to wish thank Jeff Steven and Eva Diana for giving suggestion for this research. I also wish to thank anonymous reviewers for insightful comments that helped improved the quality of the manuscript.
REFERENCES
- A. A. Bery and R. Saad, “Clayey Sand Soil’s Behaviour Analysis and Imaging Subsurface Structure via Engineering Characterizations and Integrated Geophysicals Tomography Modeling Methods,” International Journal of Geosciences, Vol. 3, No. 1, 2012, pp. 93-104. Hdoi:10.4236/ijg.2012.31011
- S. A. Naeini and M. H. Baziar, “Effect of Fines Content on Steady-State Strength of Mixed and Layered Samples of Sand,” Soil Dynamics and Earthquake Engineering, Vol. 24, No. 3, 2004, pp. 181-187. Hdoi:10.1016/j.soildyn.2003.11.003
- B. O. Hardin, “1-D Strain in Normally Consolidated Cohesionless Soils,” Journal of Geotechnical Engineering Division, Vol. 113, No. 12, 1987, pp. 1449-1467. Hdoi:10.1061/(ASCE)0733-9410(1987)113:12(1449)
- F. A. Chuhan, A. Kjeldstad, K. Bjorlykke and K. Hoeg, “Experimental Compression of Loose Sands: Relevance to Porosity Reduction during Burial in Sedimentary Basins,” Canadian Geotechnical Journal, Vol. 40, 2003, pp. 995-1011. Hdoi:10.1139/t03-050
- F. David, “Essentials of Soil Mechanics and Foundations Basic Geotechnics,” 6th Edition, Pearson Education, Upper Saddle River, 2007.
- B. Vásárhelyi and P. Ván, “Influence of Water Content on the Strength of Rock,” Engineering Geology, Vol. 84, No. 1, 2006, pp. 70-74. Hdoi:10.1016/j.enggeo.2005.11.011
- M. Romana and B. A. Vásárhelyi, “A Discussion on the Decrease of Unconfined Compressive Strength between Saturated and Dry Rock Samples,” Polytechnic University of Valencia, Valencia, 2007.
- W. S. Ong, “The Geology and Engineering Geology of Penang Island,” Geological Survey of Malaysia, 1993.
- H. S. Abieda, Z. Z. T. Harith and A. H. A. Rahman, “Depositional Controls on Petrophysical Properties and Reservoir Characteristics of Middle Miocene Miri Formation Sandstones, Sarawak,” Bulletine of the Geological Society of Malaysia, Vol. 5, 2005, pp. 63-75.
- L. Ouadif, L. Bahi, A. Akhssas, K. Baba and M. Menzhi, “Geophysics Contribution for the Determination of Aquifers with a Case Study,” International Journal of Geosciences, Vol. 3, No. 1, 2012, pp. 117-125. doi:10.4236/ijg.2012.31014
- A. Bery and R. Saad, “Tropical Clayey Sand Soil’s Behaviour Analysis and Its Empirical Correlations via Geophysics Electrical Resistivity Method and Engineering Soil Characterizations,” International Journal of Geosciences, Vol. 3, No. 1, 2012, pp. 111-116. doi:10.4236/ijg.2012.31013
- O. T. Nkereuwem, S. N. Yusuf and M. U. Mijinyawa, “An Integration of Self Potential, Electromagnetic and Resistivity Profiling Methods in the Search for Sulfide Deposits in Gwoza, Borno State, Nigeria,” International Journal of Geosciences, Vol. 3, No. 2, 2012, pp. 365-372. doi:10.4236/ijg.2012.32040
- D. U. Deere and D. W. Deere, “The Rock Quality Designation (RQD) Index in Practice,” In: L. Kirkaldie, Ed., Rock Classification System for Engineering Purposes, ASTM STP 984, American Society for Testing and Materials, Philadelphia, 1988, pp. 91-101. doi:10.1520/STP48465S
- D. U. Deere, A. J. Hendron, F. D. Patton and E. J. Cording, “Design of Surface and Near Surface Construction in Rock. In Failure and Breakage of Rock,” Proceedings of 8th US Symposium Rock Mechanics, Society of Mining Engineers, American Institute of Mining, Metallurgical and Petroleum Engineers (SAUS), New York, 1967, pp. 237-302.