Food and Nutrition Sciences
Vol. 4 No. 11 (2013) , Article ID: 37651 , 12 pages DOI:10.4236/fns.2013.411149
Acidity/Rancidity Levels, Chemical Studies, Bacterial Count/Flora of Fermented and Unfermented Silver Catfish (Chrysichthys nigrodigitatus)
![]()
Department of Aquaculture and Fisheries Management, Faculty of Agriculture and Forestry, University of Ibadan, Ibadan, Nigeria.
Email: segunoyelese@yahoo.co.uk
Copyright © 2013 O. A. Oyelese et al. This is an open access article distributed under the Creative Commons Attribution License, which permits unrestricted use, distribution, and reproduction in any medium, provided the original work is properly cited.
Received July 13th, 2013; revised August 13th, 2013; accepted August 20th, 2013
Keywords: Acidity; Bacteria; Fermented; Unfermented; Rancidity
ABSTRACT
The keeping quality and shelf life of fermented and unfermented Chrysichthys nigrodigitatus were monitored in this study. Four kilograms of fresh Chrysichthys nigrodigitatus was minced into fine particles (with an initial pH of 7.2 before distribution into 8 samples). Samples 1-4 are unfermented cooked while Samples 5-8 were fermented, not cooked. All the 8 prepared samples barely lasted for two weeks, while samples 1, 3 and 7 lasted for six weeks. Total Volatile Base (TVB) ranged higher (24.12 - 29.43) mg/100gm in Samples 1-4 than (14.23 - 18.09) mg/100gm recorded in Samples 5-8. In Samples 1-4, FFA values were not significantly (P > 0.05) different; also followed a narrow range of (6.14 - 6.45)% while higher range of (6.42 - 12.27)% recorded in samples (5-8). Peroxide values (PV) increased in all the 8 samples in the second, fourth and sixth week, however higher values were recorded in Samples 5-8. Acidity generally increased with length (weeks) of fermentation with a gradual drop in pH from 7.2 (in the fresh fish) to pH 4.5 (sample 7), the worst sample at six weeks. Sample 4 with bacteria load of 5.05 × 10⁵ at second week and sample 7 (8.2 × 10⁵) at sixth week became unfit for consumption having exceeded the 5.0 × 10⁵ ICMSF standard for safe fish product. Five bacteria species (Lactobacillus sp, Proteus spp, Staphylococcus aureus, Staphylococcus epidermis, Bacillus sp) with the exception of Proteus spwere not represented in sample 1 (due to salt content). Strong positive correlation (r = 0.97, P < 0.01) exists between PV and FFA. Acidityof the fermented products increased over the weeks with strong negative correlation (r = −0.121, P < 0.01) exists between pH and FFA. Acidity (i.e drop in PH) with increasing rancidity since (r = −0.313, P < 0.05) exists between PV and pH.
1. Introduction
Fermentation is one method of fish curing in which the development of a distinctive flavor in the final product is the principal objective. Therefore, this product is mainly used as a condiment in the preparation of traditional sources. Fermentation alone as a curing process does not preserve fish because it results in the breakdown of fish muscle. For this reason, fermentation is often combined with salting and/or drying in order to reduce water activity and retard or eliminate the growth of proteolytic and putrefying bacteria.
Fermentation method is an ancient method of processing food products dating back thousands of years. It is a process by which beneficial bacteria (like Lactobacillus) are encouraged to grow and increase the acidity offoodprevent spoilage and food poisoning, bacteria growth, hence preserving it. Fermented fish can be described as any fishery product that has undergone degradation changes through enzymatic or microbiology activities either in the presence or absence of salt [1]. Fermented fish products have for many years been considered a South East Asian product [2].
Fermented fish have for many years been considered as a value added product. However, since the raw fish are sometimes from poor quality or underutilized species which are very cheap, product price are affordable to many low income consumers. Some examples of fermented fish products include shushi of Japan, Patis of Phillipines, nuocmam of Vietnam and Cambodia, nampla of Thailand and Budu of Malaysia [3].
In Africa, the popularity of fermented fish products has been influenced by the fish consumption pattern which has been reported to be relatively higher in the coastal countries due to proximity to fish source than in the hinterland which is far from source of fish, hence less fish supply [4]. Many Africans have a strong preference for fresh fish when it is available. However in the absence of fresh fish, cured fish products such as smoked, salted, sundried and fermented fish are predominant and popular.
Also in Africa, fish preservation is accompanied by partial fermentation within a few days during which flavor can be developed in the fish. [5] noted that in Africa, fermented fish products are used as condiments especially in the rural areas. In some Africa countries such as Ghana, Gambia, Uganda, Sierra Leone, Chad, Cote d’ Ivoure, Mali and Sudan, there has been relative popularity of fermented fish products [1,6-9].
In Nigeria, little has been documented on fermented fish products. However, Azeez, N. I. [10] reported that fermented fish had a ready market in the Lake Chad region of Northern Nigeria. Though fish fermentation is not common and really appreciated in Nigeria, the benefit inherent in the consumption of this product will be enormous, more especially in salvaging the fish farmer and marketers from post-harvest losses.
Fish fermentation in the Southeast Asian sub-region normally lasts for several months (three to nine months) and the fish flesh may liquefy or turn into a paste [2]. No African fermented fishery products are mentioned in the FAO Fisheries Report No. 100 on fermented fish; however, Fessiokh from the Sudan is mentioned as a Mediterranean product. Fermentation is characterized by a strong odour and for this reason, various authors have described the product as “stink” fish. In Africa, fermentation is usually accomplished with salting and drying. Fish in its natural environment has its own microflora in the slime on its body, in its gut and in its gills. These micro-organisms, as well as the enzymes in the tissues of the fish, bring about putrefactive changes in fish when it dies. Micro-organisms require water for growth and metabolism, while growth may be inhibited at a water activity (Aw) below 0.60.
Several studies have been carried out to study the biochemical pathways followed during the degradation process of fish fermentation. [11] reported that the strong odour in spoilt fish may be a reaction between TMAD and lactic acid. Tomiyasu, Y. et al. [12] also incriminated organic acids in deteriorated fish. Pearson, D. [13] identified the following five chemical changes in deteriorating fish:
1) Enzymic degradation of nucleotides and nucleosides in the flesh leading to the formation of inosine, hypoxanthine, ribose etc.
2) Bacterial reduction of trimethylamine oxide (TMAO), a non-volatile and non-odoriferous compound, to volatile trimethylamine (TMA) which has ammonical smell.
3) Formation of dimethylamine (DMA).
4) Breakdown of protein with subsequent formationof ammonia (NH3), indole, hydrogen sulphide.
5) Oxidative rancidity of the fat.
Therefore, the choice of Chrysichthys nigrodigitatus for fermentation in this study is based on the known fact that fatty fishes produce a more acceptable texture and flavor on fermentation. Hence the keeping quality and shelf life of fermented and unfermented Chrysichthys nigrodigitatus is monitored in this study through Acidity (pH levels) and Rancidity (PV) peroxide value levels along with other chemical parameters (TVB, FFA) and bacteria load of sample preparations for this fermentation study.
2. Materials and Methods
2.1. Collection of Samples
Twenty kilograms of live Chrysichthys nigrodigitatus of average weight 500 gm per fish was procured from Asejire Dam stored in plastic coolers containing ice cubes and transported to the Department of Aquaculture and Fisheries Management.
2.2. Preparation of Samples
The fresh fish were gutted and washed thoroughly, 4kg of fresh Chrysichthys nigrodigitatus was minced into fine particles (with an initial pH 7.2 recorded at 0 week before distribution into 8 different samples).
The procedures for fermented and unfermented fish paste preparation used in this study were according to the method of Oyelese and Odubayo [14]. A total of eight samples (four unfermented and four fermented samples) were prepared for fish paste experiment as follows:
1) Unfermented Chrysichthys nigrodigitatus: two kilograms fresh Chrysichthys nigrodigitatus was gutted and washed thoroughly in clean water. The fish was ground into fine paste (with a little quantity of water added) using an electric grinder. The fish was reweighed after grinding, cooked for 30 min, then weighed again after cooking; was shared into 4 equal parts of 0.45 kg each and were treated as follows:
Sample 1: This sample was salted with 45 g (i.e 10% salting) and frozen at −25˚C (freezer temperature) and then covered.
Sample 2: This sample was salted with 45 g salt (i.e 10% salting) but left at room (ambient temperature of 26˚C) on a shelf opened.
Sample 3: This sample was not salted but frozen at −25˚C (freezer temperature) and then covered.
Sample 4: This sample was not salted, but left at room (ambient temperature of 26˚C) on a shelf opened.
2) Fermented Chrysichthys nigrodigitatus: another 2kg of fresh Chrysichthys nigrodigitatus fish was gutted and washed thoroughly in clean water. The fish was ground into fine paste (with a little quantity of water added) using anelectric grinder. The fish was reweighed after grinding but this product was not cooked. It was then divided into four equal parts of 0.45 kg each, the uncooked fish paste was treated as follows:
Sample 5: This sample was salted with 45 g salt (i.e 10% salting) covered and left at room (ambient temperature of 26˚C).
Sample 6: This sample was salted with 45 g salt (i.e 10% salting), opened and left at room (ambient temperature of 26˚C).
Sample 7: This sample was not salted, covered and left at room (ambient temperature of 26˚C).
Sample 8: This sample was salted, opened and left at room (ambient temperature of 26˚C).
The proximate analysis which are the crude protein, moisture content, fat, crude fibre, ash of the initial fresh fish will be carried out and also the bacteria count and an identification will be carried out every two weeks and also the chemical analysis will be done bi-weekly for a six week period in other to determine d shelf life of the 8 sample preparation..
2.3. Chemical Analysis
Free Fatty Acid content (FFA), Peroxide Value (PV) (Rancidity) and Acidity (pH level) of the unfermented and fermented fish were determined using A.O.A.C. [15] method while Total Volatile Base content was determined by volumetric method for the determination of volatile bases in fish as described by Pearson, D [13].
2.3.1. Determination of Free Fatty Acid—Pearsons Method
Mix 25 ml diethyl either with 25 ml alcohol neutralizes with 0.1m alkali. Dissolve 1 - 10 g of the oil or melted fat in the mixture neutral solvent and titrate with aqueous 0.1 m alkali. Dissolve 1 - 10 m NaOH shaking constantly until pink colour is obtained which persists for 15 seconds. The titration should not exceed about 10 ml or there is a danger of 2 phases separating. This can be avoid by using hot neutral alcohol as solvent or alcoholic for titration.
The FFA Figure is usually calculated as oleic acid. 1.00 ml 0.1 N alkali = 0.0282 g Oleic acid i.e AV = 2 × FFA.
2.3.2. Determination of TVB
100 g of flest of fresh fish sample would be weighed and blended with 300 ml of 5% tricholoroacetic acid. The blend will then be centrifuged at 3000 × g for 1 h to obtain clear extract 5 ml of the extract was pipette into the Markhan apparatus and 5 ml of 2 M NaOH added. This would be steam distilled into 15 ml of standard 0.01 M HCl containing 0.1 ml rosolic indicator. After distillation, the excess acid was then titrated in the receiving flask using standard 0.01 M NaOH to a pale pink end point. A procedural blank would be done using 5 ml trichloroacetic acid with no sample and titrated as before. The concentration of TVB (in mg/100g sample) would be computed as follows:
where VB = ml NaOH used for blank titration, W = water content of sample in g/100g, M = molarity of NaOH standard solution and VS + ml NaOH used for sample titration. The water content (W) of the sample was obtained by drying an initial weight of fish sample at 77˚C in an oven to constant weight. This temperature is used to dehydrate the material completely and to limit the vaporization of volatile materials.
2.3.3. pH Determination
PH was measured with a standard pH meter (Hanna Instruments, USA) by dipping the pH probe into each of the sample preparations to measure the pH reading directly every week.
2.3.4. Rancidity (Peroxide Value)—PV Determination
The fish sample was weighed into a clear dry boiling tube and 1.0 g of powdered potassium iodide and 20 ml of solvent mixture (2 volume glacial acetic acid plus 1 volume of chloroform) was added. The tube was placed in boiling water so that the sample boils within 30 seconds and allowed to boil vigorously for not more than 30 seconds. Pour the contents quickly into a flask containing 20 ml of potassium iodide solution (5%), wash out the tube twice with 25 ml of water and titrate with 0.002 M sodium thiosulphate solution using starch as an indicator (1%). A blank should be performed at the same time.

(Peroxide value is in milliequivalent of peroxide per 100 g of sample.)
(A.O.A.C., 1990 Edition 11 and 12, Washington DC.)
2.4. Proximate Composition
Proximate analysis was done on the processed samples of Chrysichthys nigrodigitatus were analyzed chemically according to the official methods of analysis described by the Association of official Analytical Chemist (A.O.A.C) [15] on a dry matter basis to determine a general proximate analysis initially before processing the fish for cold smoking during the experiment. The crude protein content, crude fibre content, moisture content, ash content, fat content and nitrogen free extract are the parameters determined after which the sample was also analyzed at the first day of smoking and subsequently done bi-weekly.
2.4.1. Protein Content
The protein content of the samples was determined. The procedure involves digesting the material with conc. H2SO4 to dehydrate and char the sample (carbonisation) and H2O2 to complete sample decomposition by providing a reducing environment, which helps in converting the nitrogen to ammonium salts. On treatment with a dispersing agent (polyvinyl alcohol (PVA)), the ammonium salt decomposes to liberate ammonia, which in the presence of Nessler’s reagent gives an orange color which is read at 460 nm according to the specification of the Hach procedure manual.
0.25 g sample was weighed into Hach digestion flask and 4ml of conc. Sulphuric acid was added. The sample was transferred to the fume hood and heated for 5 minutes at 440˚C. To the charred sample was added 16 ml of H2O2 to clear off the brown fumes and make the digest colorless. The flask was taken off the heater, allowed to cool and the contents made up to 100 ml mark with demonized water and mixed. To 1 ml of the digest, was added 3 drops of mineral stabilizer and 3 drops of polyvinyl alcohol dispersing agent. It was mixed, made up to 25 ml and 1 ml of Nessler’s reagent was added. The color was read within 5 minutes at 460 nm on the Hach spectrophotometer against deionized water blank. The absorbance gives mg/l apparent Nitrogen. The true Kjeldahl nitrogen is calculated as follows:
where A = mg/l (reading displayed), B = ml or g sample digested and C = ml digest analyzed.
2.4.2. Crude Fat, Automated Method (Soxtec System HT2)
PROCEDURE: Grind and dry the sample properly. Load each thimble with about 2 - 3 g of the sample and plug with cotton wool. Dry the thimbles. Insert the thimbles into the Soxtec. HT. Dry and weigh the extraction cups (with boiling chips). Add 25 - 50 ml of the solvent into each cup. Insert the cup into the Soxtec HT. Extract for 15 mins in boiling position and for 30 - 45 mins in “Rinsing” position. Evaporate the solvent. Release the cups and dry at 100˚C for 30 mins. Cool the cups in a desiccator and weigh.
Weight of the cup with the extracted oil = W3.
Weight of the empty cup = W2
Weight of sample = W1
 .
.
2.4.3. Ash Content Determination
The sample was weighed into a porcelain crucible. This was transferred into the muffle furnace set at 550˚C and left for 4hours. About this time, it had turned white Ash. The crucible and its content were cooled to about 100˚C in air, at room temperature in desiccator and weighed.
The percentage Ash content was calculated from the formula below:

2.4.4. Moisture Content and Dry Matter
The sample was weighed into a previously weighed crucible W0. The crucible plus sample taken was then transferred into the oven set at 100˚C to dry to a constant weight for 24 hours. At the end of 24 hours, the crucible plus sample was removed from the oven and transferred to the desiccator, cooled for 10 minutes and then weighed.
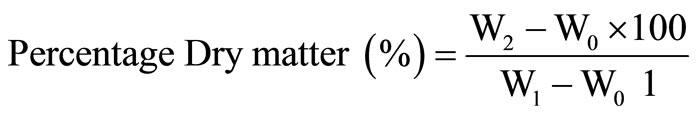
where W0 is weight of empty crucible, W1 is weight of crucible plus sample and W2 is weight of crucible plus oven dried sample.

Or % moisture = 100% Dry matter
2.4.5. Crude Fibre Determination (H2SO4-Method)
PRINCIPLE: The method involves the digestion of the food material in boiled dilute acid to hydrolysed the carbohydrate and protein. This is followed by digestion in dilute alkali to effect saponification of the fat in the food material.
APPARATUS: 600 ml long beaker, Buchner funnel, muffle furnace, crude fiber refluxing apparatus, filter paper, Porcelain crucible.
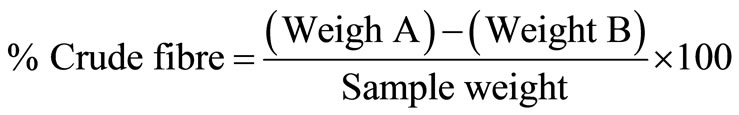
REAGENTS: Weigh 2 g sample into a 600 ml long beaker, Add 200 ml hot 1.25% H2SO4, Place beakers on digestion apparatus with preheated plates. Boil and reflux for 30 minutes, Filter through Whitman GF/A paper by gravity or with the aid of vacuum/air pressure pump. Rinse the beakers with distilled water. Wash the residue on the paper with distilled water until the filtrate is neutral. Transfer the residue from the paper back to the beaker with the aid of hot 1.25% NaOH to 200 ml. Return the beakers to the digestion apparatus, boil and reflux for 30 minutes. Repeat steps 4 and 5. Transfer paper with residue into a crucible. Dry samples at 100˚C overnight. Cool in a desiccator’s and weigh. (Weight A). Put samples in furnance at 600˚C for 6 hours. Cool in a desiccator’s and reweigh (Weight B).
The loss in weight during incineration represents the weight of Crude fibre in the sample.
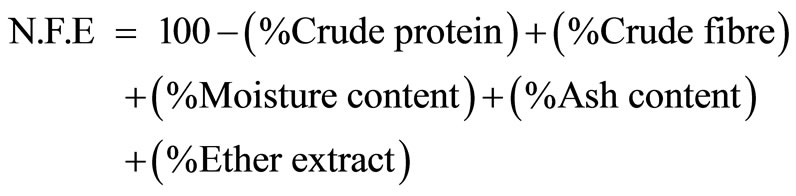
2.4.6. Nitrogen Free Extract (N.F.E) Determination
The nitrogen free extract (N.F.E) calculation was made after the completion of analysis of the Crude Protein, Crude Fibre, Moisture content, Ash content and Ether extract by adding the percentage values in dry basis of these analysis contents and subtracting them from 100% gives N.F.E.
2.5. Microbiological Analysis
1) The standard plate count (SPC) was determined by pour-plating appropriate dilution on stardard count agar (Biokar, France), the plates were incubated at 30˚C for 48 hours.
2) Enterobacteriaceae counts were determined by plating dilutions from 10−1 to 10−6 on Violet Red Bile Glucose Agar. The plates were incubated at 37˚C, for 24 hours.
3) Salmonella were determined on 25 g of the sample added to 125 ml of sterile buttered peptone water and incubated at 35˚C for 18 hours for enrichment in buffered peptone water overnight, tubes of Rappaport-Vassiliadis broth (Oxoid 669) and Selenite-cystein broth (Merck, Germany) were inoculated with 1 ml from culture in buffered peptone water overnight and incubated at 37˚C for 24 hours. The positive tubes of broth media were streaked on Hektoen agar (merck, Germany) and salmonella shigella agar medium, plates were incubated at 37˚C for 24 hours. Noncoloured colonies with and without a dark centre were purified and streaked on trypticase soya agar (Biokar, France) slants and stored at 4˚C.
2.6. Statistical Analysis
Analysis of Variance (ANOVA) in completely randomized design was performed on the data obtained using SPSS (2006). Significant means were compared at 5% probability level using Duncan’s New Multiple Range Test (DMRT) as provided in the same SPSS (2006).
3. Results
Table 1 shows the proximate composition of the fresh Chrysichthys nigrodigitatus used in this study for the fermented and unfermented samples. It shows high Crude protein (55.64%), Crude Fat (5.89%), Crude Fiber (2.40%), Ash (18.75%) and Moisture Content (16.46%).
Table 2 shows the pH of the freshly minced Chrysichthys nigrodigitatus before the above eight sample preparations to be pH 7.2. There was a significant drop in the pH of the fermented fish products ranging from 4.8 - 5.8 (Samples 5-8), while pH of Samples 1-4 ranged from 6.0 - 6.8 at the end of 2 weeks.
Also TVB values were higher ranging from (24.12 - 29.43) mg/100gm fish in samples (1-4) unfermented (as shown in Figure 1-4), compared to (14.23 - 18.09) mg/100gm fish in the fermented product (Samples 5 - 8) also higher rancidity seen as high Peroxide Value (PV) range of (13.29 - 34.28) meq/kg were recorded in the fermented product of Samples 5-8 (as shown in Figures 5-8) compared to a range of (14.23 - 17.12) meq/kg in the unfermented (Samples 1-4) at the end of two weeks.
The free fatty acids values were lower and followed a narrow range of (6.14 - 6.45)% in the unfermented (Samples 1-4) compared to fermented (Samples 5-8) with a higher value and higher range of (6.42 - 12.27)% at the end of two weeks.
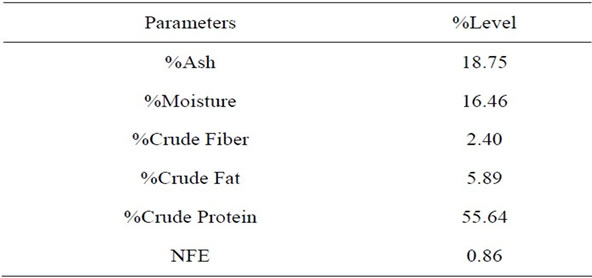
Table 1. Proximate composition of fresh Chrysichthys nigrodigitatus.
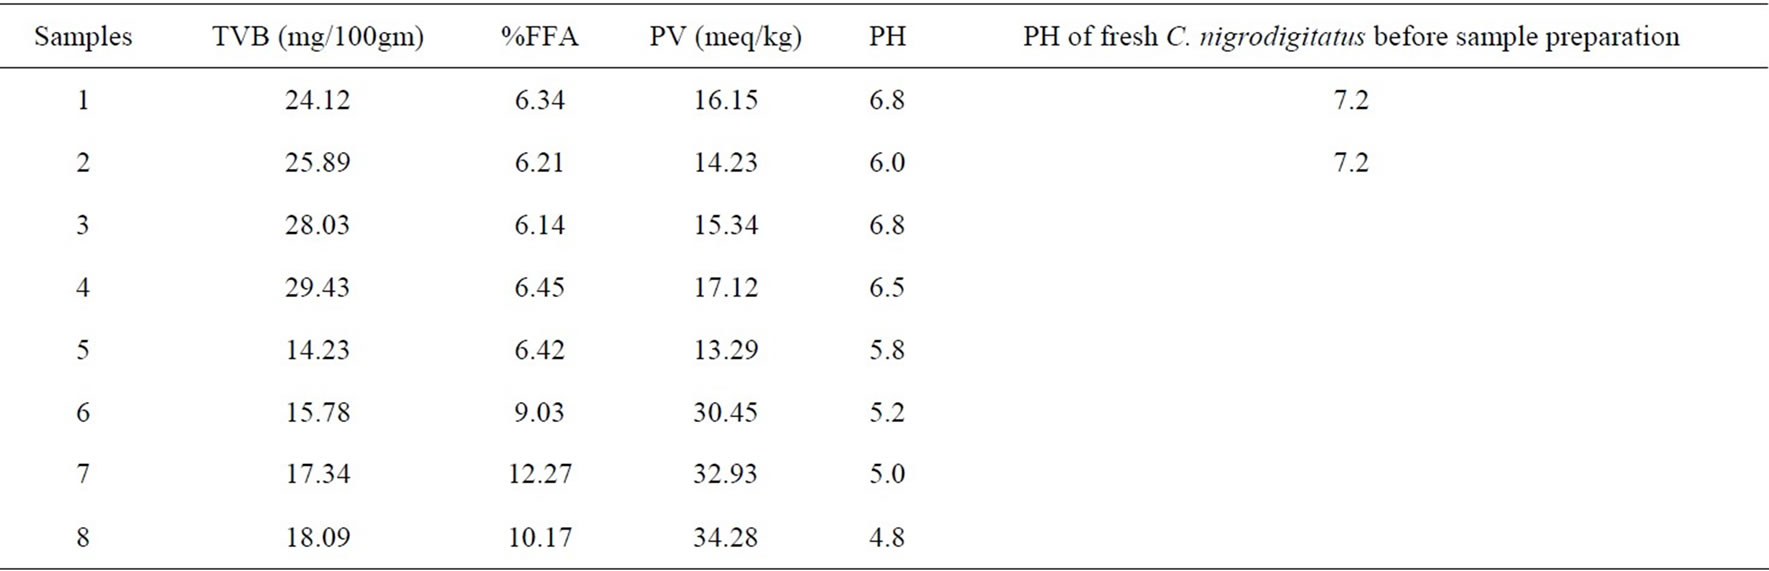
Table 2. Chemical analysis at week two for the eight sample preparations (unfermented (1-4) and fermented (5-8)) of Chrysichthys nigrodigitatus.
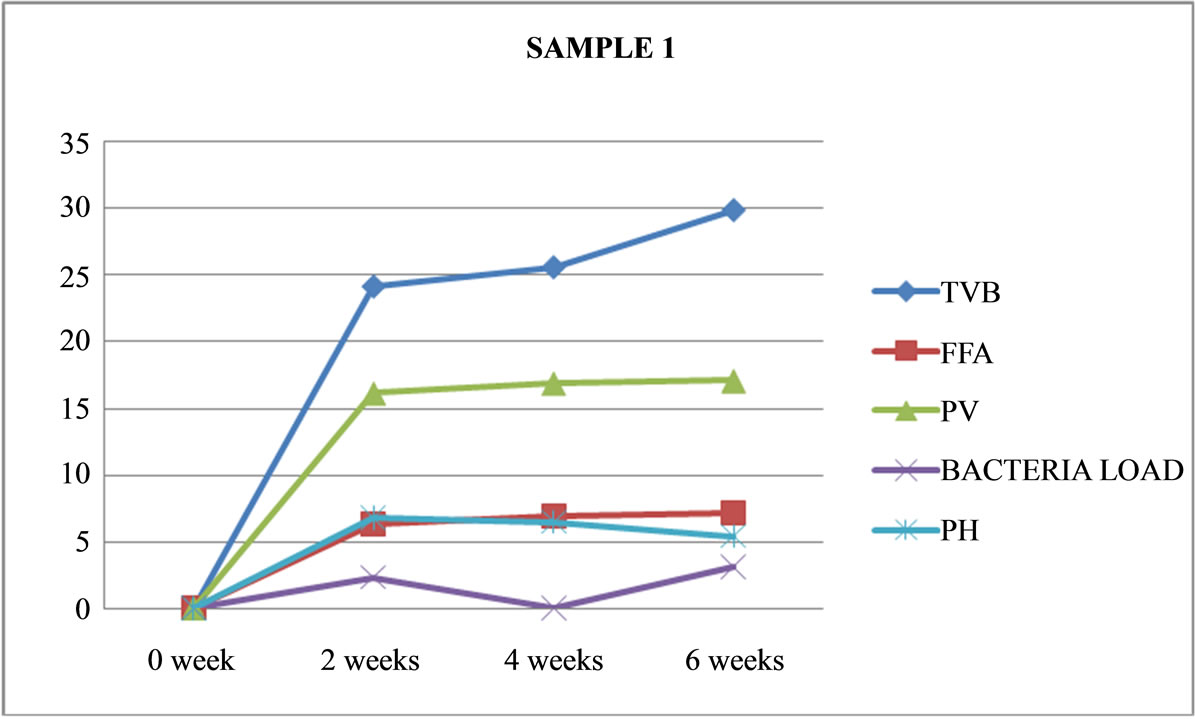
Figure 1. Graphically representation showing bacteria load, ph, pv, ffa and tvb of unfermented Chrysichthys nigrodigitatus for Sample 1.
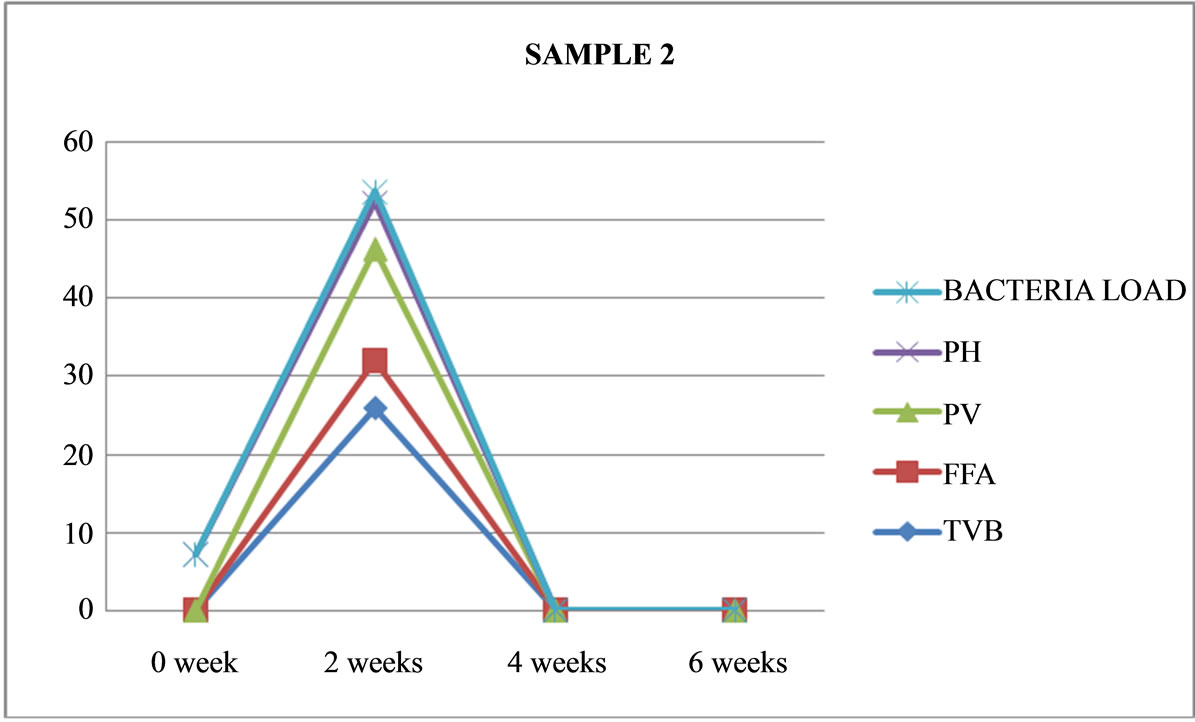
Figure 2. Graphically representation showing bacteria load, ph, pv, ffa and tvb of unfermented Chrysichthys nigrodigitatus for Sample 2.
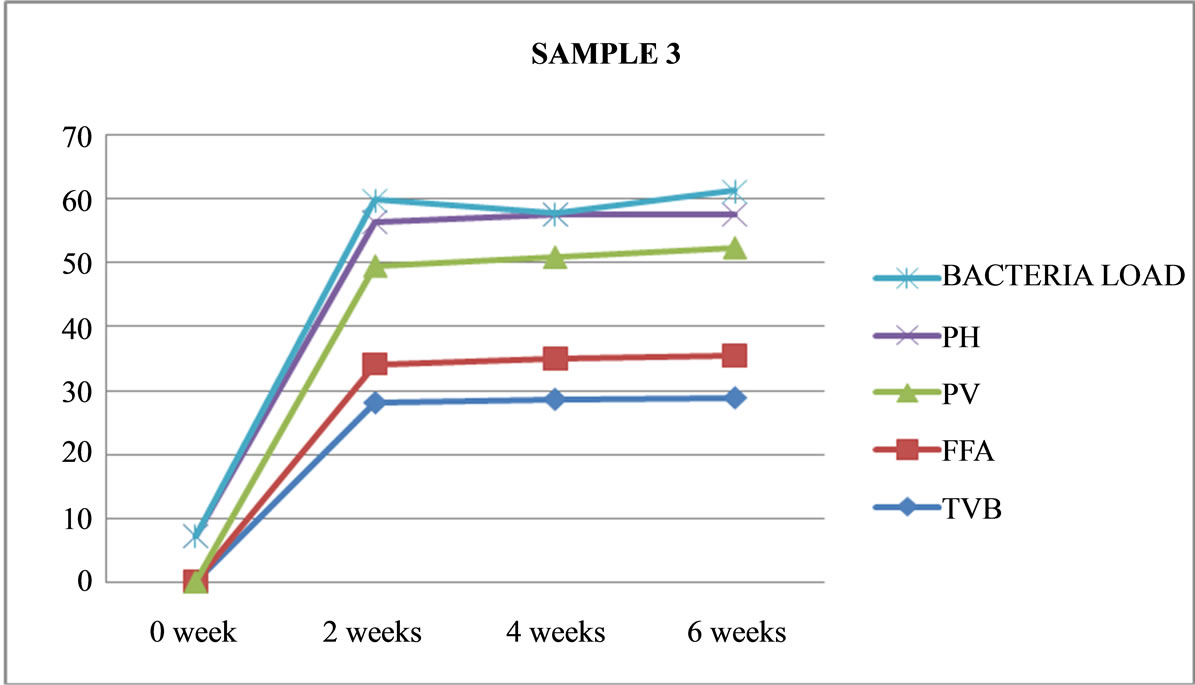
Figure 3. Graphically representation showing bacteria load, ph, pv, ffa and tvb of unfermented Chrysichthys nigrodigitatus for Sample 3.
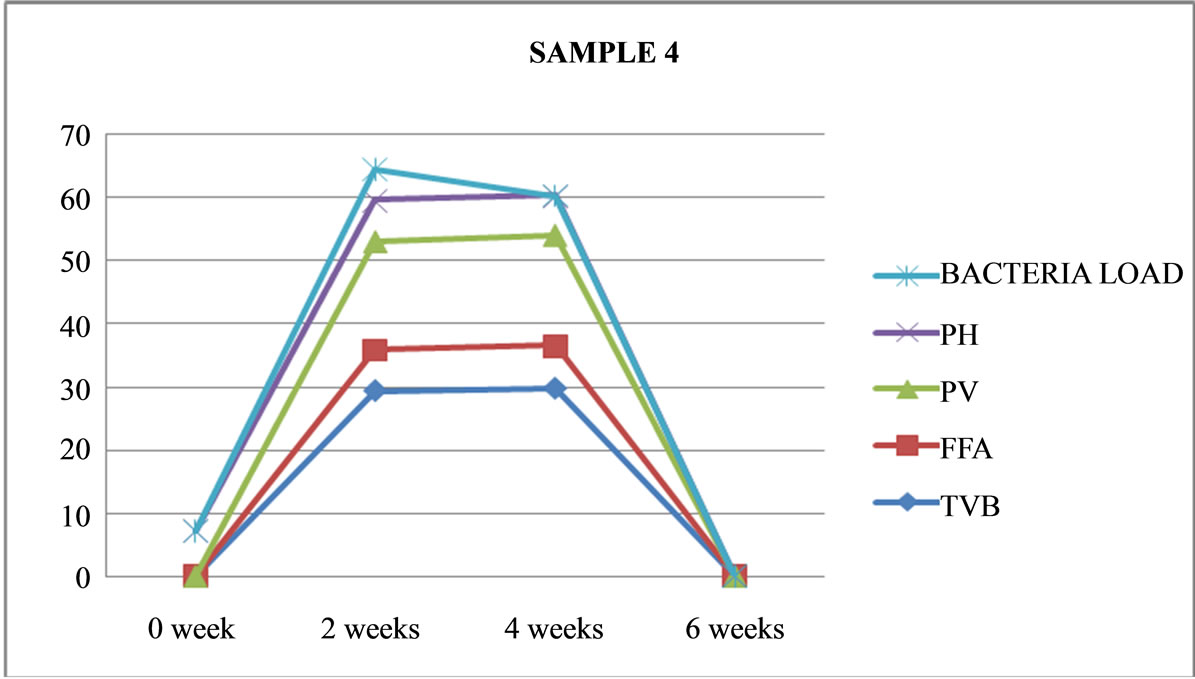
Figure 4. Graphically representation showing bacteria load, ph, pv, ffa and tvb of unfermented Chrysichthys nigrodigitatus for Sample 4.
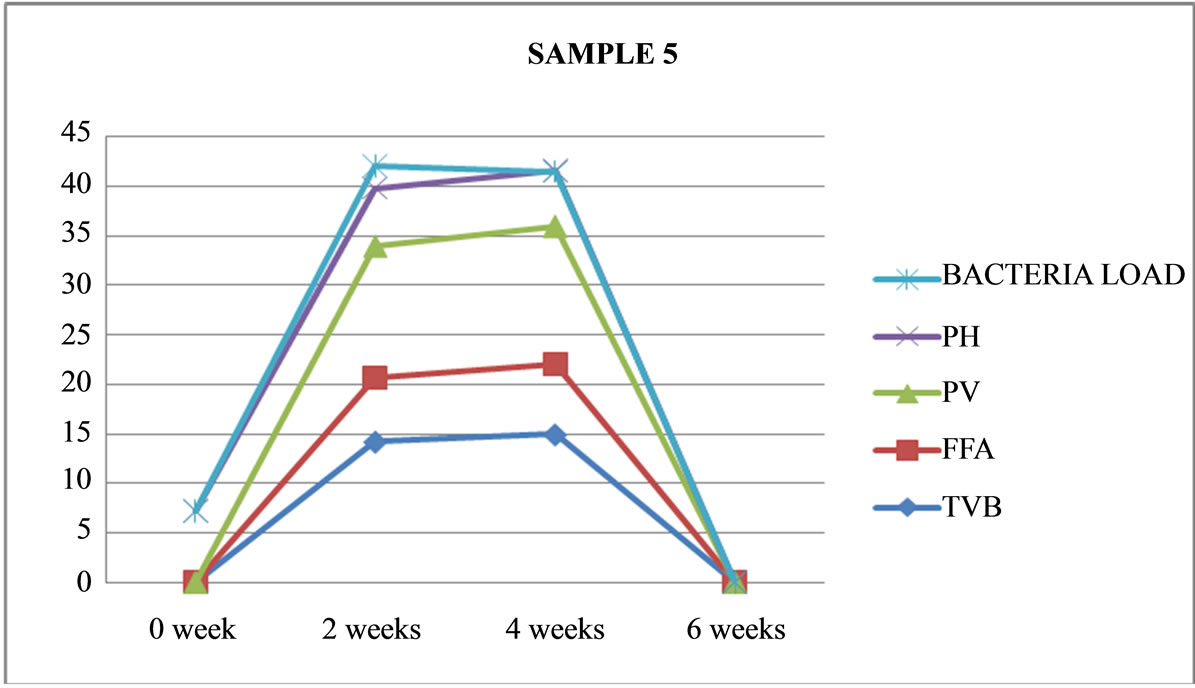
Figure 5. Graphically representation showing bacteria load, ph, pv, ffa and tvb of fermented Chrysichthys nigrodigitatus for Sample 5.
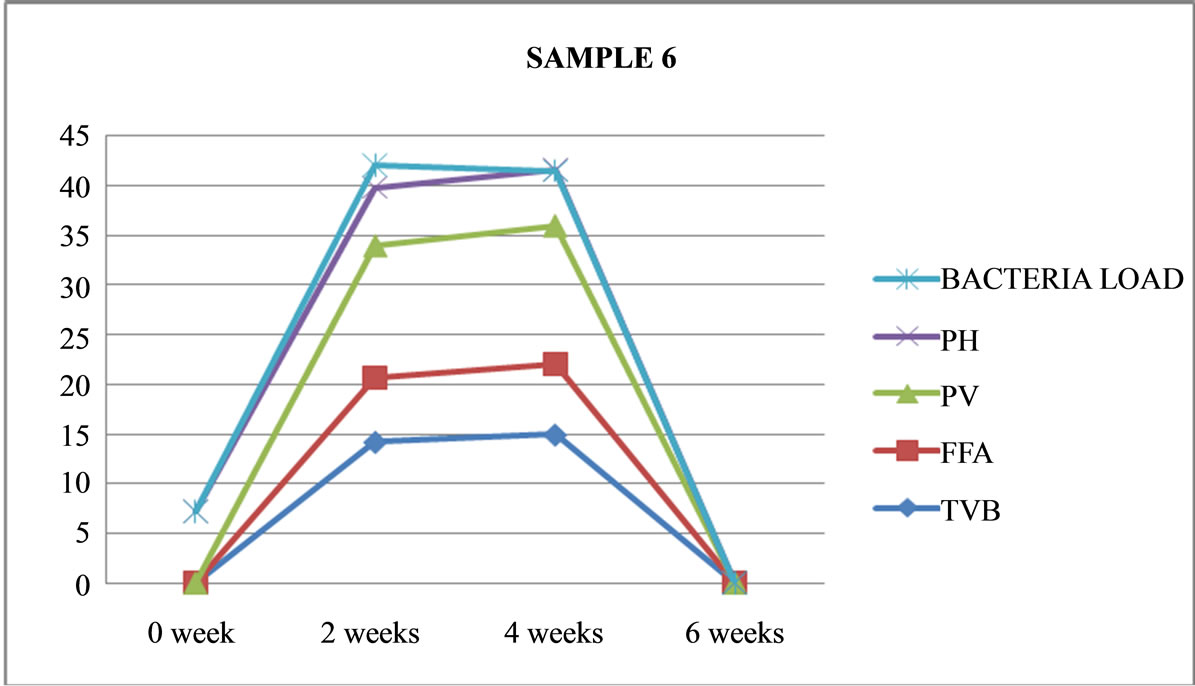
Figure 6. Graphically representation showing bacteria load, ph, pv, ffa and tvb of fermented Chrysichthys nigrodigitatus for Sample 6.
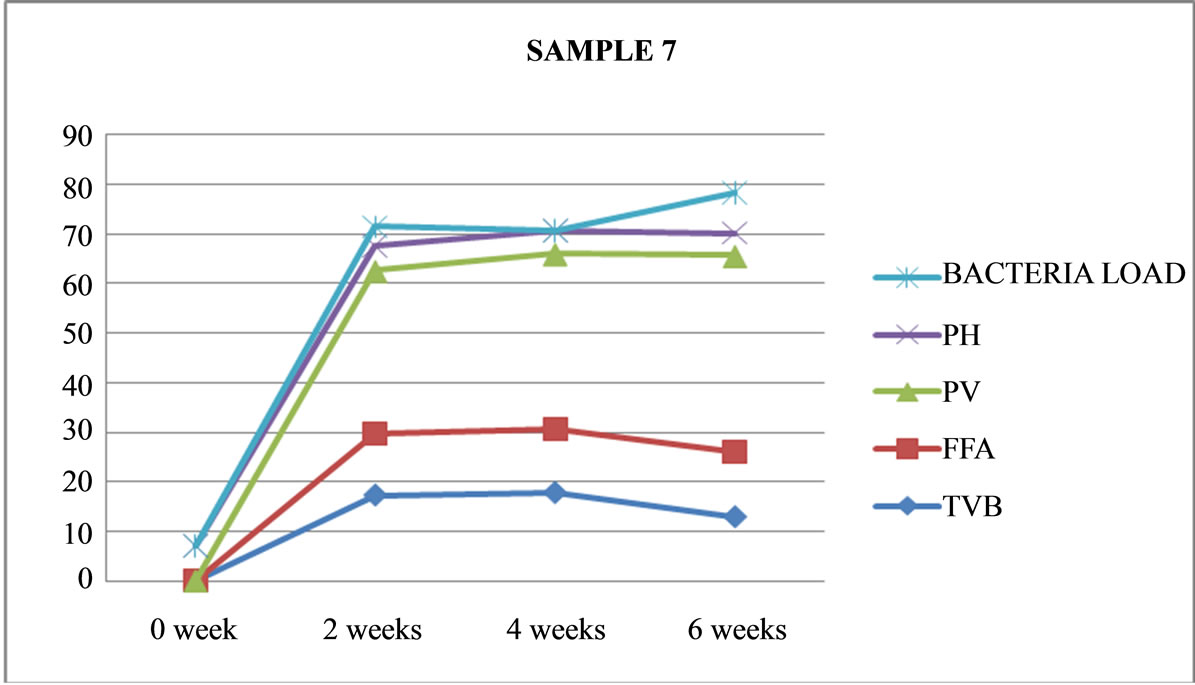
Figure 7. Graphically representation showing bacteria load, ph, pv, ffa and tvb of fermented Chrysichthys nigrodigitatus for Sample 7.
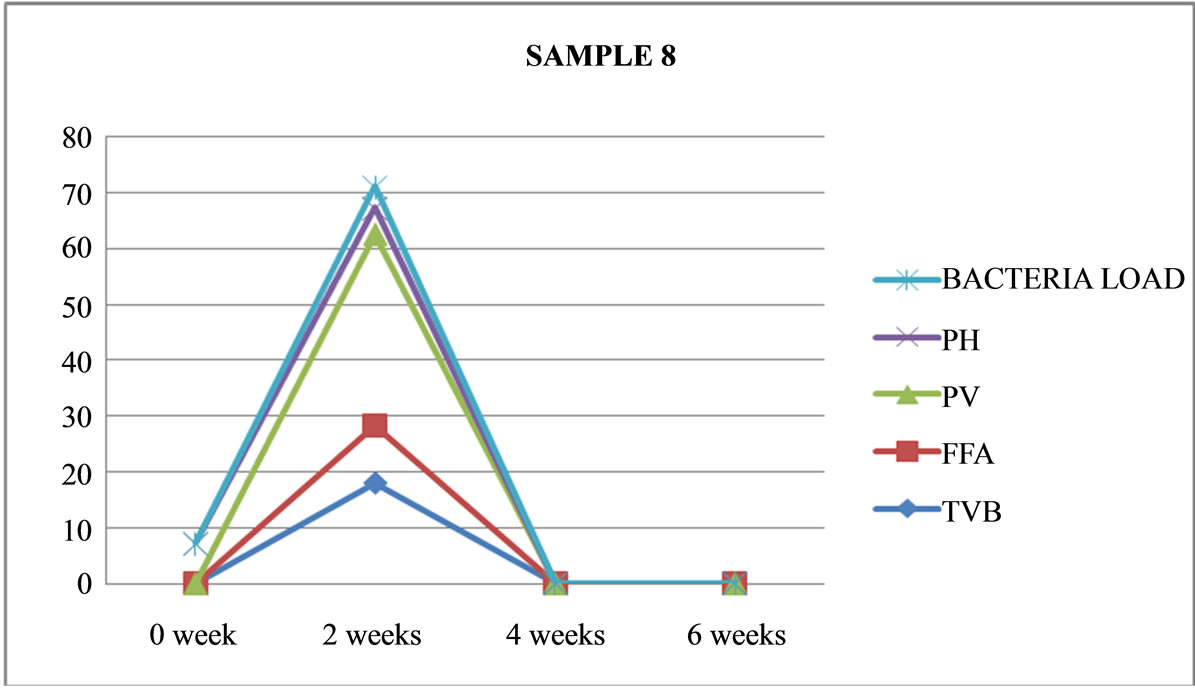
Figure 8. Graphically representation showing bacteria load, ph, pv, ffa and tvb of fermented Chrysichthys nigrodigitatus for Sample 8.
It should be noted that all the eight samples were left for two weeks, although Samples 2 and 8 were spoilt at the end of one week with maggots, offensive odours and colour changes.
Table 3 shows that Sample 2 (unfermented) and Samples 8 (fermented) were terminated at the end of two weeks as a result of spoilage. As shown in Figures 2 and 8.
Sample 2 is unfermented, salted, cooked, opened and maintained under ambient temperature (26˚C), its physical appearance changed to brownish in colour with some maggot growing in it and had a very pungent odour and swelling was noticeable after a week and was terminated at the end of two weeks.
Sample 8 is fermented, not salted, not cooked, opened and left at ambient temperature (26˚C), was totally spoilt and maggot were seen on the product, which has turned nearly to liquid. It was evident that this product was contaminated with flies and was terminated at the end of two weeks.
As shown at the end of four weeks FFA (free fatty acids) increased with length of storage of the products this ranged from (6.45 - 12.73) meq/kg in (Samples 1-7). This also increased with PV, ranging from (15.89 - 35.40) meq/kg and TVB (14.96 - 29.80) mg/100 gm. However with the increase in all the measured chemical parameters a corresponding drop in pH from (6.7 - 4.6) was recorded which implies acidity and rancidity increases with length of storage/spoilage; especially with PV ranges of (15.89 - 35.40) meq/kg compared to a corresponding drop in pH from 6.7 - 4.6.
Table 4 shows that only 3 out of the 8 sample preparations lasted the six weeks experimental period. These are unfermented (Samples 1 and 3) and only one fermented (Sample 7). As shown in Figures 1, 3 and 7.
Sample 1 is unfermented, cooked, salted and maintained at freezer temperature of −25˚C, had no physical change in appearance, still retained its colour and appearance, no pungent odour and was terminated at the end of six weeks (no maggot found).
Sample 3 is unfermented, cooked, covered, not salted and maintained at freezer temperature of −25˚C, had no physical change in appearance, no strong odour and still maintained its sea weedy odour, with no colour change, was terminated at the end of six weeks (no maggot found).
Sample 7 is fermented, not cooked, not salted, covered and left under room (ambient) temperature had more moisture content, no maggot was found. Had a very strong offensive odour black and whitish colourmoulds were visible through the transparent nylon: it was terminated after six weeks. Sample 7 is the most acidic (out of the 8 sample preparations) with a pH of 4.5 and it also had the highest rancidity of 35.66 meq/kg Peroxide Value, and it is also the only fermented fish product that lasted six weeks without maggot seen. While higher TVB values (29.84 and 28.79) lower FFA (7.18 and 6.73)%, lower PV (17.09 and 16.85) and higher pH (5.4 and 5.2) were recorded in samples 1 and 3 compared to sample 7.
Table 5, shows that all the 8 sample preparations (fermented or unfermented) are best consumed within two weeks of preparations; with the exception of sample 4
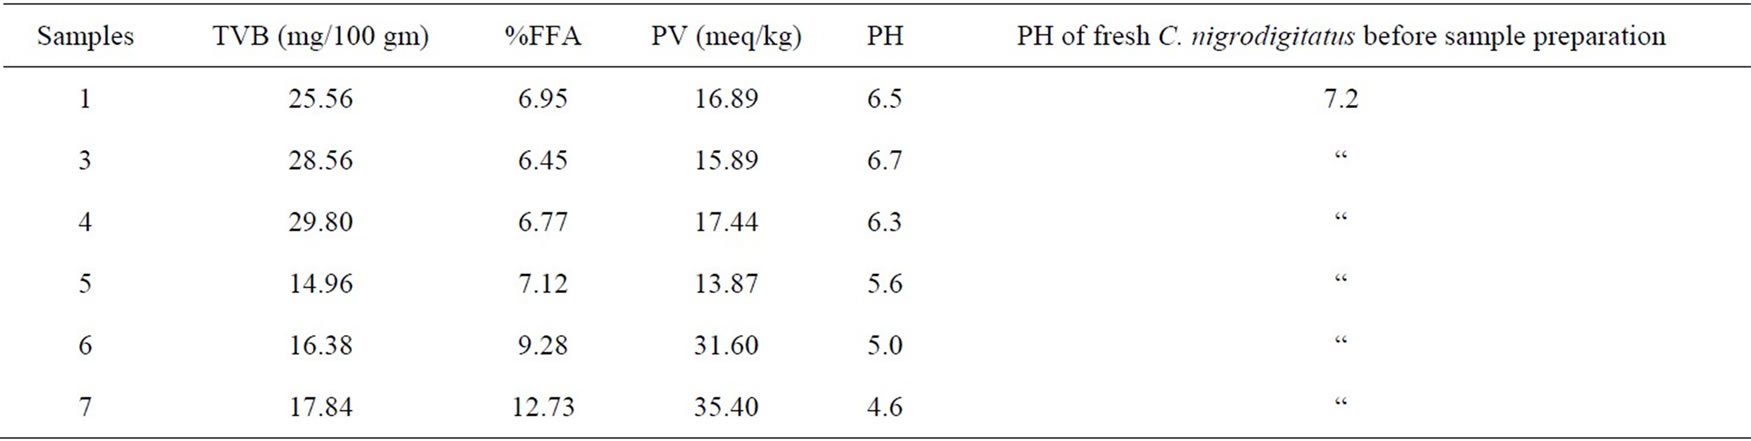
Table 3. Chemical analysis at week four for the six sample preparations remaining (unfermented (1, 3, 4) and fermented (5, 6, 7)) of Chrysichthys nigrodigitatus.
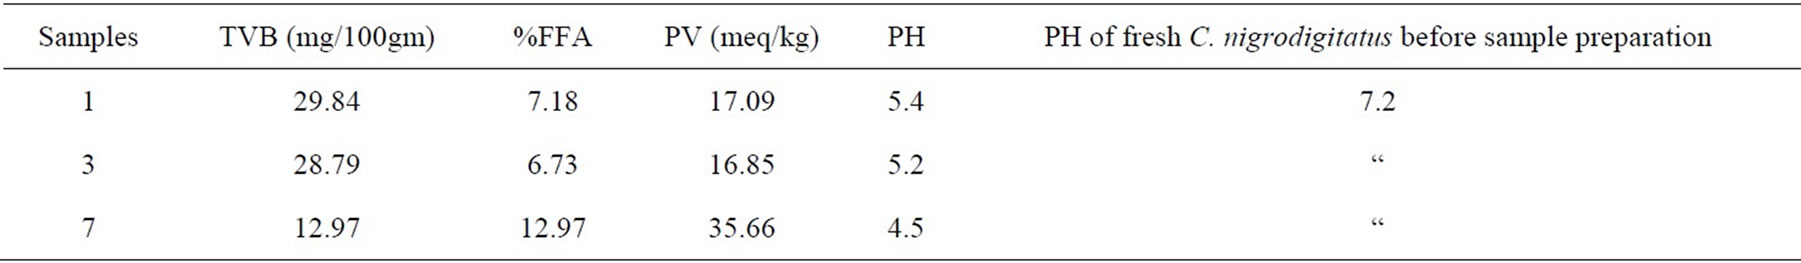
Table 4. Chemical analysis at week six for the three sample preparations remaining (unfermented (1 & 3) and fermented (7)) of Chrysichthys nigrodigitatus.
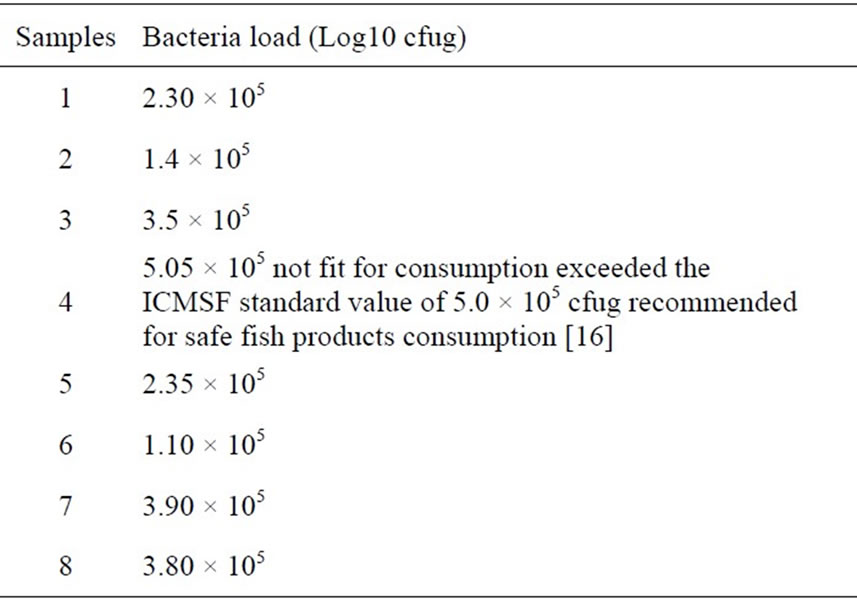
Table 5. Initial bacteria load at 2nd week for the eight sample preparations, unfermented (1-4) and fermented (5-8) of Chrysichthys nigrodigitatus.
(unfermented) which is not fit consumption because of the heavy bacteria load of 5.05 × 10⁵ which exceeded the recommented safe value of 5.05 × 10⁵ for fish product comsumption [16].
Sample 4, is unfermented, cooked, not salted, opened and maintained under ambient (room) temperature, had green mould seen through transparent nylon, state with strong offensive odour emanating. It was terminated after four weeks of preparation.
Table 6 shows that the cooked unfermented Chrysichthys nigrodigitatus minced sample at six weeks, (samples 1 and 3) had the lowest bacteria count of 3.1 × 10⁵ cfug and 3.7 × 10⁵ cfug respectively below the ICMSF standard of 5.0 × 10⁵. Hence may be fit consumption as fish paste, sauces etc. however to avoid food poisoning they are better consumed before two weeks.
Sample 7 which is not cooked, not salted fermented covered at room (ambient) temperature of 26˚C is not fit for consumption at all because of heavy bacteria load of 8.2 × 10⁵ which far exceeded the recommended ICMSF standard of 5.0 × 10⁵ [16]. Although Sample 7 lasted for six weeks, without maggot, with high moisture content, it had a very strong offensive odour, black with whitish mould visible through the transparent nylon.
Table 7 shows that only Proteus sp (−) was not present in samples implicated in Samples 1, 3 and 7 at the end of six weeks. Very few bacteria sp were isolated in this study possibly because of the increasing acidity with length of storage and fermentation. For example in Sample 7, pH (acidity) dropped from 7.2 (in fresh minced Chrysichthys nigrodigitatus to 4.5 at the end of six weeks. Also increasing rancidity (Sample 7) with highest PV (35.66) meq/kg coupled with high acidity of pH (4.5) is likely to be responsible for the low number of bacteria (5 bacteria sp) isolated.
Table 8 shows that pH is (negatively) inversely related to TVB (r = −0.32), FFA (r = −0.12), PV (r = −0.31) and Bacteria Load (r = −0.43). as shown in Table 7 while very few bacteria species (5 bacteria sp) were represented due to the high rancidity (e.g. as in Sample 7 with highest PV (35.66 meq/kg) and low pH (high acidity) of 4.5 had the highest bacteria load of 8.2 × 10⁵ (Table 6).
This high value is possibly due to the incidence of Acidiophillies bacteria; which multiplied rapidly (with increasing length of fermentation) above the ICMSF sage limit of 5.0 × 10⁵. Peroxide Value is strongly positively correlated with FFA (r = 0.97), TVB (r = 0.45) and bacteria load (r = 0.73). Total Volatile Base (TVB) is also positively correlated with FFA (r = 0.51), PV (r = 0.45) and bacteria laod (r = 0.85). Free Fatty Acid also posi-
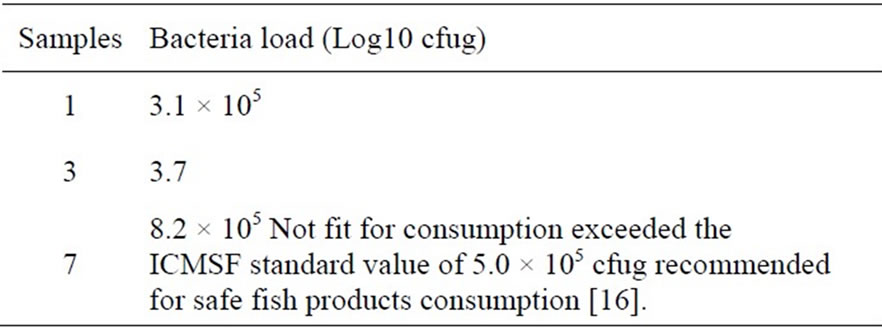
Table 6. Initial bacteria load at 6th week for the eight samples 1, 3 (unfermented) and 7 (fermented) preparations of Chrysichthys nigrodigitatus.
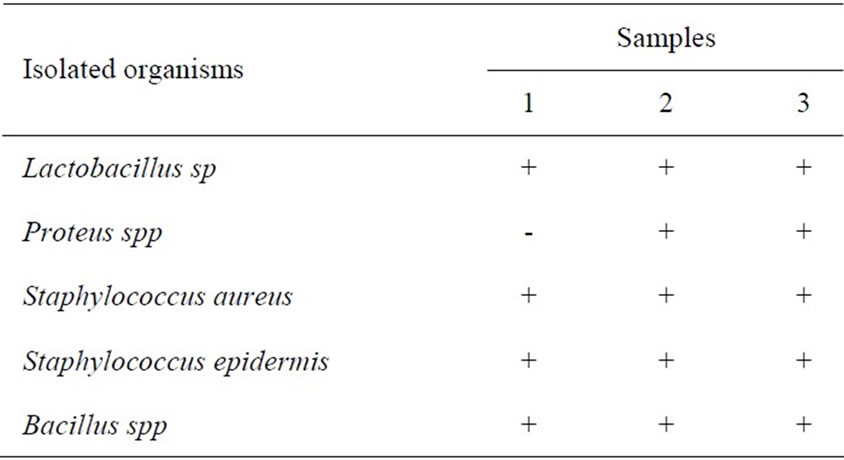
Table 7. Spatial occurrence of bacteria isolates in samples 1, 3 and 7 at the end of week six of Chrysichthys nigrodigitatus.
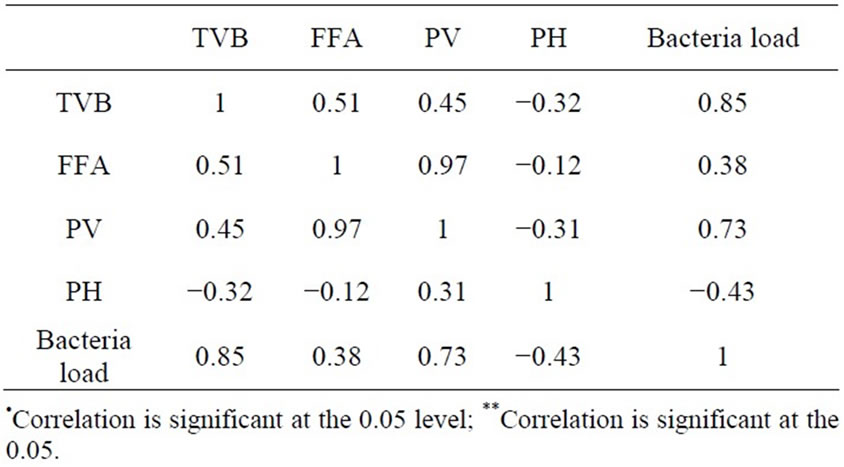
Table 8. Correlation (r) table between tvb, ffa, pv, ph and bacterial load.
tively correlated with TVB (r = 0.51), PV (r = 0.45) and bacteria load (r = 0.85).
4. Discussion
The result of proximate composition (Table 1) shows the silver catfish (Chrysichthys nigrodigitatus) is very high in crude protein (55.64%) and fat (5.89%), while %Ash (18.75%), %Moisture (16.46%), %crude fiber (2.40%) and NFE (0.86%) were also recorded.
The quality characteristics of the 8 samples used for the fermentation processes are as discussed below at the point of termination of the fermented sample products.
Sample 1: is unfermented, cooked, salted, covered and maintained at freezer temperature of −25˚C, had no physical change in appearance, still retained its colour and appearance and was terminated after six weeks.
Sample 2: is unfermented, salted, cooked, opened and maintained under ambient temperature (26˚C). Its physical appearance changed to brownish in colour with some maggot growing in it and had a very strong odour and swelling was noticeable after a week; it was terminated at the end of two weeks.
Sample 3: is unfermented, cooked, covered not salted and maintained at freezer temperature (−25˚C) had no physical change in appearance and still maintained its sea weedy odour. It was terminated after six weeks.
Sample 4: is unfermented, cooked, not salted, opened, maintained under ambient temperature (26˚C), had green mould seen through transparent nylon, stale with strong offensive odour emanating. It was terminated after four weeks.
It should be noted that Samples 1-4 are unfermented cooked, while Samples 1 and 2 are salted, Samples 3 and 4 are not salted, Samples 1 and 3 are covered and frozen at −25˚C. Samples 2 and 4 are maintained at ambient temperature.
Sample 5: is fermented, not cooked, salted, covered, maintained under room temperature (26˚C) (ambient) turned brownish in colour, slimy, swollen with maggot growing on it, was terminated after four weeks.
Sample 6: is fermented, not cooked, salted, opened, maintained at ambient (room) temperature (26˚C), had no maggot, no swelling, but sickly sweet odour was present and was terminated after four weeks Sample 7: is fermented, not cooked, not salted, covered and left under ambient (room) temperature (26˚C), had more moisture content, no maggot was found. It had a very strong offensive odour, black and whitish colourmoulds were visible through the transparent nylon. It was terminated after six weeks.
Sample 8: is fermented not cooked, not salted, opened and left at room temperature (26˚C), was totally spoilt and maggot were seen moving on the products which has turned nearly to liquid. It was evident that this product was contaminated by houseflies, and was terminated at the end of two weeks.
Samples 5-8 were fermented, not cooked; 5 and 6 were salted, Samples 7 and 8 not salted, Samples 5 and 7 covered, while 6 and 8 were opened. All fermented samples (5-8) were left open, not frozen.
The samples under cold storage (Samples 1 and 3) maintained at freezer temperature −25˚C, cooked, salted (Sample 1) and not salted (Sample 3) did not change in physical appearance (both samples lasted six weeks) and still retained its sea weedy odour, remains the best. A peculiar characteristic of fermentation is a strong, sometimes offensive odour.
Since all the 8 prepared samples barely lasted for two weeks without visible signs of spoilage at (least minimal) fermented products are best consumed within one or two weeks. This observation is in line with Watanabe, K. [9] findings that the characteristics smell of fermented fish is the result of enzymatic and microbial activity in the fish muscle. Fermented fish is, therefore, any fishery product which has undergone degradative changes through enzymatic or microbiological activity either in the presence or absence of salt [1].
Total Volatile Base (TVB) were much higher in Samples 1-4 (unfermented) ranging from (24.12 - 29.43) mg/100gm fish, than in Samples 5-8 (fermented) with a range of (14.23 - 18.09) mg/100gm fish. This observation is in line with Hiltz [17] report that the volatile bases particularly TMA, DMA and NH3 are associated with changes in the organoleptic and textural quality of fish.
In samples (1-4) unfermented, cooked FFA values were not significantly (P < 0.05) difference from each other and also followed a narrow range of (6.14 - 6.45)%. Comparatively much higher value and higher range (6.42 - 12.27)% were recorded in samples (5-8) fermented and uncooked. The increasing FFA levels observed in the fermenting 8 samples is as a result of oxidation of poly unsaturated fatty acids (PUFA) contained in the fish tissue to products such as peroxides, aldehydes and ketones and free fatty acids [18].
Also, in line with Horner, W.F.A [18] observations, PV values increased in all the 8 samples in the second, fourth and sixth week (for the 8, 6 and 3 samples) respectively, however higher values 13.29 - 34.28 (second week), 13.87 - 35.40 (fourth week) and 16.85 - 35.66 (sixth week) were recorded in the fermented (Samples 5- 8) uncooked products as shown in Tables 2-4.
Acidity generally increased with length (weeks) of fermentation with a gradual drop in pH from 7.2 in the fresh C. nigrodigitatus to pH 4.5 (Sample 8) at six weeks. This clearly shows that as rancidity increases in the fermented/uncooked and unfermented/cooked samples acidity increases seen as a drop in pH values generally, ranging from pH 7.2 (in the fresh state) and pH 4.5 (in sample 8) the worst sample.
Table 5 shows that at the second week, Sample 4 became unfit for consumption with a bacteria load of 5.05 × 10⁵ and also Sample 7 (Table 6) became unfit for consumption at the end of the sixth week with a bacteria load of 8.2 × 10⁵. This is because these values exceeded the 5.0 recommended standards for safe, edible fish products [16].
Table 7 shows the spatial distribution of bacteria load a total of five bacteria sp (Lactobacillus sp, Proteus spp, Staphylococcus aureus, Staphylococcus epidermic, Bacillus sp) were present in all the 3 samples (1, 3, 7) at the end of six weeks. This fewer species represented in probably due to the increasing acidity of the fermented products. However, Proteus sp is absent (not acid loving) in sample 1.
As shown in Table 8 the strong positive correlation (r = 0.97, P < 0.01) exist between PV and FFA shows that the rate of oxidative rancidity is very high in fermented fish products. Also the strong negative correlation (r = −0.121, P < 0.01) between pH and FFA shows that acidity (seen as drop in pH) of the fermented products increased with increasing oxidative rancidity of the fermented product. This is also confirmed with increasing acidity (drop in pH) (r = −0.313, P < 0.05) between PV and pH.
5. Conclusions
Fermented products are best consumed with in 1 or 2 weeks, since all the 8 samples prepared lasted for barely 2 weeks (in order to prevent food poisoning) before maggot infestation, turning greenish, blackish or brownish before losing their sea weedy odour.
However, samples 4 unfit at two weeks and sample 7 unfit at six weeks because of heavy bacteria load. Acidity (seen as drop in pH) increases with rancidity in fermented products over the weeks. Not all samples lasted six weeks, with the exception of samples 1, 3 and 7.
REFERENCES
- N. Zakhia and J. L. Cuq, “Apercu sur la Qualite du Tilapia Secheetcommercialise au Mali,” Proceedings of the FAO Expert Consultation on Fish Technology in Africa, Accra, 22-25 October 1991.
- H. H. Huss and G. Valdimarson, “Micro-Biology of Salted Fish,” FAO Food Tech News, Vol. 10, No. 1, 1990, p. 190.
- B. Klinic, “Fish Sauce Technology,” EUJ Fish Aquat. Sci, Vol. 20, No. 1-2, 2003, pp. 263-273.
- FAO, “Fermented Fish Products,” Prepared by I. M. Mackie, R. Hardy and G. Hobbs, FAO Fish Rep., Vol. 100, 1971, p. 54.
- K. M. Essuman, “Fermented Fish in Africa. A Study on Processing,” Marketing and Consumption FAO Fisheries Technical Paper No 329, FAO, Rome, 1992, 80 p.
- K. K. Eyeson, “Composition of Foods Commonly Used in Ghana,” Food Research Institute (CSIR), Accra, 1975.
- A. A. Eyo, “Fish Processing Technology in the Tropic National Institute for Freshwater Fisheries Research (NIFFR),” New Bussa, 2001, pp. 10-170.
- J. C. D. Watts, “Some Observations on the Preservation of Fish in Sierra Leone,” Bulletin de MPANTXXVII Sci. of No. 1, 1965.
- K. Watanabe, “Fish Handling and Processing in Tropical Africa,” Proceedings of the FAO Expert Consultation on Fish Technology in Africa, Casablanca, 7-11 June 1982, FAO Fish. Rep, Vol. 268, 1982, pp. 1-5.
- N. I. Azeez, “The Problem of Choice and Safer Methods of Reducing Post Harvest Losses in Lake Chad Processed Fish,” Proceedings of the FAO Expert Consultation on Fish Technology in Africa, Lusaka, 21-25 January 1985, FAO Fish, Rep., Vol. 329, 1986, pp. 340-348.
- G. M. Reay and J. M. Shewan, “The Spoilage of Fish and Its Preservation by Chilling,” Advances in Food Research, Vol. 2, 1949, pp. 343-389. http://dx.doi.org/10.1016/S0065-2628(08)60047-6
- Y. Tomiyasu and W. B. Zenitani, “Spoilage of Fish and Its Preservation by Chemical Agents,” Advances in Food Research, Vol. 7, 1957, pp. 41-82. http://dx.doi.org/10.1016/S0065-2628(08)60246-3
- D. Pearson, “Chemical Analysis of Foods,” 7th Edition, Churchill Livingstone, Edinburg, 1962.
- Oyelese and Odubayo, “Shelf Life of Fish Meal Paste and Cake of Tilapia niloticus and Supplementation of Convertional Fishmeal with Tilapia Fishmeal in the Diet of Clariasgariepinus Fingerlings,” Journal of Food Processing and Preservation, Vol. 34, Suppl. 1, 2010, pp. 149- 163. http://dx.doi.org/10.1111/j.1745-4549.2008.00330.x
- A.O.A.C., “Official Methods of Analysis of AOAC International,” 17th Edition, 1st Revision, Association of Analytical Communities, Gaithersburg, 2002.
- ICMSF, “International Commission on Microbiological Specifications for Foods. Micro-Organisms in Foods 7. Microbiological Testing in Food Safety Management,” Kluwer Academic Plenum Publishers, New York, 2002, p. 199.
- D. F. Hiltz, “Deteriorative Changes during Frozen Storage in Fillets and Minced Flesh of Silver Lake (Mertuucciusbilineans) Processed from Round (Whole) Fish Held in Ice and Refrigerator Sea Water,” Journal of the Fisheries Research Board of Canada, Vol. 33, No. 11, 1976, pp. 2560-2567. http://dx.doi.org/10.1139/f76-300
- W. F. A Horner, “Preservation of Fish by Curing (Drying, Salting and Smoking),” In: G. M Hall, Ed., Fish Processing Technology, 2nd Edition, Chapman and Hall, New York, 1997, pp. 21-39. http://dx.doi.org/10.1007/978-1-4613-1113-3_2