Food and Nutrition Sciences
Vol.4 No.1(2013), Article ID:26755,11 pages DOI:10.4236/fns.2013.41010
Evaluation of Biochemical, Hematological and Histological Parameters in Non Diabetic and Diabetic Wistar Rats Fed with Monosodium Glutamate
![]()
1Department of Food Science, School of Food Engineering, University of Campinas, São Paulo, Brazil; 2Department of Structural and Functional Biology, Institute of Biology, University of Campinas, São Paulo, Brazil; 3Faculty of Pharmaceutical Sciences, University of São Paulo, São Paulo, Brazil.
Email: *reyesfgr@fea.unicamp.br
Received November 24th, 2012; revised December 24th, 2012; accepted January 3rd, 2013
Keywords: MSG; Glutamate; Wistar Rat; Diabetes
ABSTRACT
The parenteral or oral administration of monosodium glutamate (MSG) has been reported to have a deleterious effect on the hypothalamic arcuate nucleus, which changes appetite control. This alteration in function may lead to obesity and disorders related to metabolic syndrome, such as alterations in carbohydrate metabolism (glucose and insulin resistance), dyslipidemia and cardiovascular disease. This study evaluates the induction of metabolic alterations due to subchronic consumption of diets containing MSG at levels of 1.0%, 2.5% and 5.0%. Initially the animals (newborn male Wistar rats) consumed the diets containing MSG for a period of 70 days. At the end of this period diabetes was induced by streptozotocin (STZ) and the rats maintained on the same diets for additional 21 days. The induction of diabetes is based on the susceptibility of diabetic animals to metabolic disorders. Methods capable of evaluating the entire metabolic profile of the diabetic condition were used, including biochemical tests and tests able to detect alterations in the organs usually affected by this disease. It was concluded that the consumption of diets containing up to 5.0% MSG did not change the studied parameters for both: diabetic or non-diabetic animals. The alterations observed in the diabetic animals mainly reflected metabolic changes caused by the disease and were not related to the administration of MSG.
1. Introduction
Monosodium glutamate (MSG) is a sodium salt of the naturally occurring L-glutamic acid used as a flavor enhancer by the food industry, normally in concentrations between 0.1% - 0.8% because MSG stops having a pleasant taste when higher amounts are used. MSG is comercialized in the monohydrate form (C5H8NNaO4·H2O) and at room temperature typically exists as a not hygroscopic white, odorless, crystalline powder that is stable when stored at room temperature for prolonged periods. It is very soluble in water and sparingly soluble in ethanol [1,2].
In its last evaluation JECFA (Joint FAO/WHO Expert Committee on Food Additives) allocated a “not specified” acceptable daily intake (ADI) for this food additive [3]. In 1958, the US Food and Drug Administration (FDA) considered MSG to be an ingredient Generally Recognized as Safe (GRAS) [4] and thereafter, in 1992, in association with the Federation of American Societies for Experimental Biology (FASEB), contracted a group of independent scientists to review the scientific studies related to the safety of MSG. They concluded that there was no scientifically verifiable evidence of adverse effects due to ingestion of MSG as food additive [5].
Further studies showed that the oral [6] administration of MSG promoted increases in glycemia, insulin production and oxidative disorders. Reports by Broberger [7], Hermanussen et al. [8,9], Rol de Lama et al. [10] and Schwartz et al. [11], amongst others, showed that parenteral (4.0 mg/g b.w.) or oral (2.5 and 5.0 g/day) administration of MSG in newborn rats resulted in an injurious effect on the arcuate nucleus of the hypothalamus. This administration of MSG provoked alterations in the control of appetite and, as a consequence, obesity. According to these authors, MSG can cause chronic hyperglutamatemia, which is an increase in the blood glutamate concentration.
He et al. [12] suggested that the ingestion of MSG through diet is an important factor in the increased incidence of obesity in healthy Chinese men and women. In contrast, Shi et al. [13] reported that the MSG intake in a Chinese population from Jiangsu province was not associated with either obesity or clinically significant weight gain.
Thus, the aim of this study was to evaluate, in a subchronical study, the effects of ingestion of MSG through the diet at levels of 1.0%, 2.5% and 5.0% on the biochemical, hematological and histological parameters, on male diabetic and non-diabetic Wistar rats.
2. Material and Methods
2.1. Biological Assay
Healthy male Wistar rats (weighing 40.0 ± 10.0 g, 21 days), reared in the Animal Facility of the University of Campinas (Unicamp), were used in this study. The experimental protocol was approved by the Ethics Committee for Animal Experimentation of the Institute of Biology, IB/Unicamp (Protocol No. 1075-1). During the entire experimental period, the animals were housed under standard conditions of temperature (21˚C ± 2˚C) and humidity (55% ± 10%) with a 12-hour light/dark cycle, and received a specific diet and water ad libitum. Body weight and food consumption were measured daily.
The animals were separated into four groups (n = 12). For a period of 70 days, one group (Control) received the commercial diet (Labina-Purina®, Paulínia, SP, Brazil), and the others received the commercial diet containing 1.0% MSG, 2.5% MSG or 5.0% MSG. At the end of the designated period, diabetes was induced, and the animals were distributed into eight groups (n = 6) and maintained on the same diets for an additional 21 days (Figure 1).
Diabetes was induced by streptozotocin (STZ). For this purpose, a freshly prepared solution of STZ (50 mg/kg b.w.) in 0.1 M citrate buffer, pH 4.5, was injected intraperitoneally into rats that were fasted overnight. After 24 hours, a blood sample was collected in vials from the tail vein of the overnight-fasted rats, and glucose levels were determined using the Accutrend GCT method (Roche Diagnostics®, Bern, Switzerland). Glucose levels were checked regularly to evaluate hyperglycemia, and animals showing marked hyperglycemia (glucose > 200 mg/dl) were selected for the study [14]. Insulin (Novolin
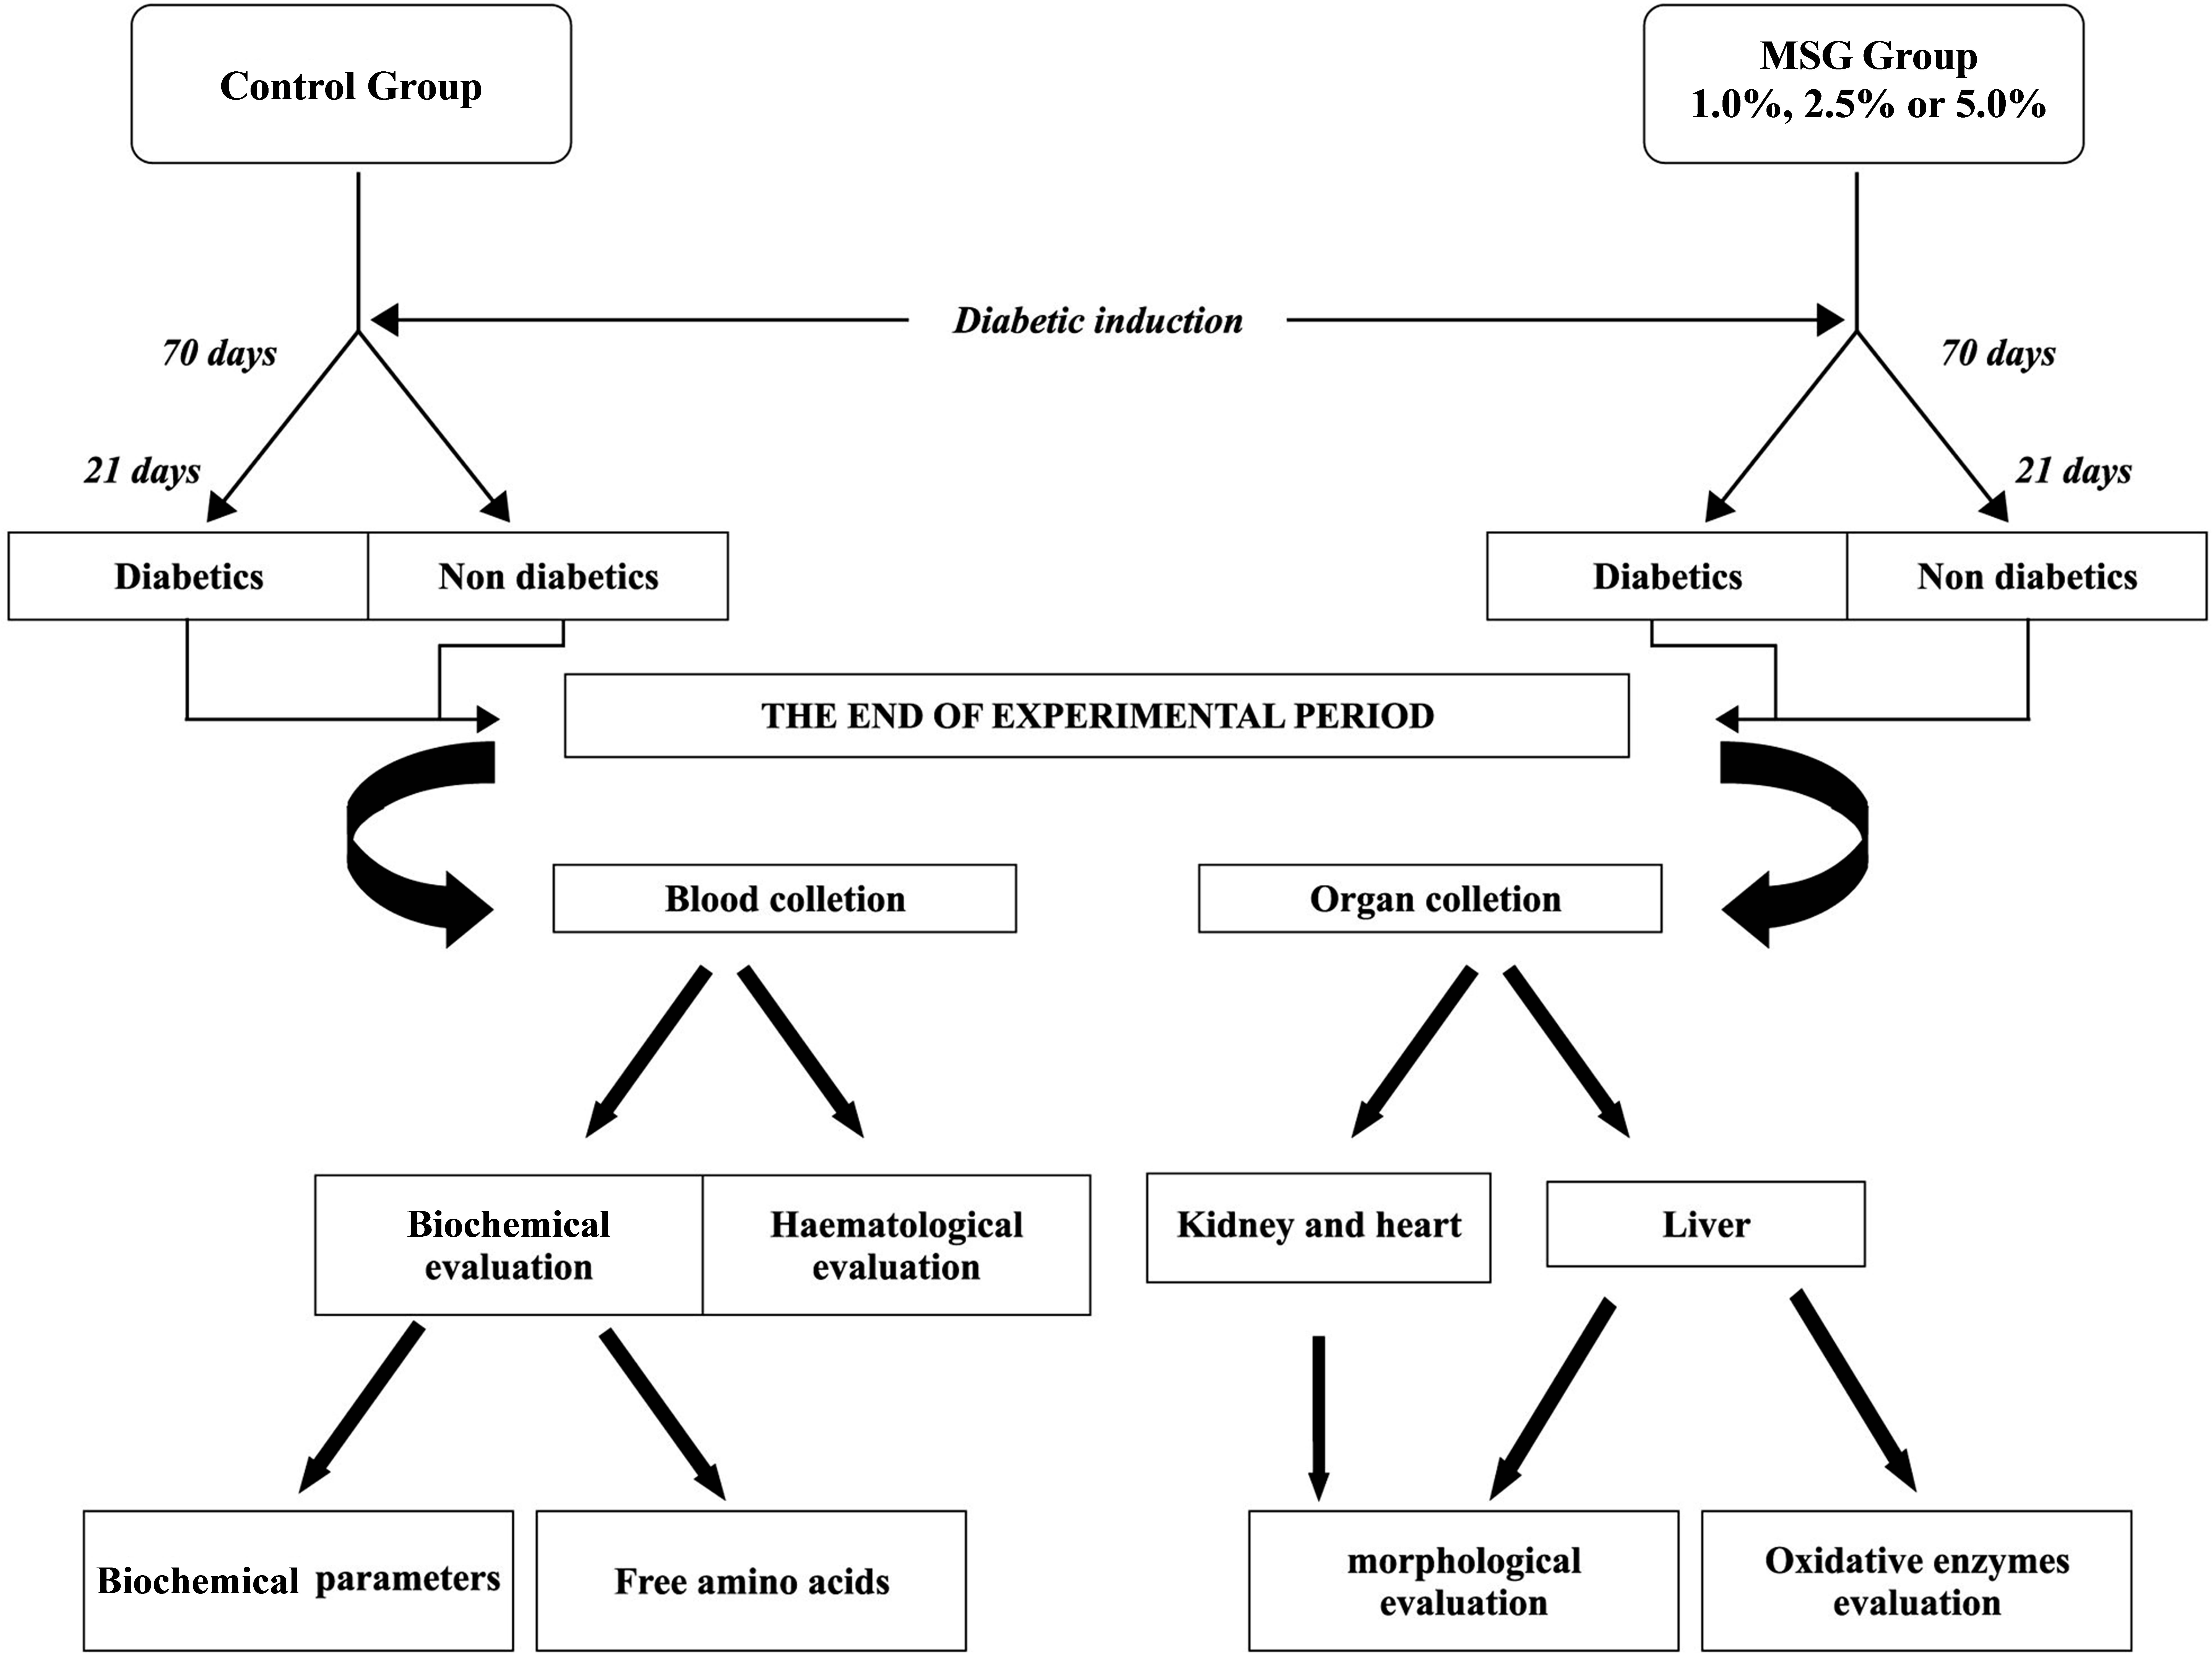
Figure 1. The experimental protocol used in this study.
L, 100 U/mL) was injected intraperitoneally every two days to control hyperglycemia and to prevent animal mortality.
After treatment with STZ, the animals (Groups D and D-MSG) showed higher glucose, ketone body and protein levels in the urine, which corroborated the diabetic condition in both groups (Uriquest, Labtest®).
One day before death, blood for amino acid analysis was collected from the eye vein in the morning after feeding. The blood was collected in 1.0 mL tubes containing the anticoagulant EDTA. At the end of the experimental period, the animals were fasted for 10 hours and sacrificed by exsanguination under anesthesia (sodium pentobarbital, 60 mg/kg b.w.); 5.0 mL of blood was collected in tubes without anticoagulant and centrifuged at 4000× g for 10 minutes at room temperature to obtain serum for the determination of biochemical parameters.
The kidneys and livers were collected for morphological evaluations. Fragments of the organs were removed and stored in formaldehyde solution (37%); the organ fragments were submitted to a routine histological technique using the hematoxylin-eosin method.
2.2. Biochemical Analyses
The following biochemical parameters were evaluated in the blood serum: total proteins and albumin, total cholesterol and its fractions, triacylglycerols and glucose. These parameters were determined using the Modular Analytics System (Roche Diagnostics®, Berna, Switzerland).
2.3. Amino Acid Analysis
The Waters Pico-Tag System was used for the analysis of free amino acids [15,16]. Amino acid concentrations (glutamate, aspartate, arginine, alanine and proline) were measured by reverse-phase high-performance liquid chromatography (Shimadzu, SPD-20A/20AV UV-Vis Detectors; Bomb, LC20 AT; Column heater, CTO20A; Autosampler, SIL10AF). For free amino acids in plasma, 50 µL of internal standard (TL-2-a-aminobutyric acid; Sigma-Aldrich®) was added to 250 µL of plasma. Proteins were precipitated with 200 µL of methanol. The sample was centrifuged at 6000× g for 15 minutes, and the supernatant was transferred to a fresh tube after filtration through a GV with PVDF membrane (Millex, Millipore®; pore 0.22 mm, diameter 13 mm). Phenylisothiocyanate (PITC, Edman’s reagent; Thermo Scientific, Pierce Protein Research Product®) derivatives for reverse phase HPLC were prepared as previously described [17]. Known amino acid standards (Amino Acid Standard H; Thermo Scientific, Pierce Protein Research Product®) were prepared and analyzed in tandem with the serum samples.
2.4. Hematological Evaluation
The following hematological parameters in the blood were estimated using an Animal Blood Counter-ABC vet (Horiba ABX, France): white blood cells, red blood cells, hemoglobin, hematocrit, mean corpuscular volume, mean corpuscular hemoglobin, mean corpuscular hemoglobin concentration, red cell distribution width, platelet count and mean volume, lymphocytes, monocytes and granulocytes.
2.5. Evaluation of Oxidative Enzymes in the Liver
Liver tissue was collected, homogenized in HB buffer (20 mM Tris, 1 mM DTT, 2 mM ATP and 5 mM MgCl2, pH 7.2) and centrifuged at 13,400× g for 15 minutes at 4˚C. These samples were used to determine glutathioneS-transferese, catalase and superoxide dismutase activities, as well as total protein content [18]. Aliquots of the homogenate supernatant were analysed for glutathioneS-transferase (GST) activity based on the conjugation of 1-chloro-2,4-dinitrobenzene (CDNB; Sigma) with glutathione redutase, as described by Schäffer et al. [19]. Catalase activity was determined spectrophotometrically, according to Cohen et al. [20]. Superoxide dismutase (SOD) activity was determined by catalysis of horseradish peroxidase (HRP), using a coupled reaction of N,Ndimethylaniline (DMA) with 4-aminophenazone, after incubation with 400 mMol of riboflavin, and comparing the reading variation at 554 nm, as described by Tang et al. [21].
2.6. Morfological Evalulation
The liver and kidney were dissected. Fractional tissue was fixed in paraformaldehyde and cut into 3-μm thick paraffin sections. These sections were stained in hematoxylin-eosin. Morphological analysis was performed in 8 different lamina per group. Images were analyzed using Image-Pro Plus Software (1.0 version for Windows, Cybernetics, Silver Spring, USA) after capturing the image on a Leica microscope using 40× magnification.
2.7. Statistics
The GraphPad Prism program, version 6.0 (2012), was used for statistical analyses with a random block design according to the animals’ weights. The two-way variance analysis (ANOVA) was used to determine the value for P, and the Turkey test was used to compare the means of significant values with a probability of 5%.
3. Results
Figure 2 summarizes the values for body weight gain and diet consumption obtained for the groups; notably, food intakes were similar across groups. Significant differences among diabetic and non-diabetic groups that ingested MSG were not observed.
No significant difference (p < 0.05) in the plasma free glutamate content was found among the groups (Figure 3). Similar result was found for aspartate, arginine, alanina and proline.
Serum glucose levels were high in the diabetic group compared to levels in the control animals; no significant effects of dietary MSG content were present in either group (Figure 4). The total proteins, albumin, lipid profile for triacylglycerols and total cholesterol and fractions revealed no significant effects related to treatment (control, diabetes) or MSG ingestion, except for the significantly increased amounts of triacylglycerols in the diabetic groups (Figure 5). Table 1 shows the activity of hepatic enzymes that are indicative of oxidative stress. Superoxide dismutase and catalase activity was normal in the non-diabetic groups, but the activity of these enzymes was significantly decreased in the diabetic groups. No significant difference for gluthatione-S-transferese was found among the diabetic and non-diabetic groups.
No alterations in morphology were observed in the livers of the control group animals (Figure 6), but lipid inclusion was observed in the diabetic animals; however, significant differences in lipid inclusions among the groups fed MSG were not observed (Figure 7). No I II
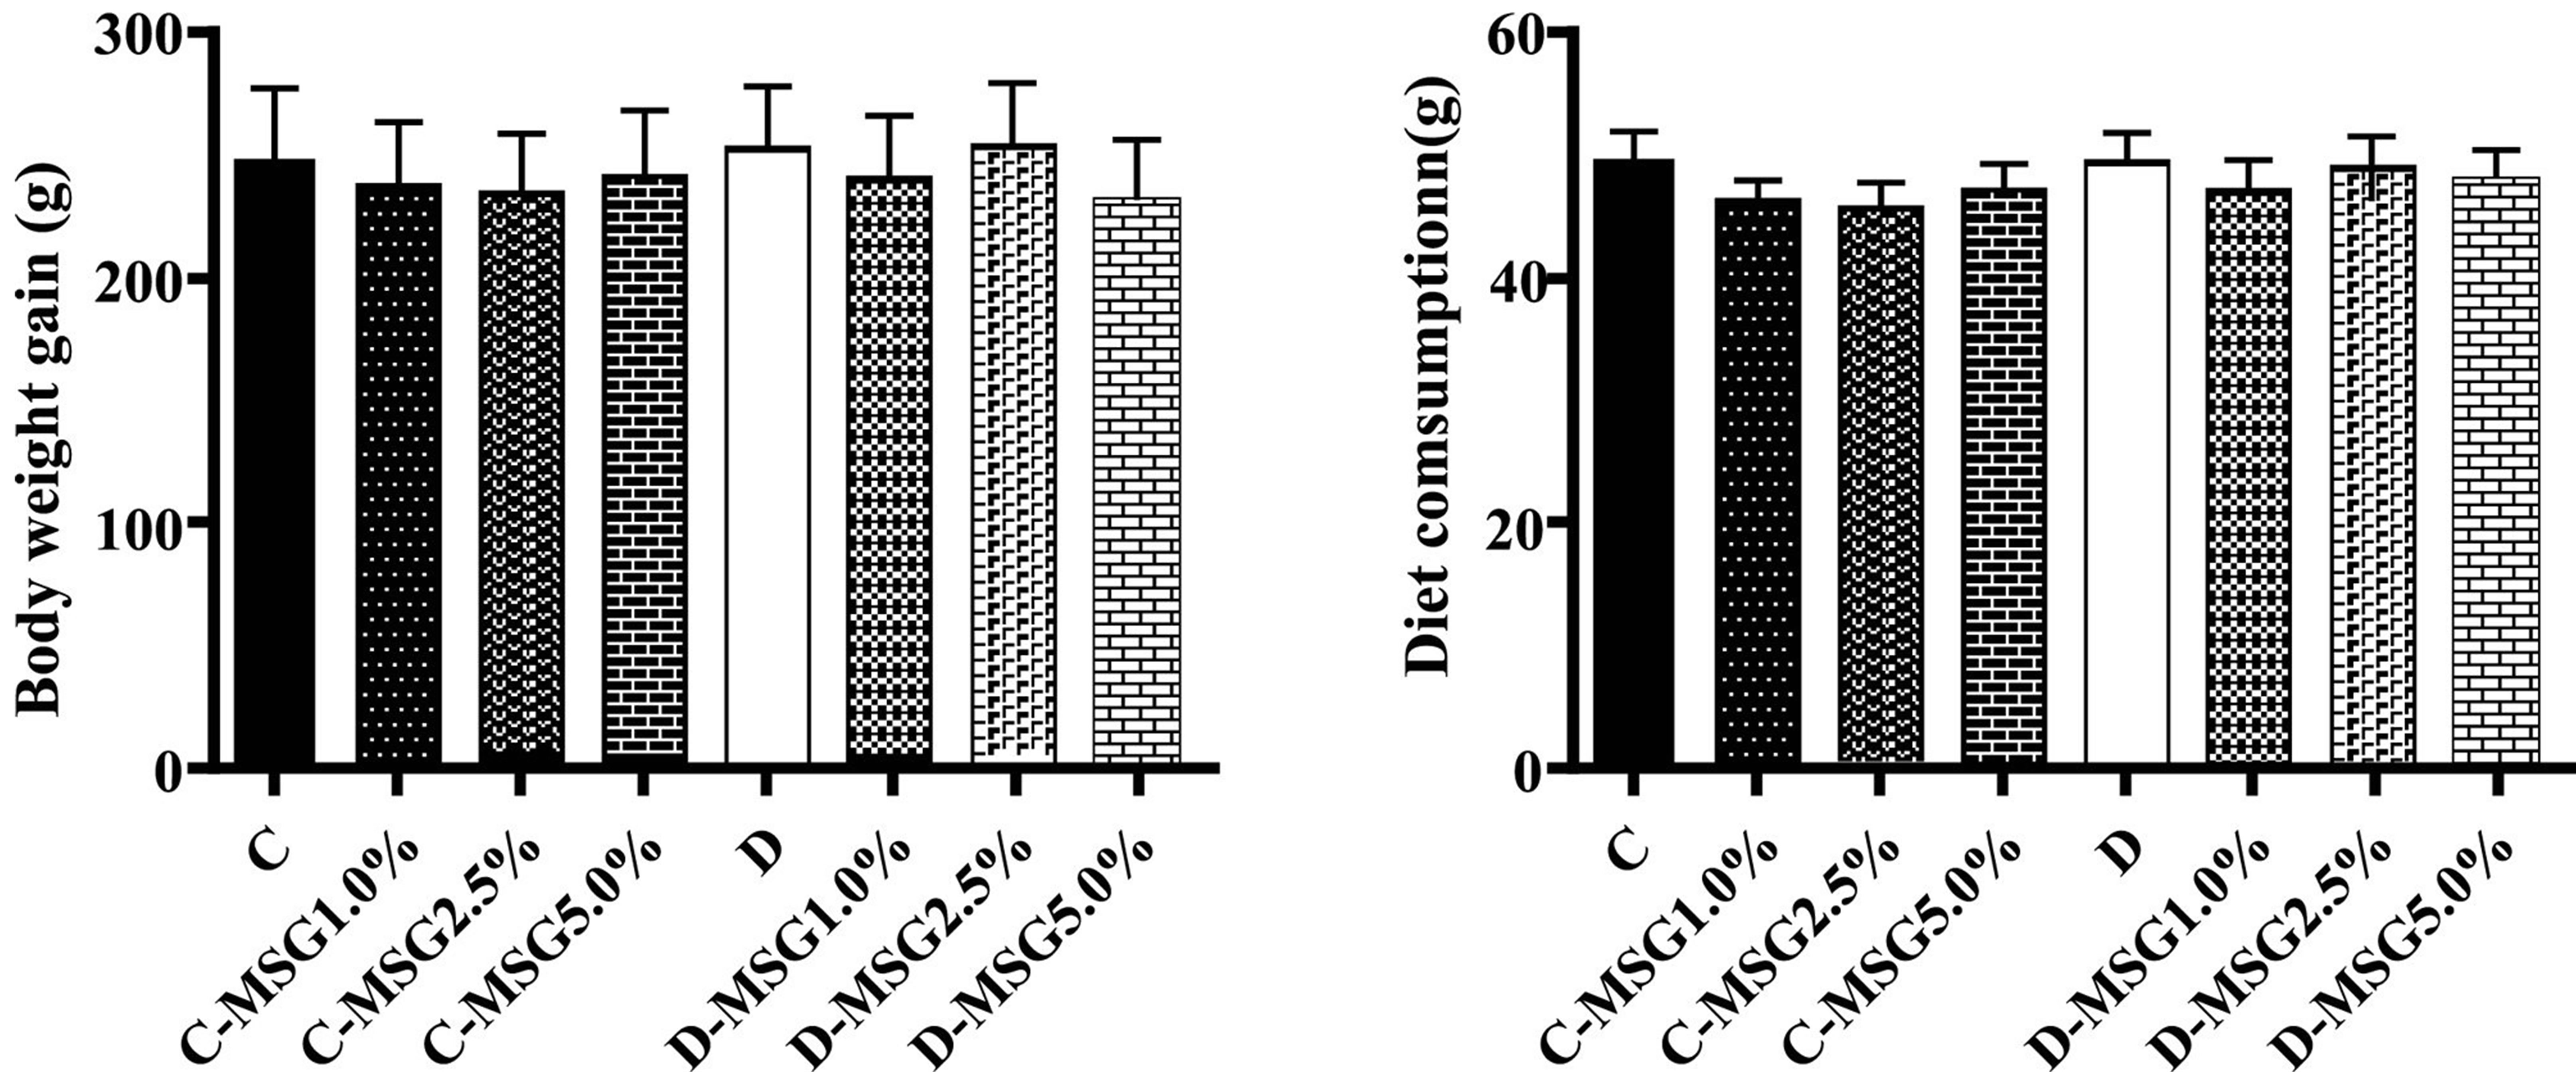
Figure 2. Body weight gain and diet consumption determined in the non-diabetic (C groups) and diabetic (D groups) Wistar rats fed with diets containing added MSG (1.0%, 2.5% or 5.0%).
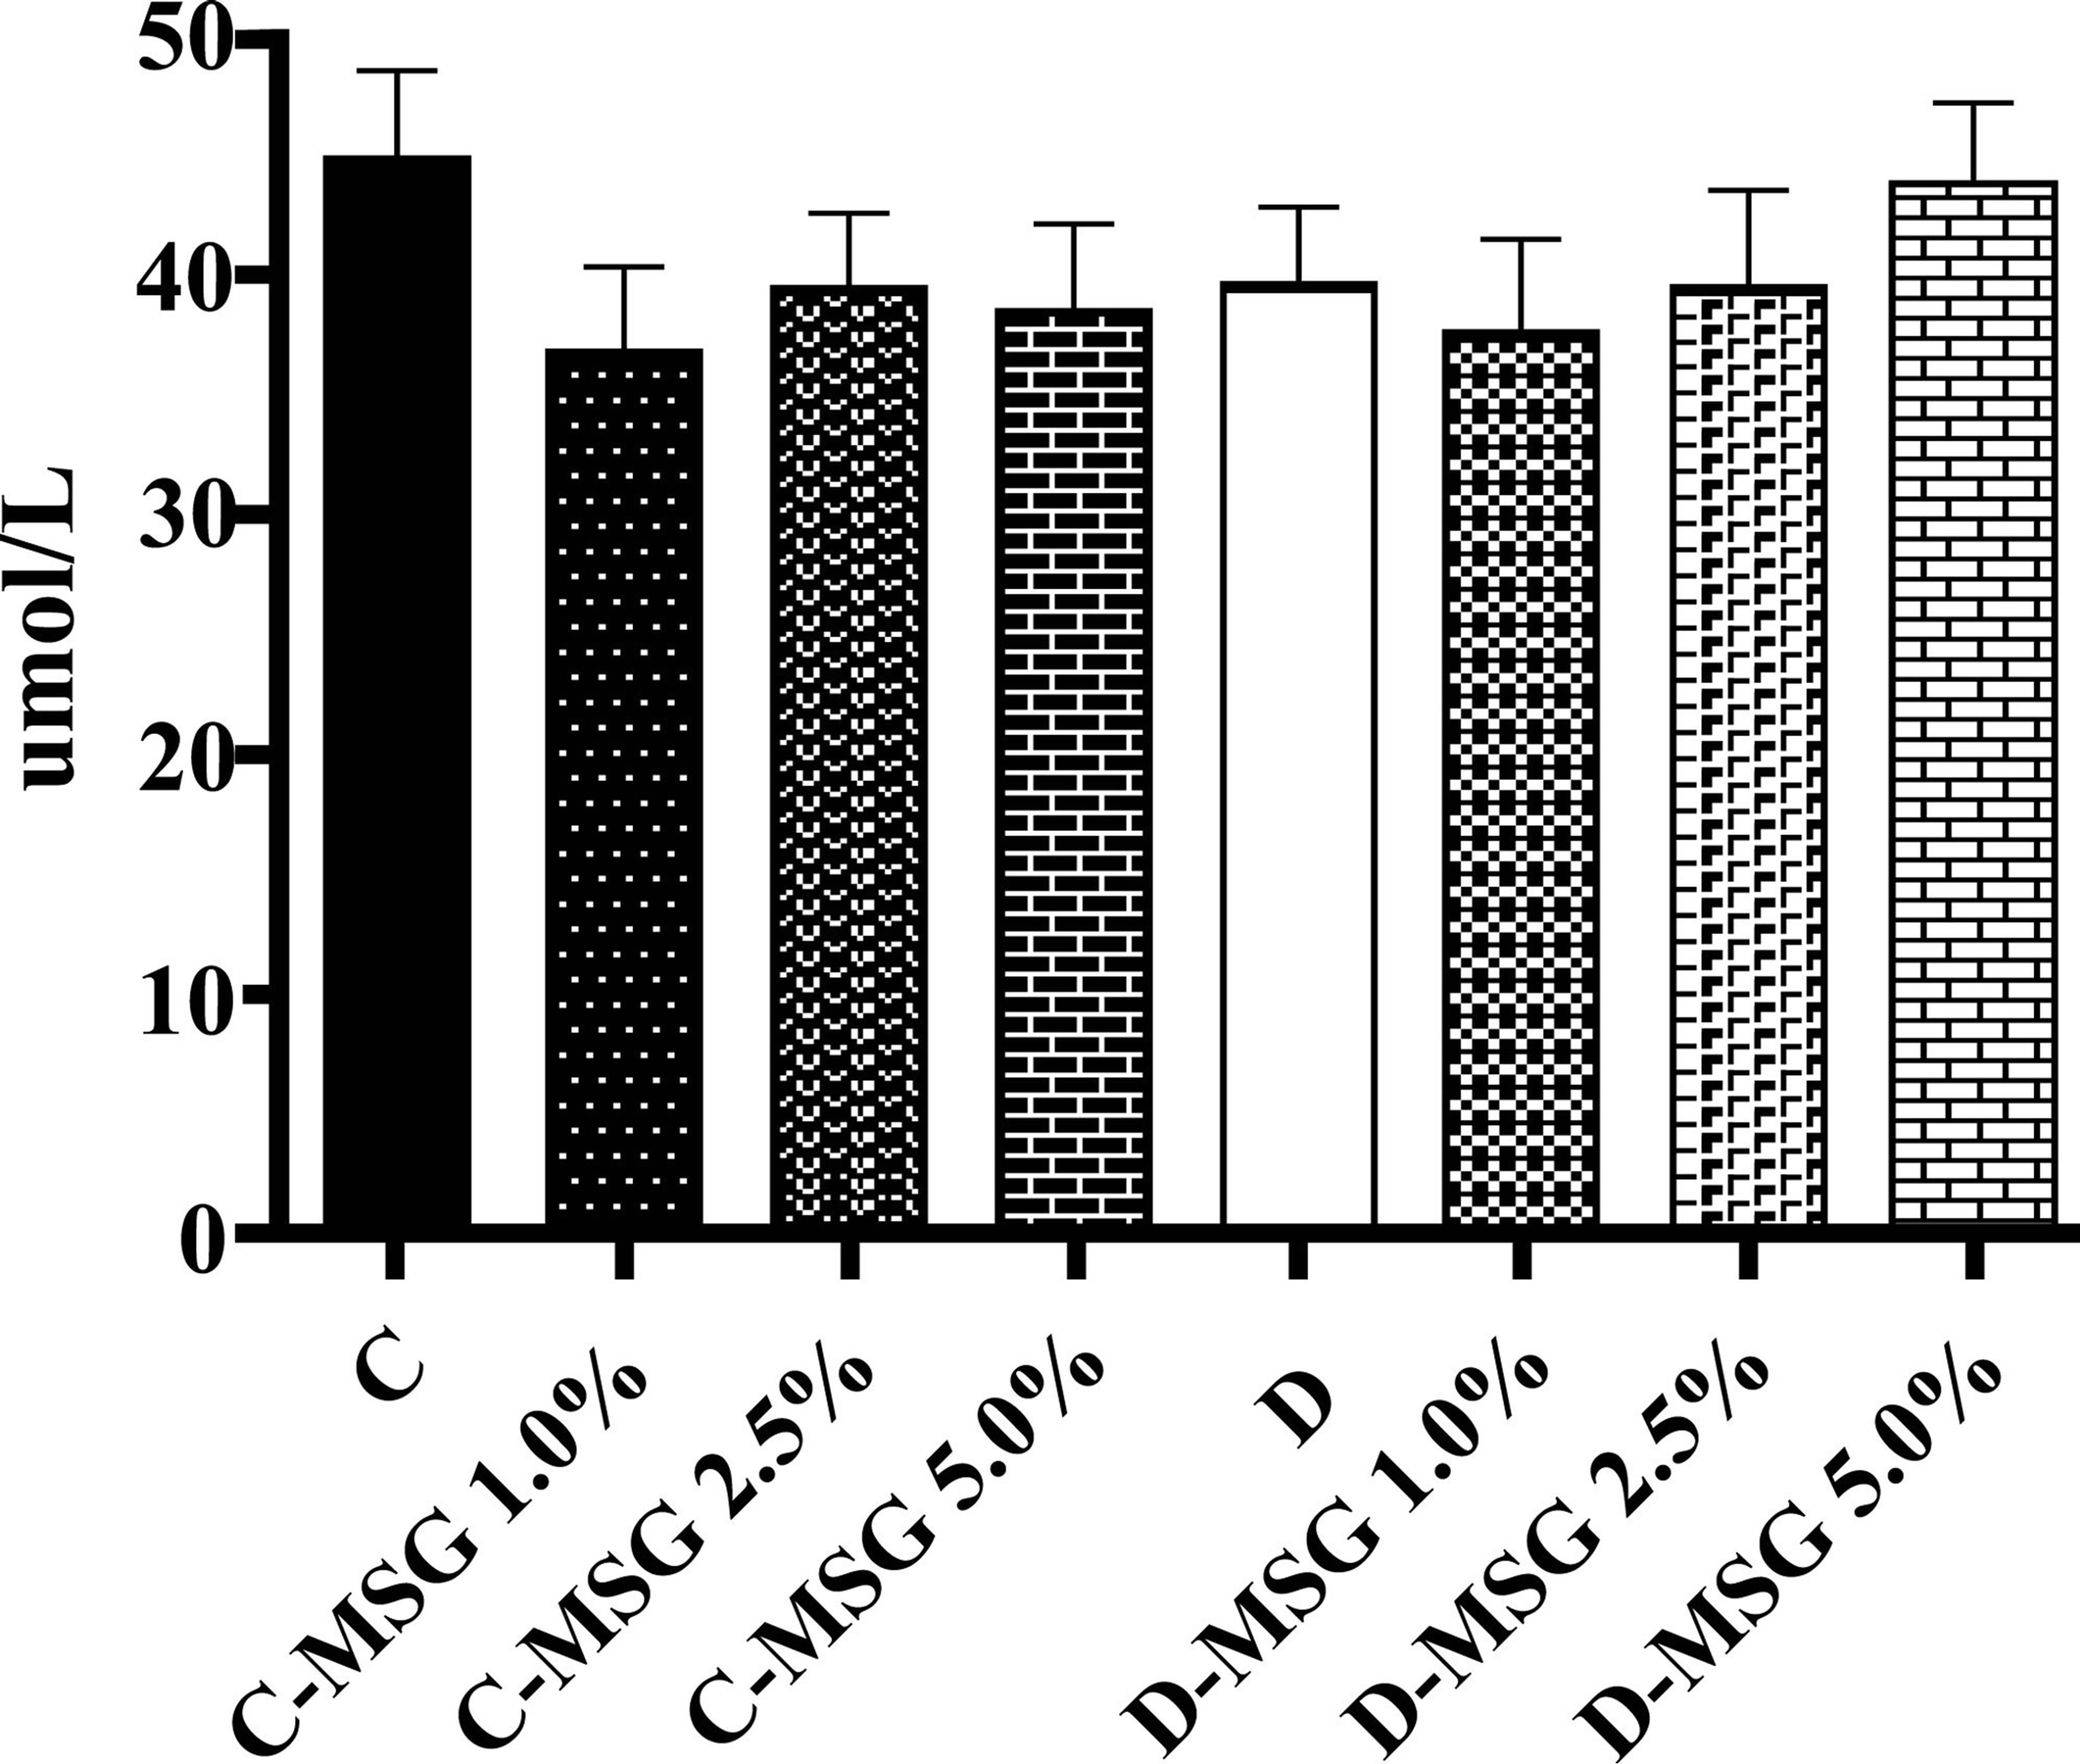
Figure 3. Free glutamate in plasma determined in the nondiabetic (C groups) and diabetic (D groups) Wistar rats fed with diets containing added MSG (1.0%, 2.5% or 5.0%).
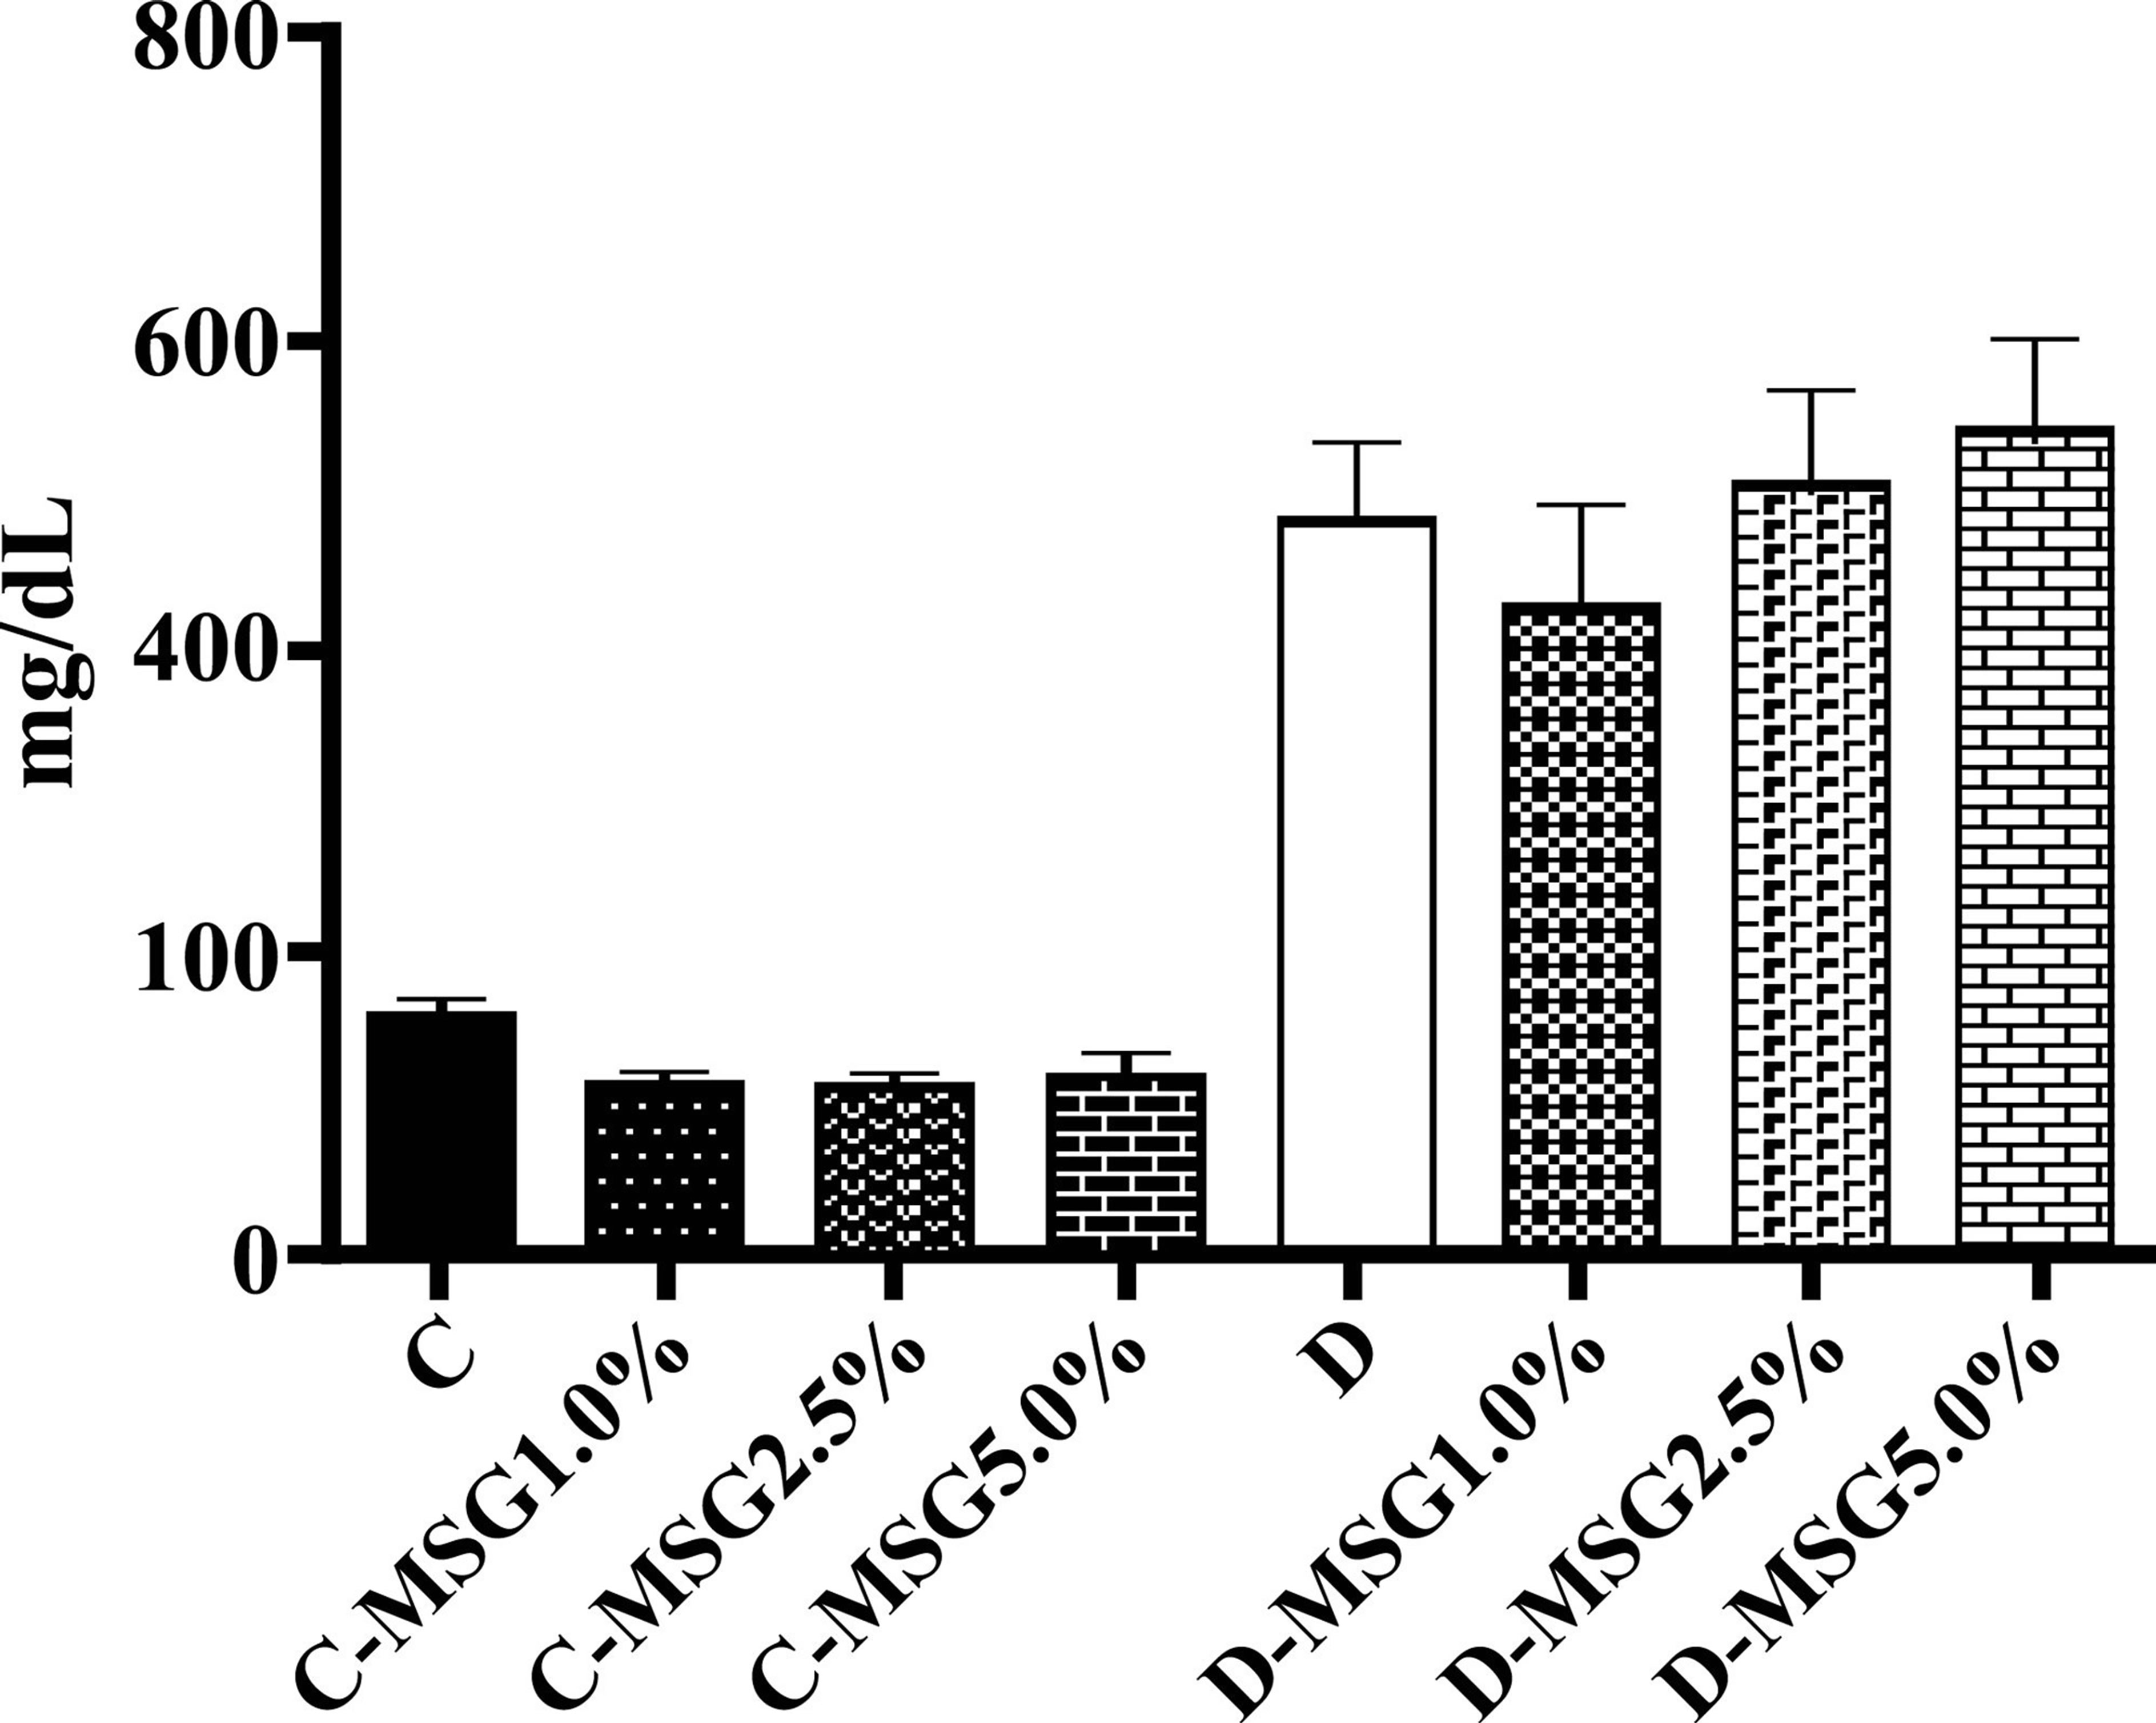
Figure 4. Blood glycemia determined in the non-diabetic (C groups) and diabetic (D groups) Wistar rats fed with diets containing added MSG (1.0%, 2.5% or 5.0%).
I II
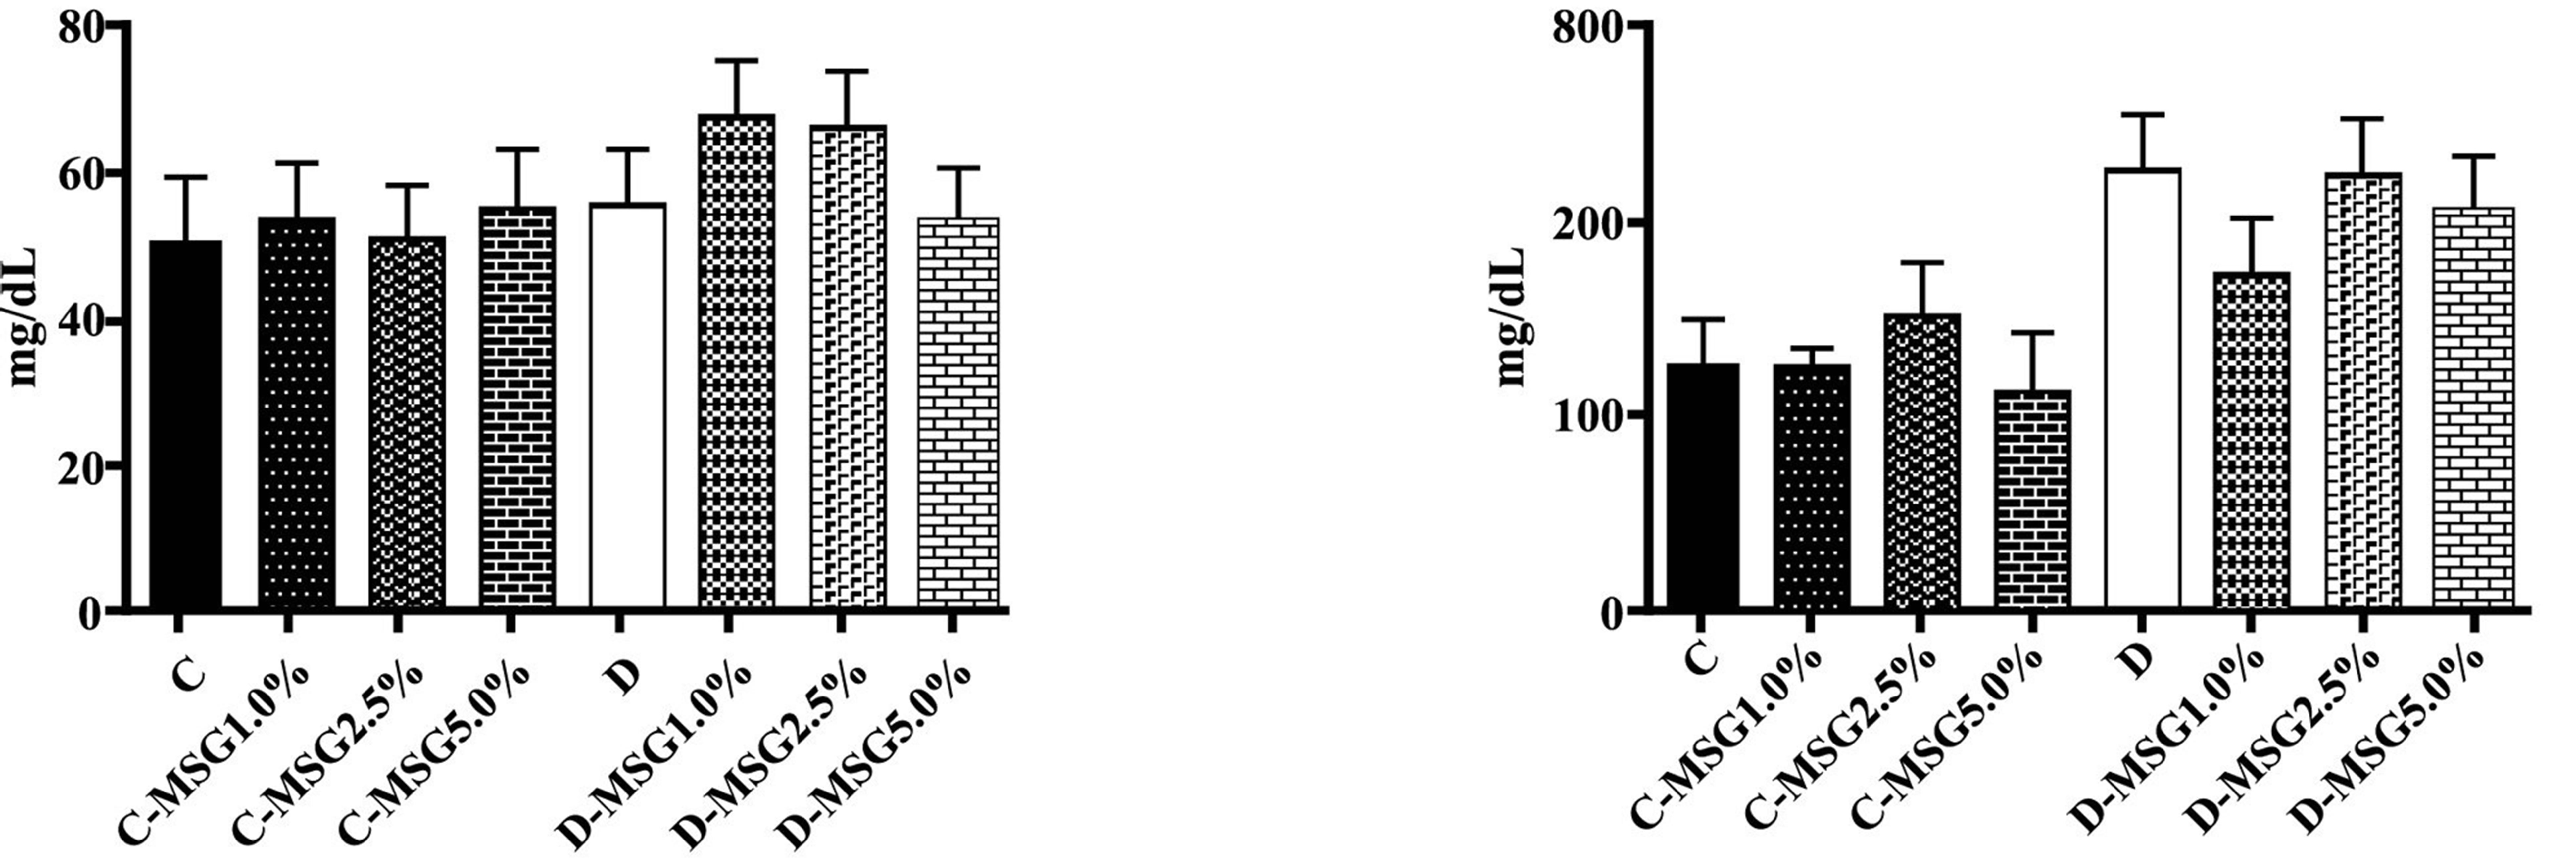
III IV
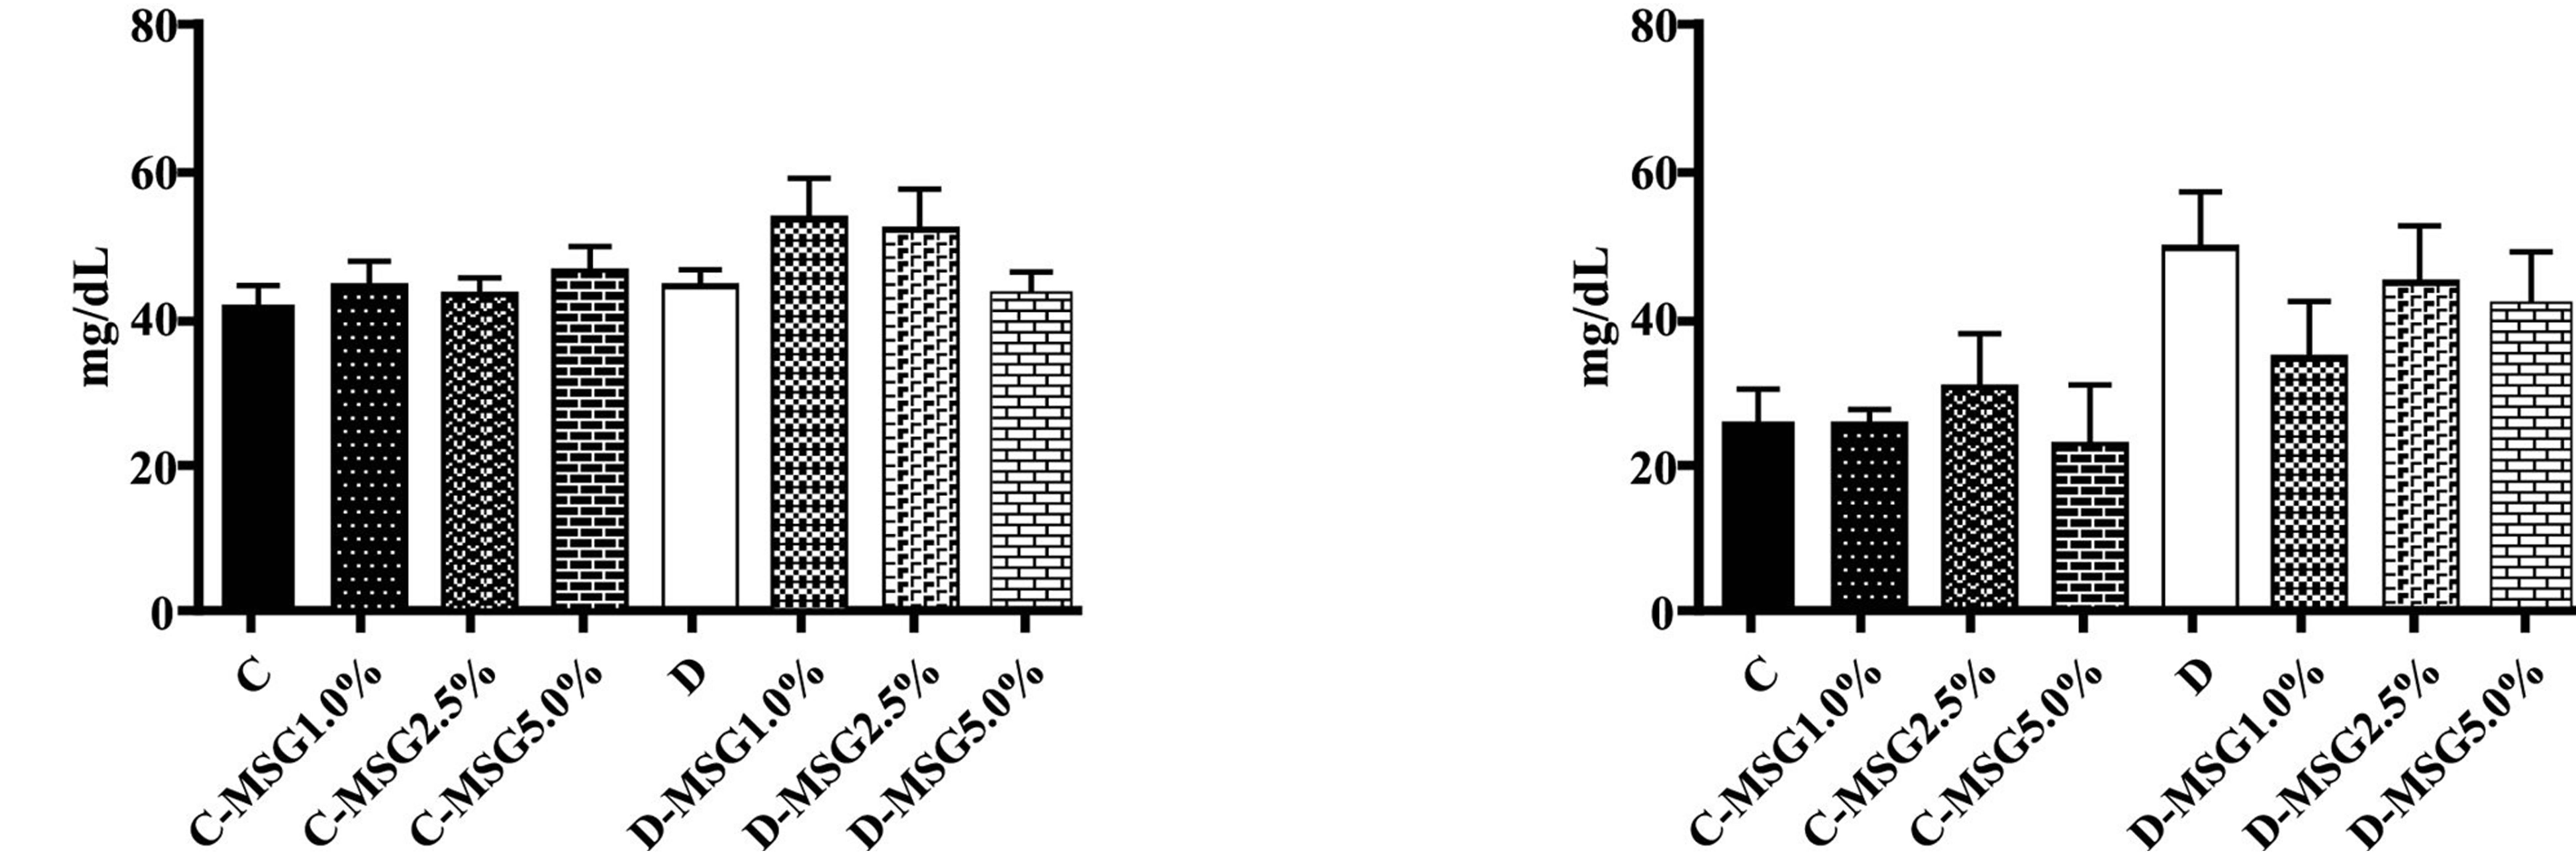
Figure 5. Triacylglycerol (I), total cholesterol (II), VLDL (III) and HDL (IV) determined in the non-diabetic (C groups) and diabetic (D groups) Wistar rats fed with diets containing added MSG (1.0%, 2.5% or 5.0%).
Table 1. Oxidative stress parameters determined in the blood of the non diabetic and diabetic rats that consumed diets containing 1.0%, 2.5% or 5.0% MSG (p < 0.05).
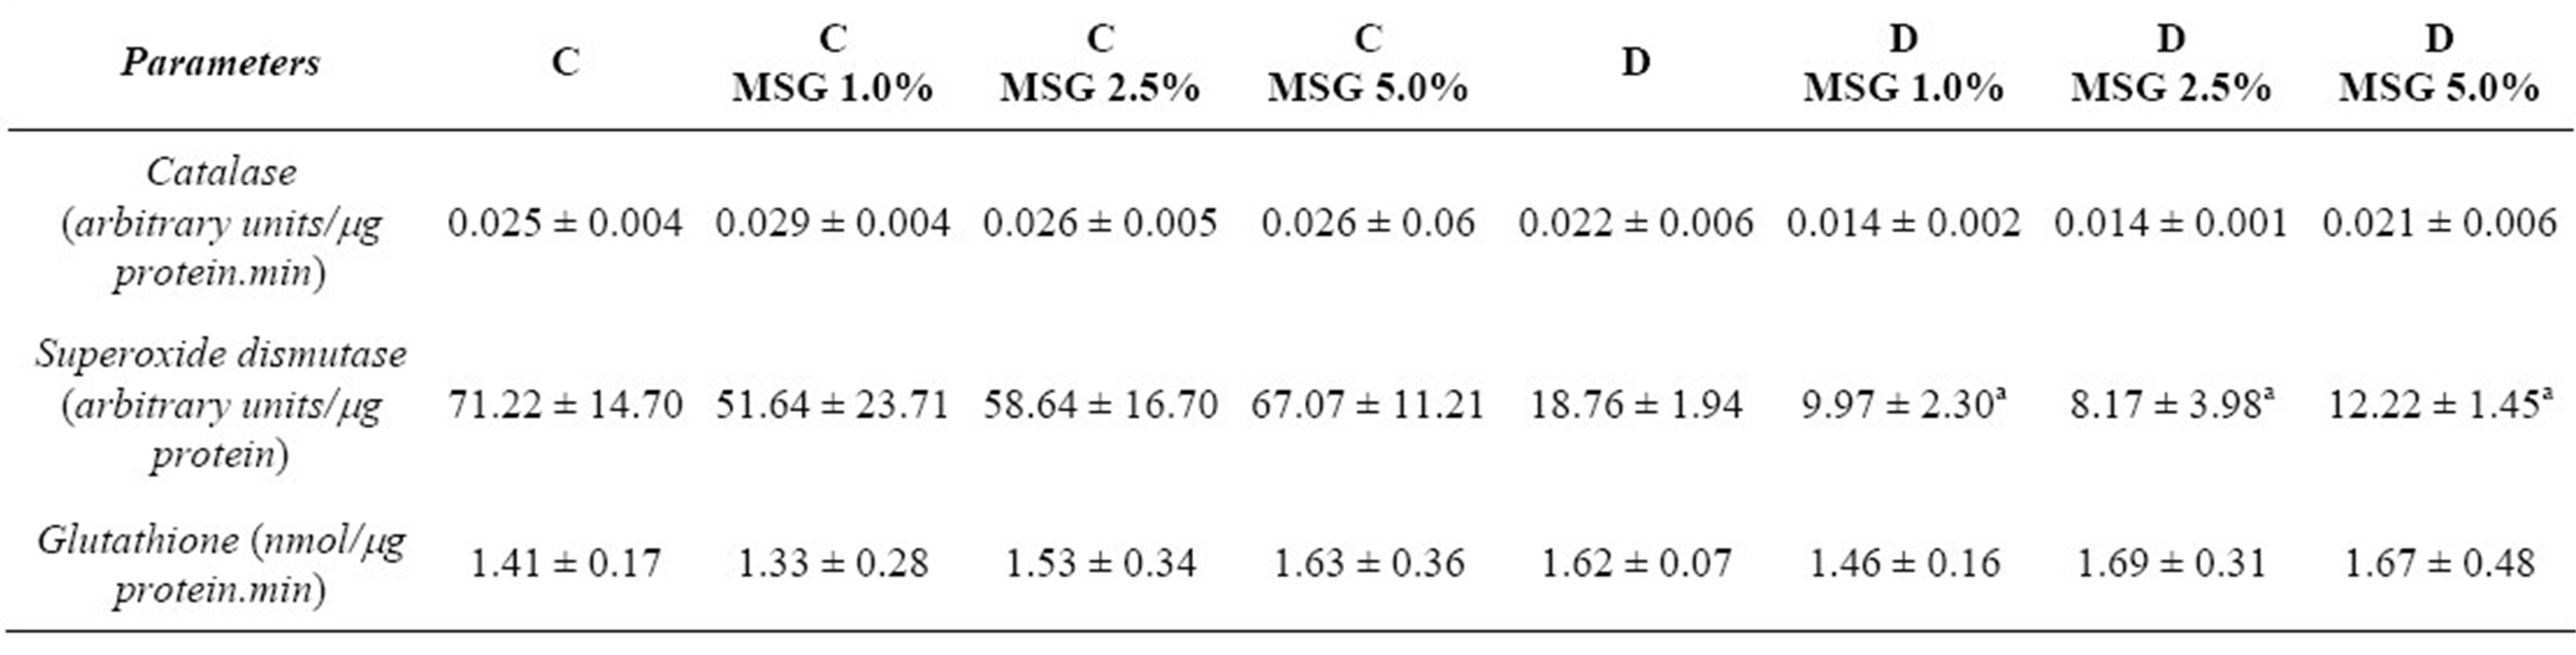
aSignificant difference from group D; baSignificant difference from group D-MSG5.0%.
alterations in morphology were observed in the kidneys of the rats, and these results were independent of diet and diabetic condition (Figures 8 and 9).
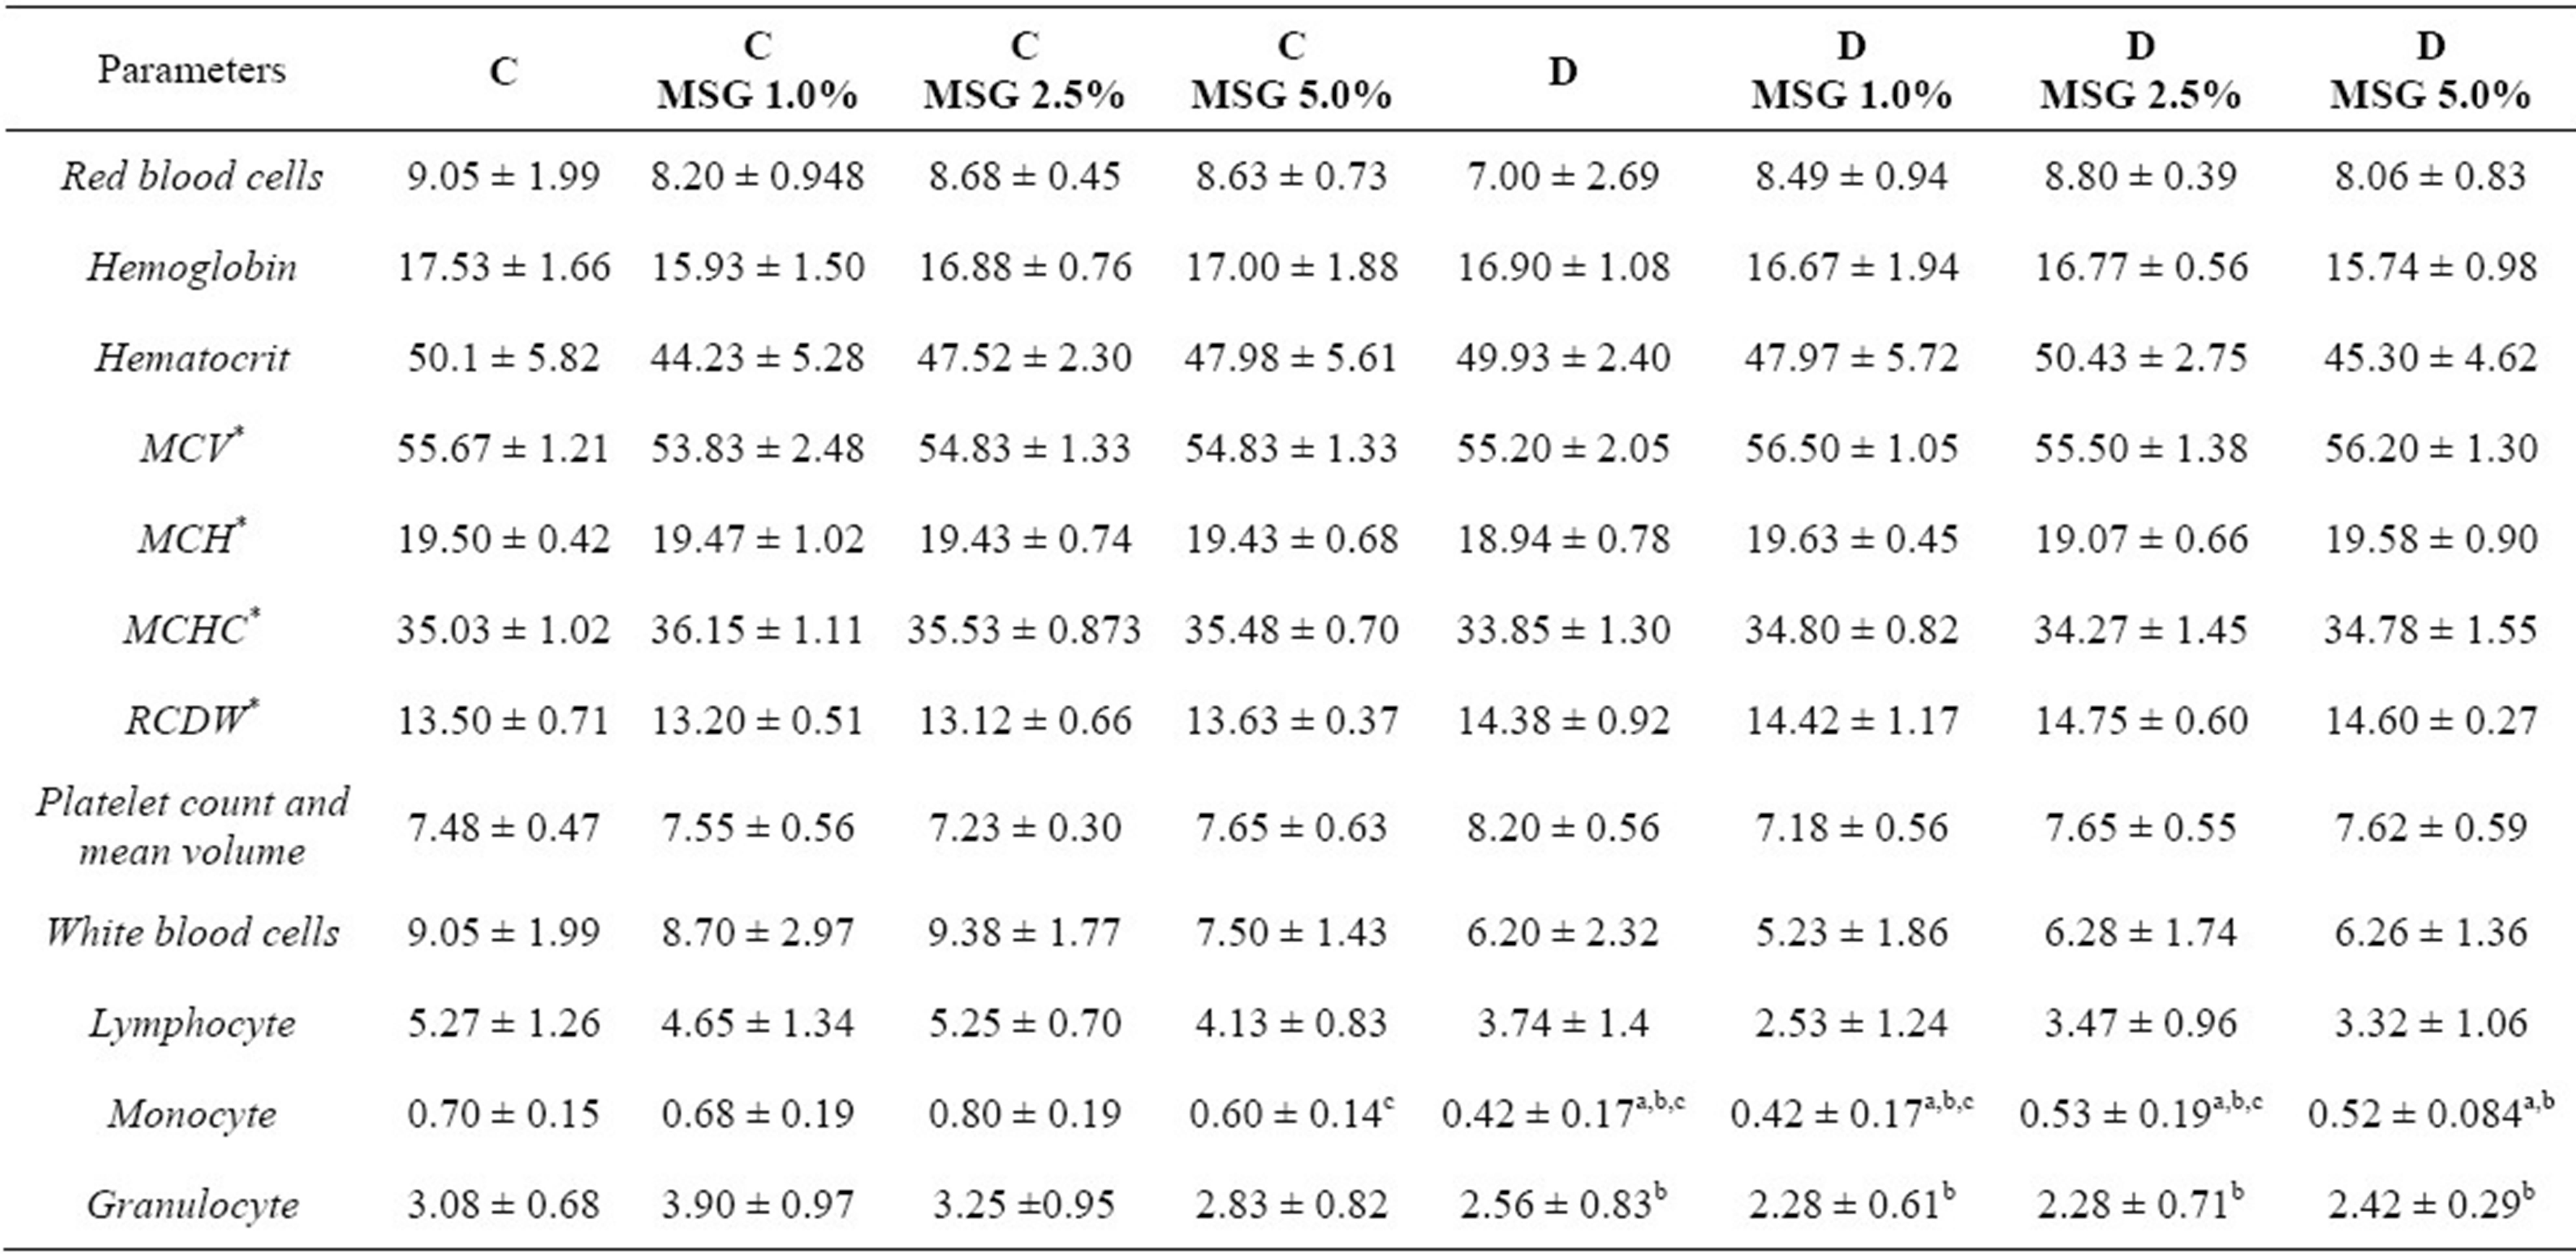
With respect to the hematologic profile (Table 2), no changes in anemia or platelet reduction were observed. However, the total white blood cell (WBC), lymphocyte, monocyte and granulocyte counts were decreased in the diabetic groups. The C-MSG 5.0% group presented a mild decrease in the monocyte count.
4. Discussion
Several authors have reported that the parenteral (4.0 mg/kg bw) [7,10,11] or oral (2.5 and 5.0 g/day) [8,9] administration of MSG in rodents may cause chronic
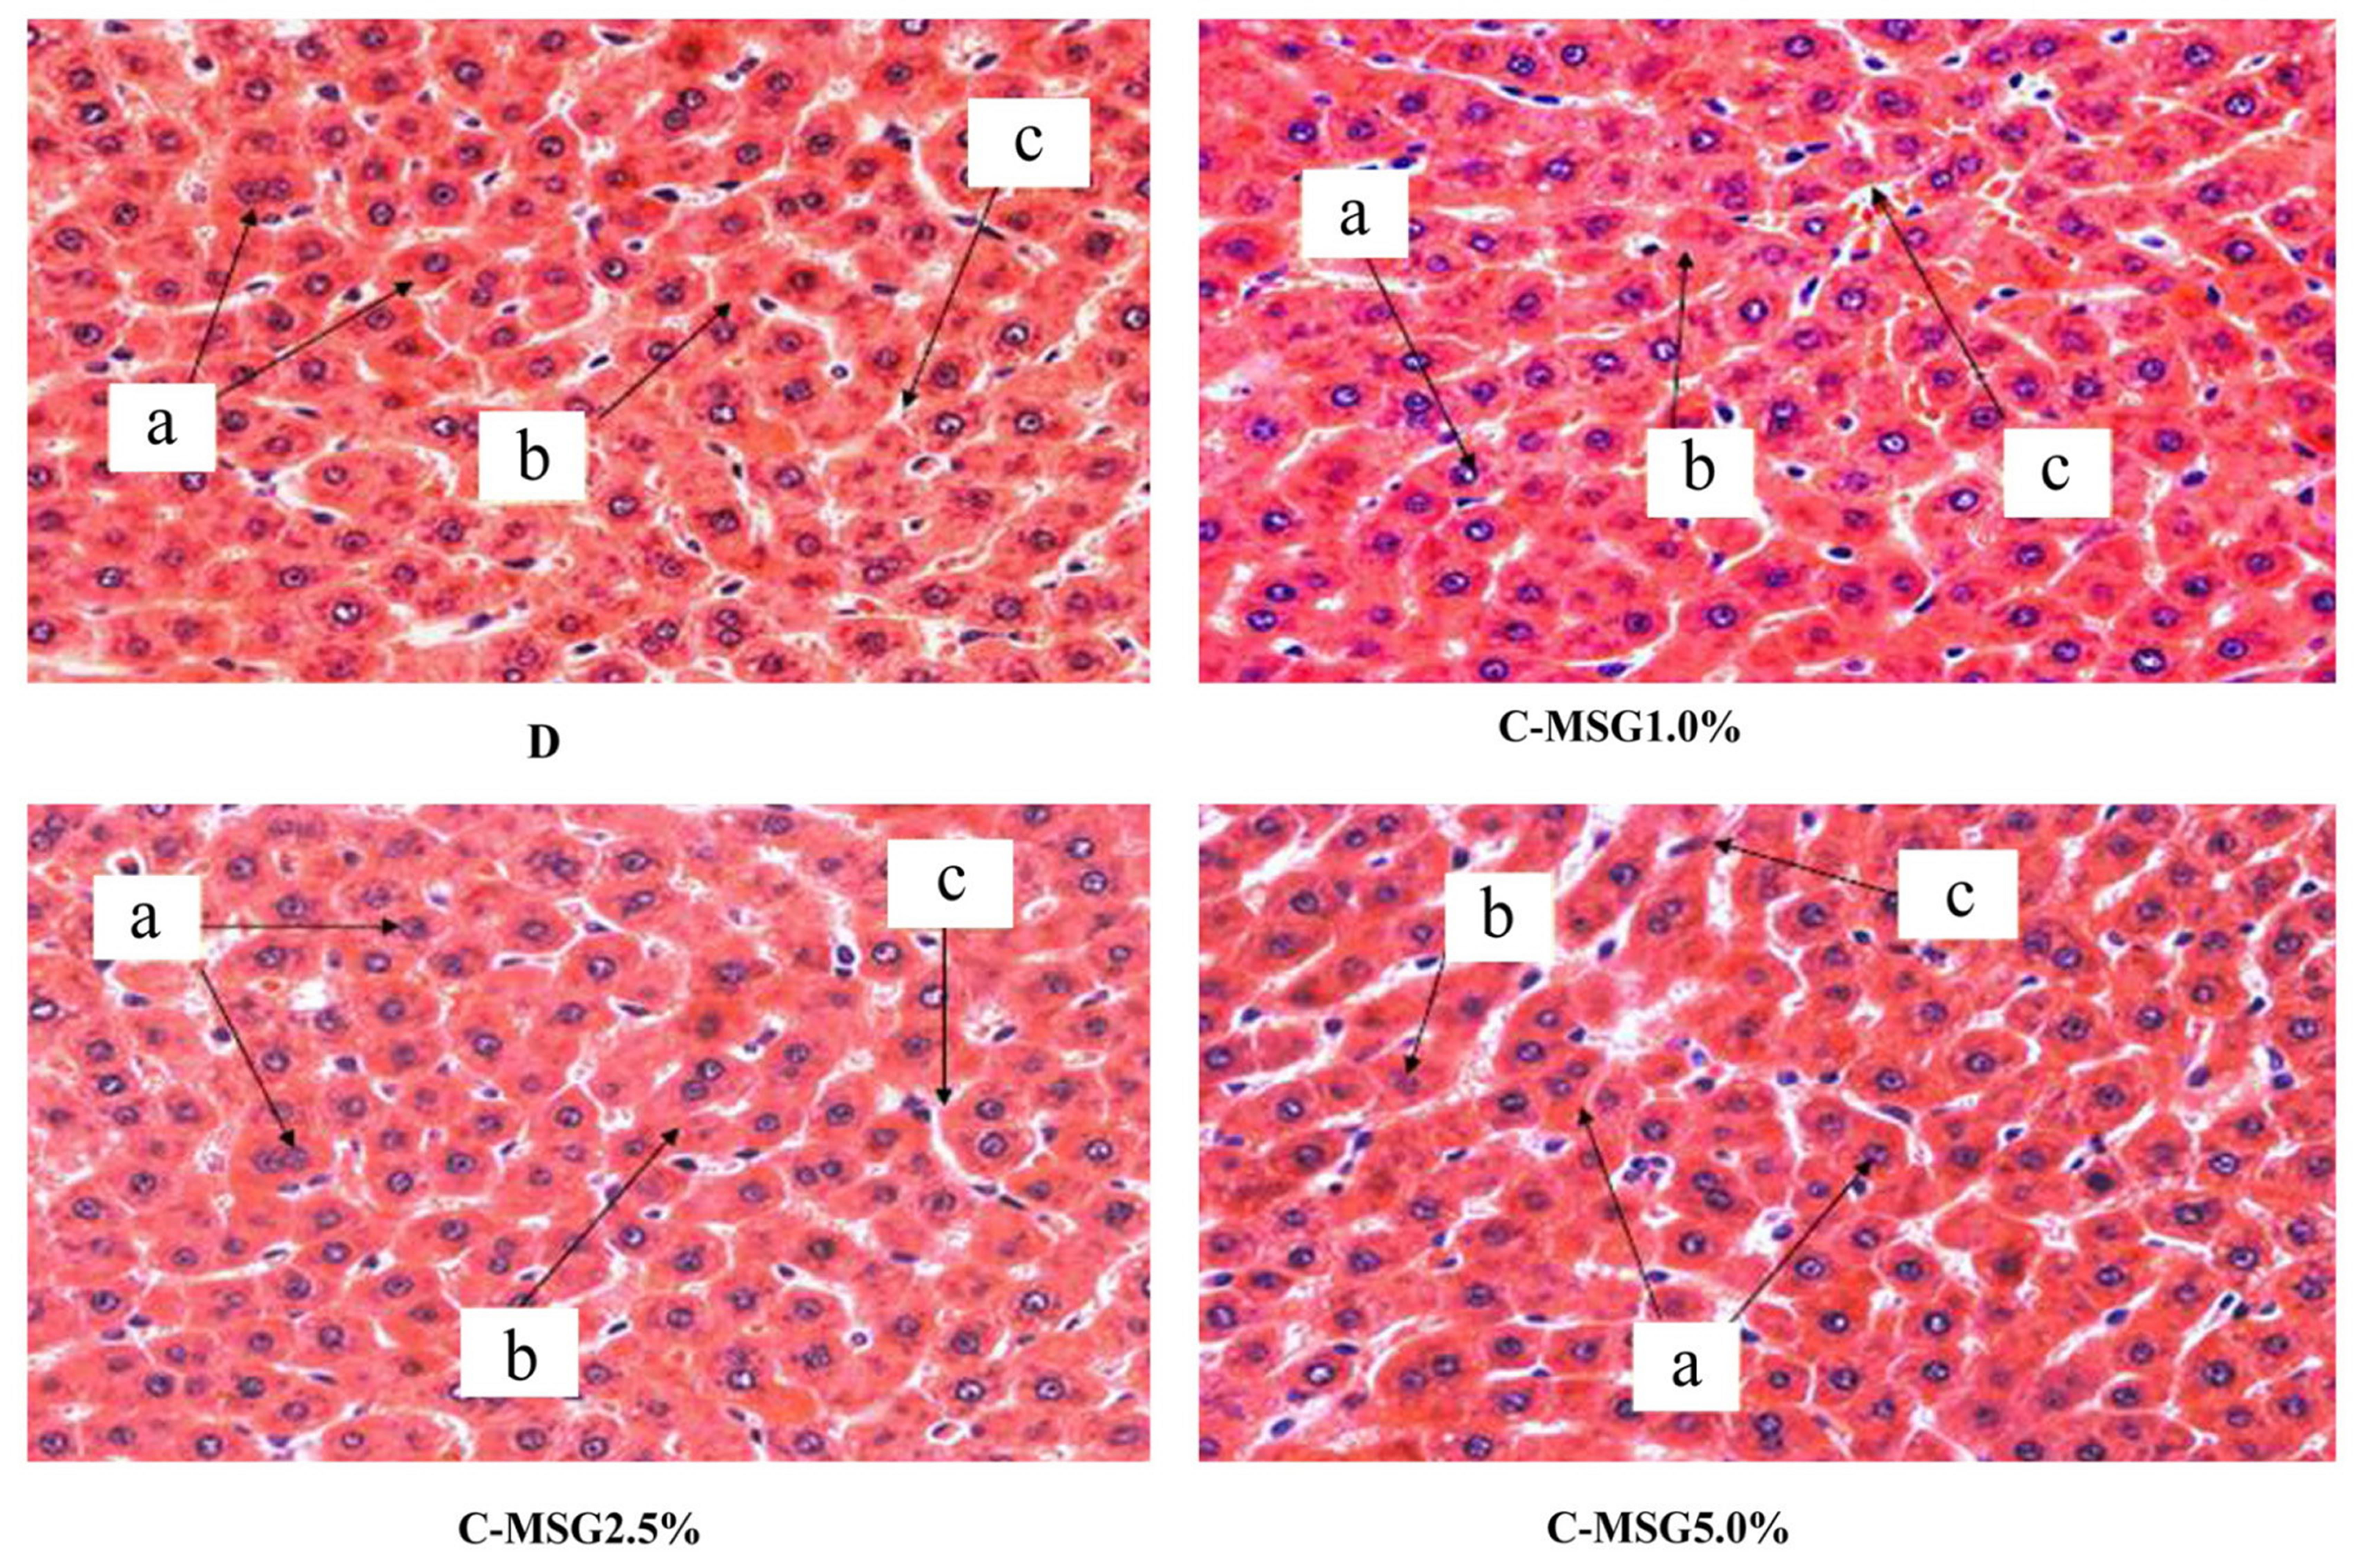
Figure 6. Photomicrograph (×40) of liver cross sections from non-diabetic (C group) Wistar rats fed with diets containing added MSG (1.0%, 2.5% or 5.0%), stained with HE. Observe the whole hepatocytes with one or two nuclei (a), normal cytoplasm with no granulosity or Küpffer cells (b) located between the hepatocytes and sinusoids (c). Lymphocytic infiltration was not observed.
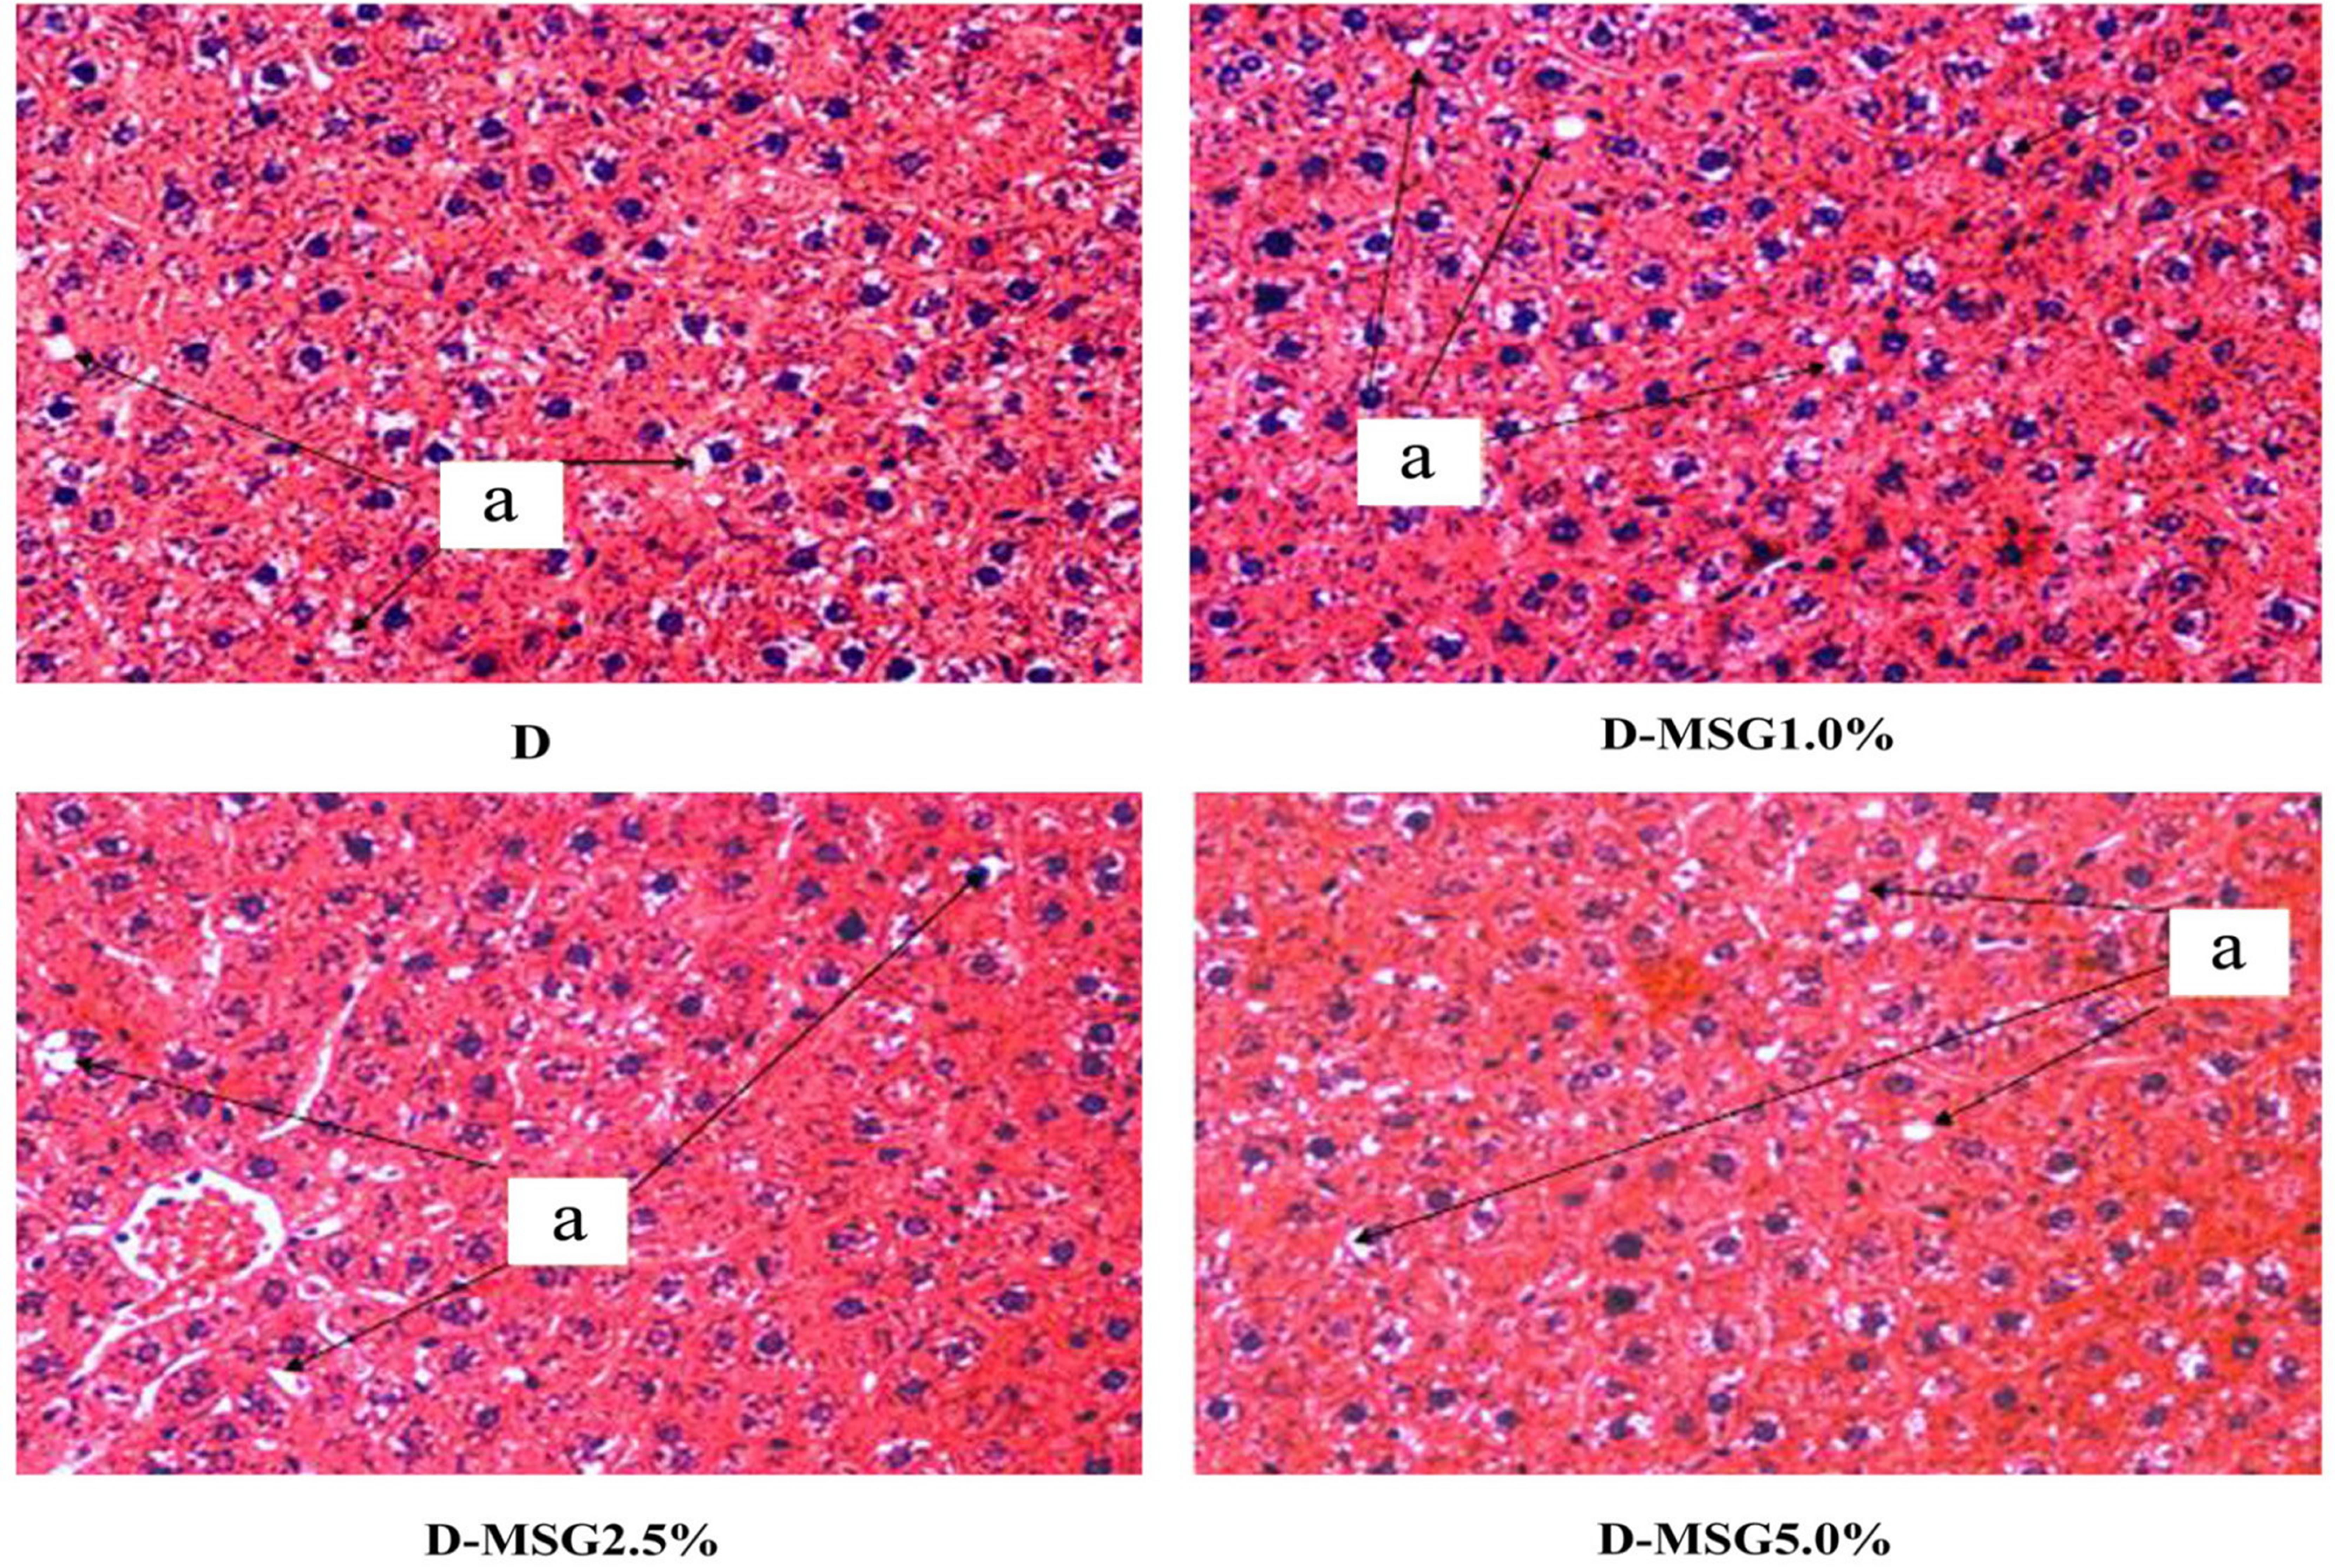
Figure 7. Photomicrograph (×40) of liver cross sections from diabetic (D group) Wistar rats fed with diets containing added MSG (1.0%, 2.5% or 5.0%), stained with HE. Observe the whole hepatocytes with lipid inclusions in the cytoplasm (a). Lymphocytic infiltration was not observed.
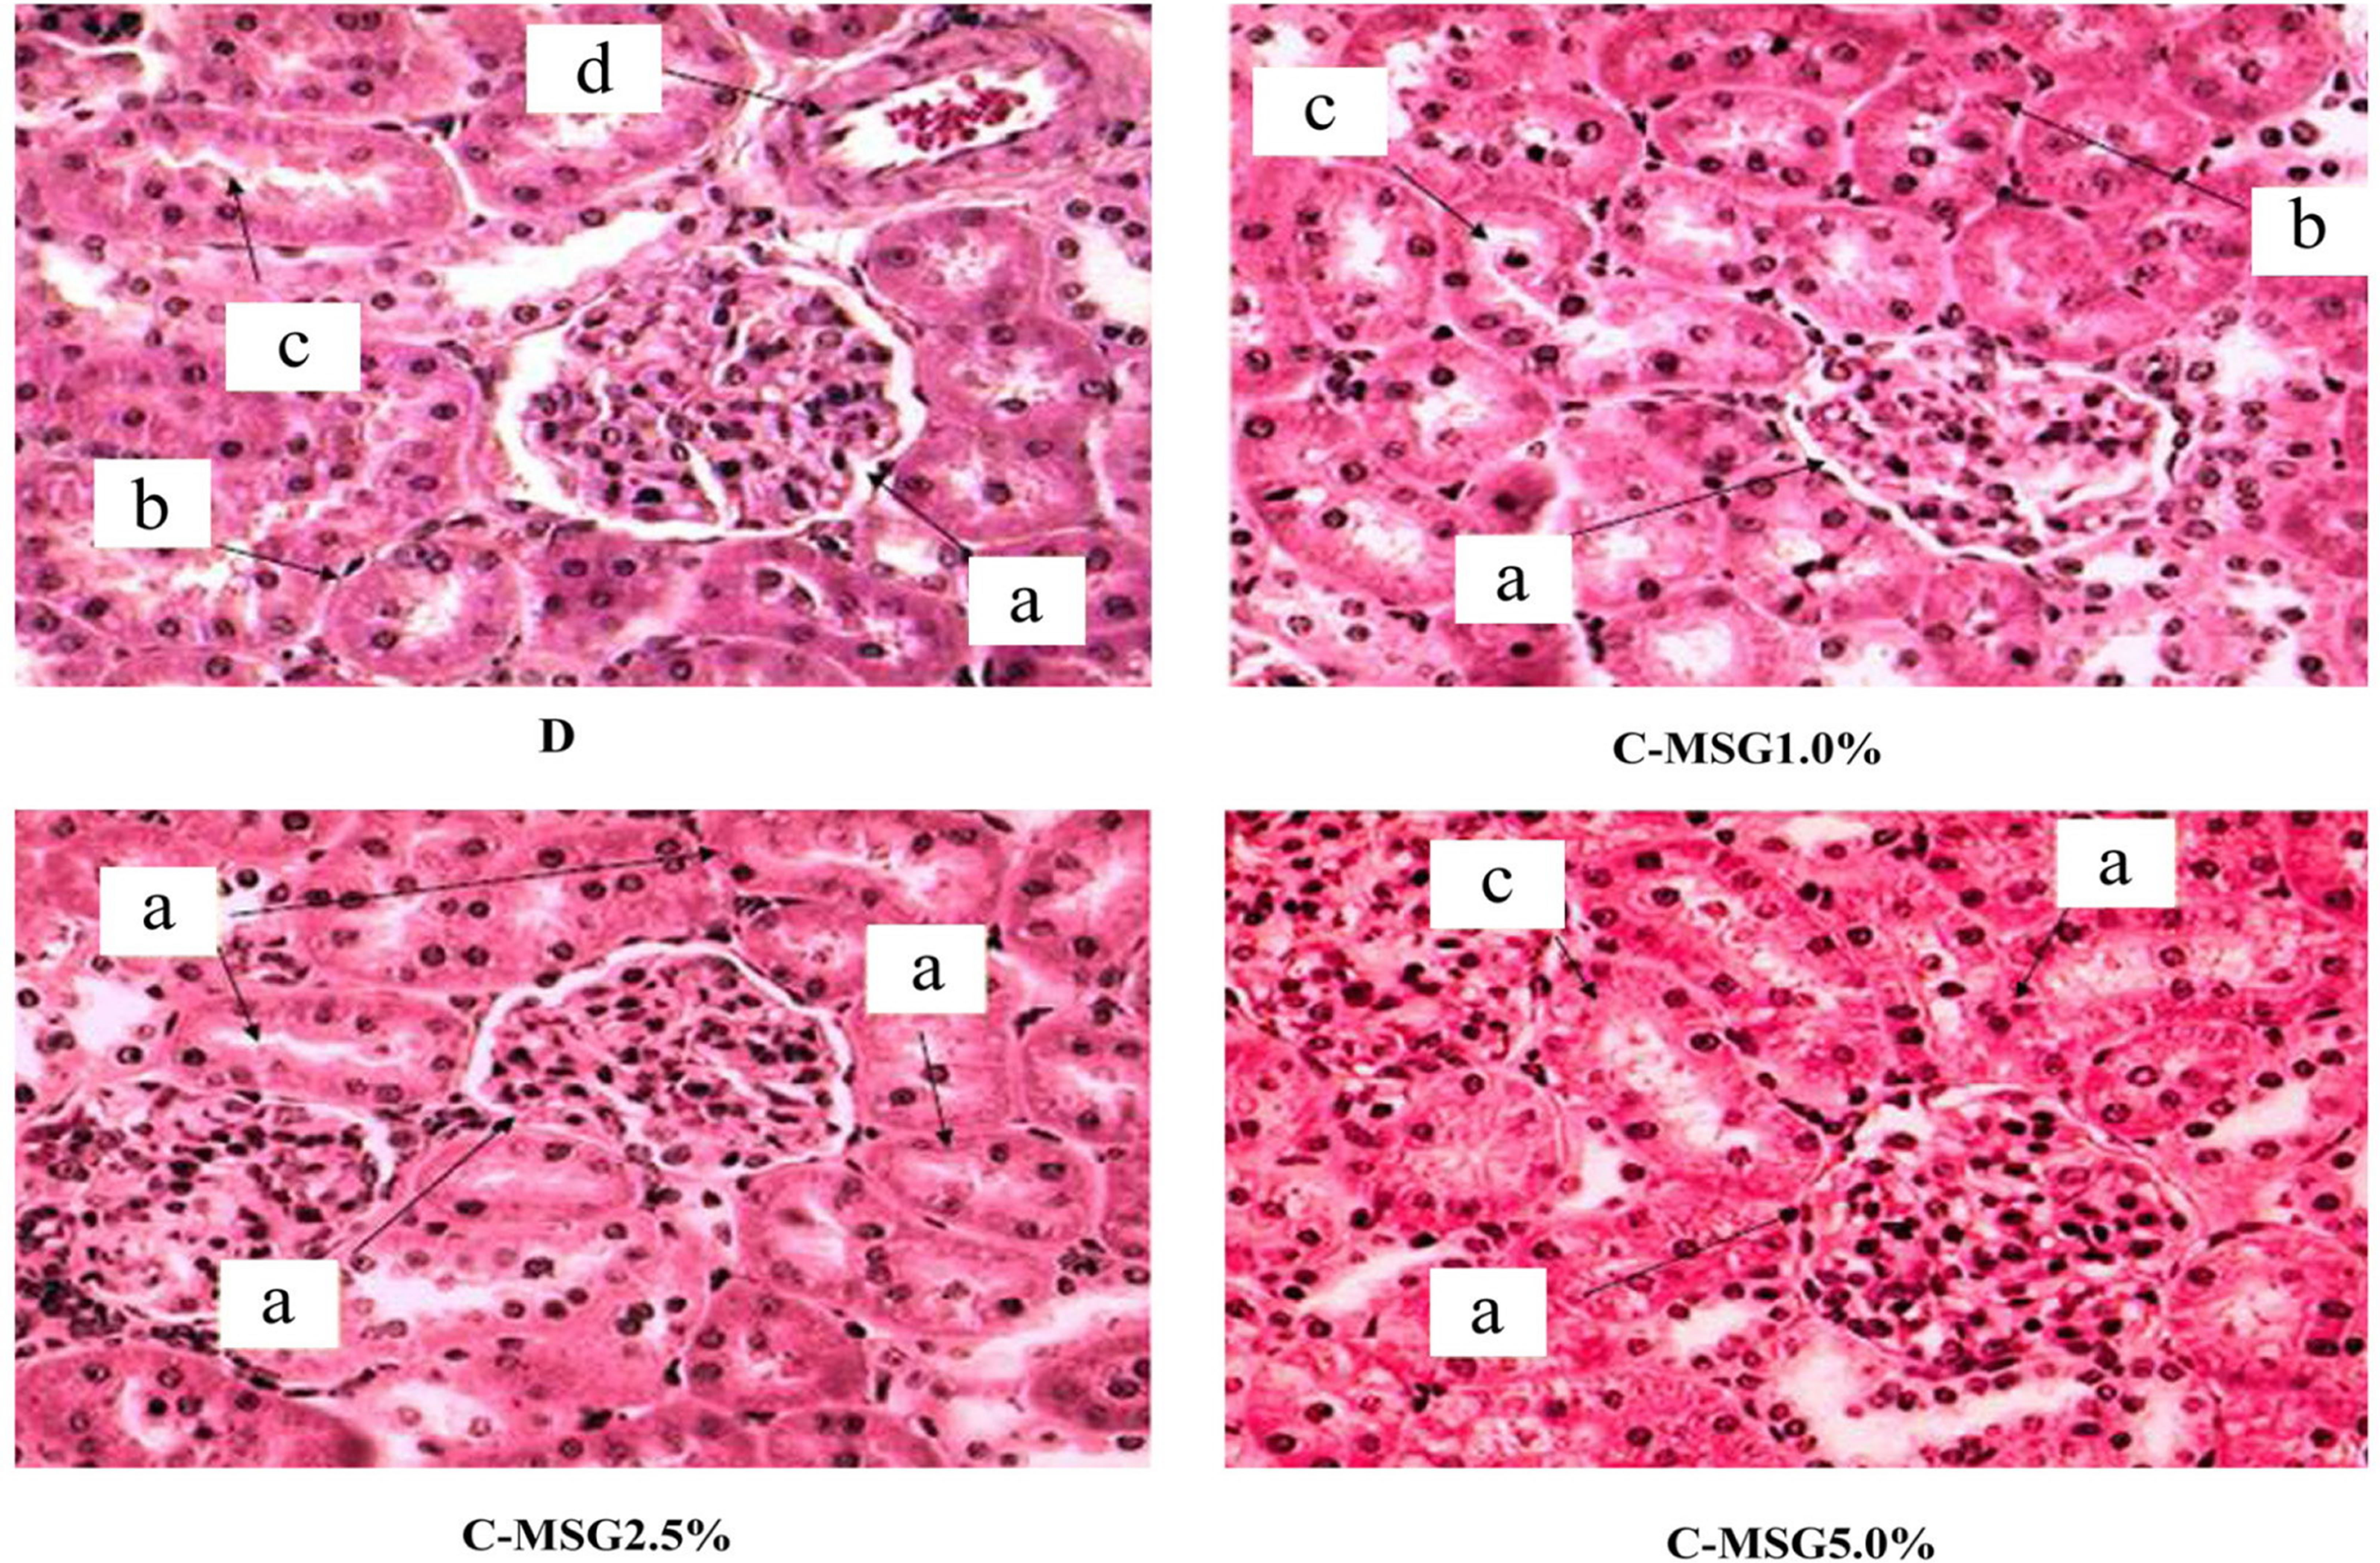
Figure 8. Photomicrograph (×40) of left kidney cross sections from non-diabetic (C group) Wistar rats fed with diets containing added MSG (1.0%, 2.5% or 5.0%), stained with HE. Bowman’s capsule with the capillaries forming a whole glomerulus (a). Proximal convoluted tubules are more numerous with narrow lumens and an epithelium with a brush-like border (b). Fewer distal convoluted tubules with slightly larger lumen and an epithelium showing no apical differentiation (c). Presence of blood capillaries (d).
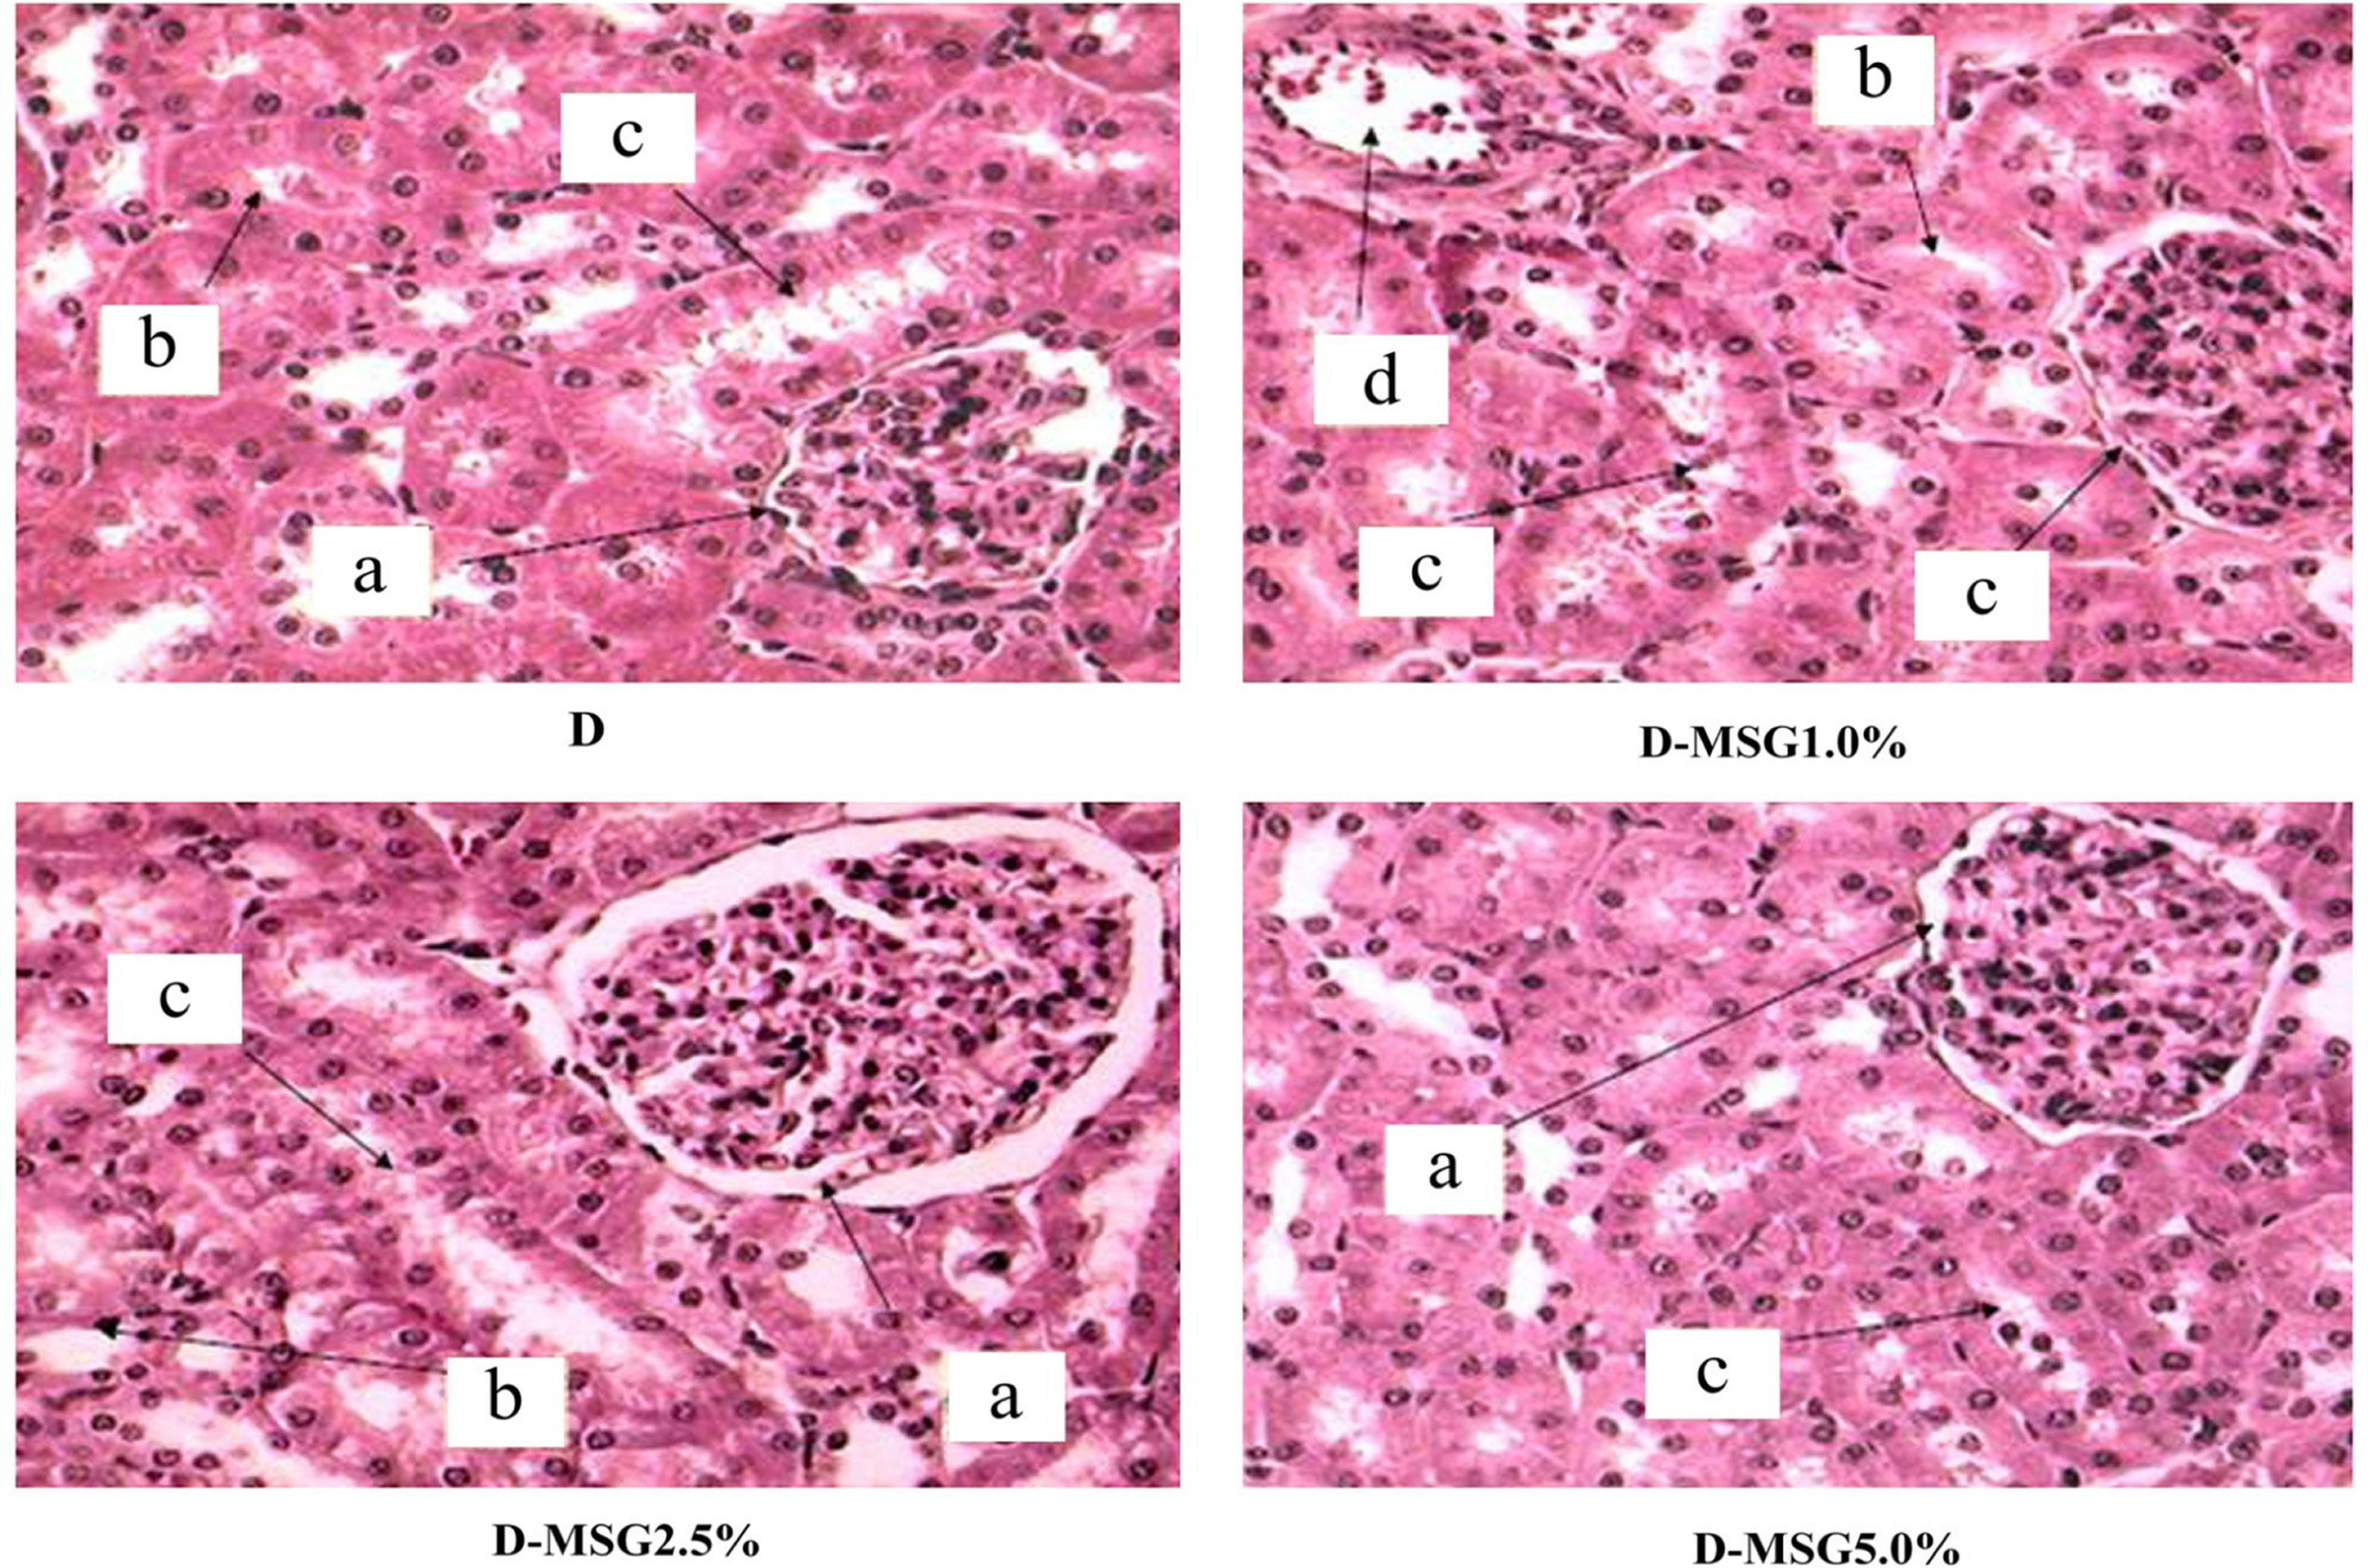
Figure 9. Photomicrograph (×40) of left kidney cross sections from diabetic (D group) Wistar rats fed with diets containing added MSG (1.0%, 2.5% or 5.0%), stained with HE. Bowman’s capsule with the capillaries forming a whole glomerulus (a). Proximal convoluted tubules are more numerous with narrow lumens and an epithelium with a brush-like border (b). Fewer distal convoluted tubules with slightly larger lumen and an epithelium showing no apical differentiation (c). Presence of blood capillaries (d).
Table 2. Hematological parameters determined in the blood of the non diabetic and diabetic rats that consumed diets containing 1.0%, 2.5% or 5.0% MSG (p < 0,05).
hyperglutamatemia in the blood of newborn rats. This causes injurious effects on the hypothalamic arcuate nucleus and changes appetite control, resulting in obesity. However, the glutamate in these studies was administered via parenteral or at high oral levels only, which does not reflect its recommended use as an additive in food preparation.
Due to its sensorial properties, the amount of MSG normally used in the human diet is between 0.1% - 0.8% [1,2]. In our study, we used diets containing MSG at levels of 1.0%, 2.5% and 5.0%. The food intake was similar across all of the groups (Figure 2) and the amount of MSG ingested by the groups reflected the amount included in the diet. Consequently, the ingestion of diets containing up to 5% MSG did not induce obesity, nor increase diet consumption, in newly weaned rats (21 days of age) when they consumed diets ad libitum for a total period of 91 days.
Contradictory results with respect to the relationship between body weight gain and the consumption of a MSG-containing diet have been reported in rats. Hermanussen et al. [9] reported that the ingestion of MSG increased body weight gain and food consumption. On the other hand, in a study using Sprague-Dawley rats fed with diets of varying caloric density, fat and carbohydrate contents, Kondoh and Torii [22] found a significant difference in body weight gain between rats that drank a 1.0% MSG solution and those that drank only water and concluded that the voluntary ingestion of an MSG solution reduced weight gain and had no effects on food intake. The present study used the concentrations of 1.0%, 2.5% and 5.0% MSG in the diet. No effect in body weight gain was observed as well as diet consumption was not affected during the experimental period, among the control and the rats that ingested MSG, for both non-diabetic and diabetic animals (Figure 2). These data indicate that before and after the diabetes induction period, there were no significant differences between the groups receiving the commercial diet and those receiving the commercial diet plus MSG.
Even when relatively large quantities of MSG are added to the food of mice, monkeys or humans, only very small changes in the plasma concentration of glutamate have been reported to occur [23-25]. Our findings corroborate these previous results; the level of free glutamic acid in the plasma (Figure 3) showed no differences between the control group and those that received MSG in their diet. The mean free glutamate concentration in the plasma was 40.14 µmol/L for all of the groups. According to Reeds et al. [26] and Burrin & Stoll [27], almost all of the free glutamate that is ingested is metabolized (95%) in the intestinal wall of pigs during the absorption process. We analysed aspartate, alanine, arginine and proline, because they are important amino acids in glutamate metabolism [27]. No significant difference (p < 0.05) in the plasma content was found among the groups for those aminoacids.
Similar to the results reported by Simon & West [28], who induced a diabetic state with a single intraperitoneal dose (45 mg/kg b.w.) of STZ in rats, all of the animals that were treated with STZ (50 mg/kg b.w.) in this study (groups D, D-MSG 1.0%, D-MSG 2.5%, D-MSG 5.0%) presented increased serum glucose levels, indicating a diabetic condition in relation to the control groups (C, C-MSG 1.0%, C-MSG 2.5%, C-MSG 5.0%). However, no differences in blood glucose levels occurred among the diabetic control and the animals that ingested different amounts of MSG in their diet (Figure 4).
The rat serum lipid profiles (triacylglycerols, total cholesterol, HDL and VLDL) indicated that the diabetic animals exhibited increased concentrations of these lipids compared to the non-diabetic animals and that this increase was independent of the addition of MSG to the diet at the concentrations studied (Figures 5). These alterations may be attributed to the metabolic changes induced by the diabetic condition.
Studies performed on non-diabetic mice have correlated the histological hepatic changes caused by nonalcoholic fatty liver disease (NAFLD) to increased plasmatic lipids generated by the oral [29] administration of MSG. In contrast to the observations made by these authors, in the present study the hepatic histological analyses of the non-diabetic rats showed preserved hepatocytes and absence of lipid inclusions, likely due to the lack of alterations in the serum lipid levels in these animals. These results were independent of the addition of MSG to the diet (Figure 6). On the other hand, the diabetic groups (D, D-MSG 1.0%, D-MSG 2.5%, D-MSG 5.0%) showed lipid inclusions in the cytoplasm of the hepatocytes (Figure 7), suggesting that nonalcoholic hepatic steatosis occurred in all of the diabetic groups independent of the addition of MSG to the diet. This condition likely occurred as a result of the increased concentration of triacylglycerols in the serum of the diabetic animals, as previously reported. In fact, diabetes and dyslipidemias are important risk factors in the genesis of nonalcoholic hepatic steatosis [30].
SOD and catalase are known to be important enzymes in the antioxidant defense system of the body. The major function of SOD is to catalyze the conversion of superoxide anion radicals to hydrogen peroxide in order to reduce their toxic effects. On the other hand catalase is responsible for the removal of intracellular hydrogen peroxide produced by SOD [31]. If activities are impaired, some antioxidant enzymes contribute to the development of endothelial dysfunction in diabetes by increasing oxidative stress [32]. A decrease in the activity of hepatic SOD enzymes and catalase was observed in the diabetic rats, and this was correlated to the presence of MSG in the diet. In contrast, Singh & Ahluwalia [33] and Farombi & Onyema [34], who administered MSG subcutaneously in non-diabetic animals, verified increase in the activities of SOD and catalase. No significant changes in glutathione-S-transferase activity were observed among the studied groups. The non-diabetic animals exhibited no significant changes in the activity of these enzymes, and this result was independent of the addition of MSG to the diet (Table 1).
As previously reported, the high glucose levels caused by diabetes may result in peroxidation of cell membrane lipids, including those of red blood cells. Peroxidation of red blood cells likely occurs by glucose enolization, the production of a-ketoaldehydes and free radical intermediates; this process reduces molecular oxygen and, as a consequence, causes hemolysis due to membrane weakening [35]. However, even at high glucose levels, insignificant differences were observed in the blood cell count or in the hemoglobin and hematocrit levels. There was also no alteration in the platelet count. In contrast, a significant reduction in the white cell count (lymphocytes, monocytes and granulocytes) was observed in the diabetic animals, and this was independent of the addition of MSG to the diet (Table 2). This occurs due to the metabolic changes induced by the diabetic condition, reducing immunologic function and increasing the risk of infection [36,37].
5. Conclusion
Male Wistar rats oral exposed to MSG, at levels up to 5.0% in the diet, during 13 weeks, did not shown alterations in biochemical, hematological and histological parameters in relation to the control group. The biochemical and histological alterations observed in the diabetic animals (diabetes was induced after the 10 weeks exposure and the animals maintained under the same diets for additional 3 weeks) mainly reflected metabolic changes that are characteristic of this disease, and they were independent of the addition of MSG to the diet.
6. Acknowledgements
The authors thank the Brazilian Foundation for Improvement of Higher Education (CAPES) and the International Glutamate Technical Committee (IGTC) for financial support.
REFERENCES
- S. Jinap and P. Hajeb, “Glutamate. Its Applications in Food and Contribution to Health,” Appetite, Vol. 55, No. 1, 2010, pp. 1-10. doi:10.1016/j.appet.2010.05.002
- S. Yamaguchi and K. Ninomiya, “Umami and Food Palatability,” The Journal of Nutrition, Vol. 130, Suppl. 4, 2000, pp. 921-926.
- Toxicological Evaluation of Certain Food Additives, “L-Glutamic Acid and Its Ammonium, Calcium, Monosodium and Potassium Salts,” WHO Food Additives Series, No. 22, Cambridge University Press, Cambridge, 1988, pp. 97-161.
- US Food and Drug Administration, “Database of GRAS Substances that Were Evaluated by the Select Committee on GRAS Substances (SCOGS),” 2006. http://www.fda.gov/Food/FoodIngredientsPackaging/GenerallyRecognizedasSafeGRAS/GRASSubstancesSCOGS Database/default.htm
- FASEB, “Analysis of Adverse Reactions to Monosodium Glutamate (MSG), Report,” Life Sciences Research Office, Federation of American Societies of Experimental Biology, Washington DC, 1995.
- Y. S. Diniz, A. A. H. Fernandes, K. E. Campos, F. Mani, B. O. Ribas and E. L. B. Novelli, “Toxicity of Hypercaloric Diet and Monosodium Glutamate: Oxidative Stress and Metabolic Shifting in Hepatic Tissue,” Food and Chemical Toxicology, Vol. 42, No. 2, 2004, pp. 313-319. doi:10.1016/j.fct.2003.09.006
- C. Broberger, “Brain Regulation of Food Intake and Appetite: Molecules and Networks,” Journal of Internal Medicine, Vol. 258, No. 4, 2005, pp. 301-327. doi:10.1111/j.1365-2796.2005.01553.x
- M. Hermanussen and J. A. F. Tresguerres, “Does High Glutamate Intake Cause Obesity?” Journal of Pediatric Endocrinology and Metabolism, Vol. 16, 2003, pp. 965- 968. doi:10.1515/JPEM.2003.16.7.965
- M. Hermanussen, A. P. García, M. Sunder, M. Voigt, V. Salazar and J. A. F. Tresguerres, “Obesity, Voracity, and Short Stature: The Impact of Glutamate on the Regulation of Appetite,” European Journal of Clinical Nutrition, Vol. 60, 2006, pp. 25-31. doi:10.1038/sj.ejcn.1602263
- M. A. Rol de Lama, A. Perez Romero, C. Ariznavarreta, M. Hermanunssen and J. A. F. Tresguerres, “Periodic Growth in Rats,” Annals of Human Biology, Vol. 25, No. 5, 1998, pp. 441-451. doi:10.1080/03014469800006682
- M. W. Schwartz, S. C. Woods, D. Porte Jr., R. J. Seeley and D. G. Baskin, “Central Nervous System Control of Food Intake,” Nature, Vol. 404, 2000, pp. 661-671.
- K. He, L. Zhao, M. L. Daviglus, A. R. Dyer, L. Van Horn, D. Garside, L. Zhu, D. Guo, Y. Wu, B. Zhou and J. Stamler, “Association of Monosodium Glutamate Intake with Overweight in Chinese Adults: The INTERMAP Study,” Obesity, Vol. 16, No. 8, 2008, pp. 1875-1880. doi:10.1038/oby.2008.274
- Z. Shi, N. D. Luscombe-Marsh, G. A. Wittert, B. Yuan, Y. Dai, X. Pan and A. W. Taylor, “Monosodium Glutamate Is Not Associated with Obesity or a Greater Prevalence of Weight Gain over 5 Years: Findings from the Jiangsu Nutrition Study of Chinese Adults,” British Journal of Nutrition, Vol. 7, 2010, pp. 1-7.
- J. I. Elliott, H. Ewchand and D. M. Altmann, “Streptozotocin-Induced Diabetes in Mice Laking Alphabeta T Cells,” Clinical and Experimental Immunology, Vol. 109, No. 1, 1997, pp. 116-120. doi:10.1046/j.1365-2249.1997.4241319.x
- J. A. White, R. J. Hart and J. C.Fry, “An Evaluation of the Waters Pico-Tag System for the Amino-Acid-Analysis of Food Materials,” The Journal Automatic Chemistry, Vol. 8, No. 4, 1986, pp. 170-177. doi:10.1155/S1463924686000330
- S. R. Hagen, B. Frost and J. Augustin, “Precolumn Phenylisothiocyanate Derivatization and Liquid Chromatography of Amino Acids in Food,” Journal Association of Official Analytical Chemistry, Vol. 72, No. 6, 1989, pp. 912-916.
- S. A. Cohen, B. A. Bidlingmeyer and T. L. Tarvin, “PITC Derivatives in Amino Acid Analysis,” Nature, Vol. 320, No. 6064, 1986, pp. 769-770. doi:10.1038/320769a0
- M. M. Bradfordm, “A Rapid and Sensitive Method for Quantification of Microgram Quantities of Protein Utilizing the Principle of Protein-Dye-Binding,” Analytical Biochemistry, Vol. 72, No. 1-2, 1976, pp. 248-254. doi:10.1016/0003-2697(76)90527-3
- J. Schäffer, O. Gallay and R. Ladenstein, “Glutathione Transferase from Bovine Placenta. Preparation, Biochemical Characterization, Crystallization, and Preliminary Crystallographic Analysis of a Neutral Class PI Enzyme,” The Journal of Biological Chemistry, Vol. 263, No. 33, 1988, pp. 17405-17411.
- G. Cohen, D. Dembiec and J. Marcus, “Measurement of Catalase Activity in Tissue Extracts,” Analytical Biochemistry, Vol. 34, No. 1, 1970, pp. 30-38. doi:10.1016/0003-2697(70)90083-7
- B. Tang, Y. Wang and Z. Z. Chen, “Catalytic Spectrofluorimetric Determination of Superoxide Anion Radical and Superoxide Dismutase Activity Using N,N-Dimethylaniline as the Substrate for Horseradish Peroxidase (HRP),” Spectrochimica Acta. Part A, Molecular and Biomolecular Spectroscope, Vol. 58, No. 12, 2002, pp. 2557-2562. doi:10.1016/S1386-1425(02)00007-0
- T. Kondoh and K. Torii, “MSG Intake Suppresses Weight Gain, Fat Deposition, and Plasma Leptin Levels in Male Sprague-Dawley Rats,” Physiology & Behavior, Vol. 95, No. 1-2, 2008, pp. 135-144. doi:10.1016/j.physbeh.2008.05.010
- L. D. Stegink, L. J. Filer Jr. and G. L. Baker, “Plasma Glutamate Concentrations in Adult Subjects Ingesting Monosodium L-Glutamate in Consommé,” The American Journal of Clinical Nutrition, Vol. 42, No. 2, 1985, pp. 220-225.
- L. D. Stegink, L. J. Filer Jr. and G. L. Baker, “Plasma Amino Acid Concentrations in Normal Adults Ingesting Aspartame and Monosodium L-Glutamate as Part of a Soup/Beverage Meal,” Metabolism, Vol. 36, No. 11, 1987, pp. 1073-1079. doi:10.1016/0026-0495(87)90028-X
- P. J. Tsai and P. C. Huang, “Circadian Variations in Plasma and Erythrocyte Glutamate Concentrations in Adult Men Consuming a Diet with and without Added Monosodium Glutamate,” The Journal of Nutrition, Vol. 130, No. 4, 2000, pp. 1002-10044.
- P. J. Reeds, D. G. Burrin and F. Jahoor, “Enteral Glutamate Is Almost Completely Metabolized in First Pass by the Gastrointestinal Tract of Infant Pigs,” The American Journal of Physiology, Vol. 1270, No. 3, 1996, pp. 413- 418.
- D. G. Burrin and B. Stoll, “Metabolic Fate and Function of Dietary Glutamate in the Gut,” The American Journal of Clinical Nutrition, Vol. 90, No. 3, 2009, pp. 850-856. doi:10.3945/ajcn.2009.27462Y
- O. R. Simon and M. E. West, “Unstable Diabetic State Produced by Small Dose Streptozotocin in Rats,” The West Indian Medical Journal, Vol. 42, No. 4, 1992, pp. 146-149.
- K. S. Collison, Z. Maqbool, S. M. Saleh, A. Inglis, N. J. Makhoul, R. Bakheet, M. Al-Johi, R. Al-Rabiah, M. Z. Zaidi and F. A. Al-Mohanna, “Effect of Dietary Monosodium Glutamate on Trans Fat-Induced Nonalcoholic Fatty Liver Disease,” Journal of Lipid Research, Vol. 50, No. 8, 2008, pp. 1521-1537. doi:10.1194/jlr.M800418-JLR200
- G. Marchesini, E. Bugianesi, G. Forlani, F. Cerrelli, M. Lenzi, R. Manini, S. Natale, E. Vanni, N. Villanova, N. Melchionda and M. Rizzetto, “Nonalcoholic Fatty Liver, Steatohepatitis, and the Metabolic Syndrome,” Hepatolology, Vol. 37, No 4, 2003, pp. 917-923. doi:10.1053/jhep.2003.50161
- G. Ozansoy, B. Akin, F. Aktan and C. Karasu, “Short-Term Gemfibrozil Treatment Reverses Lipid Profile and Peroxidation but Does Not Alter Blood Glucose and Tissue Antioxidant Enzymes in Chronically Diabetic Rats,” Molecular and Cellular Biochemistry, Vol. 216, No. 1-2, 2001, pp. 59-63. doi:10.1023/A:1011000327529
- U. Bayraktutan, “Free Radicals, Diabetes and Endothelial Dysfunction,” Diabetes, Obesity and Metababolism, Vol. 4, No. 4, 2002, pp. 224-238. doi:10.1046/j.1463-1326.2002.00184.x
- K. Singh and P. Ahluwalia, “Studies on the Effect of Monosodium Glutamate [MSG] Administration on Some Antioxidant Enzymes in the Arterial Tissue of Adult Male Mice,” Journal of Nutrition Science and Vitaminololy (Tokyo), Vol. 49, No. 2, 2003, pp. 145-148. doi:10.3177/jnsv.49.145
- E. O. Farombi and O. O. Onyema, “Monosodium Glutamate-Induced Oxidative Damage and Genotoxicity in the Rat: Modulatory Role of Vitamin C, Vitamin E and Quercetin,” Human & Experimental Toxicology, Vol. 25, No. 5, 2006, pp. 251-259. doi:10.1191/0960327106ht621oa
- S. K. Jain, “Hyperglycemia Can Cause Membrane Lipid Peroxidation and Osmotic Fragility in Human Red Blood Cells,” The Journal of Biological Chemistry, Vol. 264, No. 35, 1989, pp. 21340-21345.
- K. G. Alberti and P. Z. Zimmet, “Definition, Diagnosis and Classification of Diabetes Mellitus and Its Complications. Part 1: Diagnosis and Classification of Diabetes Mellitus Provisional Report of a WHO Consultation,” Diabetic Medicine, Vol. 15, No. 7, 1998, pp. 539-553. doi:10.1002/(SICI)1096-9136(199807)15:7<539::AID-DIA668>3.0.CO;2-S
- K. C. Tan, I. R. Mackay, P. Z. Zimmet, B. R. Hawkins and K. S. Lam, “Metabolic and Immunologic Features of Chinese Patients with Atypical Diabetes Mellitus,” Diabetes Care, Vol. 23, No. 3, 2000, pp. 335-338. doi:10.2337/diacare.23.3.335
NOTES
*Corresponding author.