Food and Nutrition Sciences
Vol. 3 No. 9 (2012) , Article ID: 22298 , 9 pages DOI:10.4236/fns.2012.39165
Evaluation by ICP-MS of Essential, Nonessential and Toxic Elements in Brazilian Fish and Seafood Samples
![]()
Departamento de Análises Clínicas, Toxicológicas e Bromatológicas, Faculdade de Ciências Farmacêuticas de Ribeirão Preto, Universidade de São Paulo, São Paulo, Brazil.
Email: *denisegrotto@yahoo.com.br
Received July 11th, 2012; revised August 11th, 2012; accepted August 18th, 2012
Keywords: River Fish; Sea Fish; Seafood; Toxic Elements; Essential Elements; Estimated Daily Intake; ICP-MS
ABSTRACT
Fish is considered one of the healthiest foods due to the high levels of several important cardioprotective compounds such as long chain omega-3 polyunsaturated fatty acids and vitamin E. However, due to widespread environmental pollution, high levels of contaminants may also be present in fish and seafood samples, which may counteract the beneficial effects of consumption of this food. With this in mind, the aims of this study were: 1) to examine both toxic and essential chemical elements in seafood and river and sea fish samples sold in different Brazilian regions by inductively coupled plasma mass spectrometer (ICP-MS); 2) to estimate the daily intake of these chemical elements by Brazilians. The toxic elements Ba, Cd, Pb, Sr, V and Sb were found in higher concentrations in seafood than in either sea or river fish, while As concentrations were higher in both seafood and sea fish than in river fish. On the other hand, Hg levels were higher in river and sea fish. Concentrations of the essential chemical elements Co, Mn, Cu, Fe, Mg, Zn and Mo were significantly higher in seafood compared with both sorts of fish except for Se, whose levels were similar in seafood and sea fish. Daily intake of all chemical elements was estimated on the basis of a calculation of the amount of fish consumed by Brazilian households (mean fish and seafood consumption of 11.0 g/person/day). The amount of toxic element in fish and seafood did not represent a risk for the Brazilian people. Moreover, fish and seafood seem to be a good source of selenium.
1. Introduction
Diet quality is very important for promoting health and lowering risk of nutritional-related chronic diseases such as osteoporosis, diabetes and cardiovascular disease [1]. Fish is considered one of the healthiest foods, due to its mainly cardioprotective effects [2]. Most of the benefit is probably related to high levels of long-chain omega-3 polyunsaturated fatty acids (PUFAs), especially eicosapentaenoic acid (EPA) and docosahexaenoic acid (DHA), known for promoting anti-inflammatory effects [3,4]. Fish is also a source of important nutrients besides PUFAs such as vitamin E and essential chemical elements [5,6].
However, due to widespread environmental contamination with possible accumulation of toxic elements in fish samples [7,8] it is also of great importance to consider the risks of fish consumption.
Of the many pollutants found in fish samples, mercury (Hg) is one of the most widely recognized, especially since the 1960’s, when methylmercury was discharged from an industrial plant into Minamata Bay, Japan. Marine life in the surrounding area was contaminated as was the local population, for who fish and seafood are the main source of proteins [7]. Fish contaminated with Hg as a result of gold mining [9] or leaching from naturally contaminated soils in this region [10] are also of great concern in Amazonian rivers. This contamination increases the risks of adverse toxic effects on riparian and indigenous communities who rely on fish as a daily dietary mainstay [11].
Other toxic chemical elements, such as arsenic (As), cadmium (Cd) and lead (Pb), have also been measured in fish and seafood samples in several regions of the world [12-14]. The US Food and Drug Administration [15] has shown that fish and seafood are responsible for 90% of Americans’ total As exposure. Moreover, Tressou, et al., 2004 [16] demonstrated in a probabilistic exposure assessment that seafood may represent from 8% to 25% of the total human dietary intake of Cd.
Despite the conflict between “fish as a source of essential nutrients” and “risk of ingestion of contaminated fish or seafood”, there is a paucity of studies examining toxic and essential chemical elements in samples of seafood and fish sold in Brazil. Therefore, this study aims to evaluate essential, nonessential, and toxic elements in river fish, sea fish and seafood from different Brazilian regions by inductively coupled plasma mass spectrometry (ICPMS). Furthermore, the daily intake of these chemical elements by Brazilians was estimated.
2. Material and Methods
2.1. Chemicals and Instruments
High purity water (Milli-Q system, resistivity 18.2 MΩ·cm−1) was used in all experiments (Millipore RiOsDITM, Bedford, MA, USA). HNO3 was distilled in subboiling stills (Kürner Analysentechnik) before use. Triton® X-100 and tetramethyl ammonium hydroxide (TMAH) 25% (w/v) in water were purchased from Sigma-Aldrich (St. Louis, USA). Before use, all materials used to prepare and store the solution and samples (bottles and Falcon® tubes) were cleaned in an acid bath (10% v/v) HNO3 for 24 h. After this procedure, they were rinsed six times with Milli-Q water and dried in the laminar flow hood. All experiments were carried out in a clean room (class 1000). All the standard solutions for calibration were purchased from PerkinElmer (Shelton, CT, USA).
Essential, nonessential and toxic elements were all determined with an inductively coupled plasma mass spectrometer equipped with a reaction cell (DRC-ICP-MS ELAN DRCII, PerkinElmer, SCIEX, Norwalk, CT, USA) operating with high-purity argon (99.999%, Praxaair, Brazil). The sample introduction system was composed of a quartz cyclonic spray chamber and a Meinhard® nebulizer connected by Tygon® tubes to the peristaltic pump of the ICP-MS. The instrument settings and other operating conditions for analysis were according to Batista and colleagues [17].
2.2. Sample Selection and Chemical Assessment
Samples were collected between 2009-2011 in different regions of Brazil (South, Southeast and Northeast). We selected the fish and seafood most commonly consumed by the Brazilian people. The samples were categorized as 1) river fish (n = 19); 2) sea fish (n = 18); and 3) seafood (n = 14).
River fish samples included eyetail cichlids (Cichla spp.), pacu (Piaractus mesopotamicus), barred sorubim (Pseudoplatystoma fasciatum), tilapia (Oreochromis niloticus), piratinga (Piaractus brachypomus), threespot leporinus (Leporinus friderici), spotted sorubim (Pseudoplatystoma corruscans), gilded catfish (Brachplathystoma flavicans), prochilods nei (Prochilodus spp.), and piraiba (Brachyplathystoma filamentosum). Sea fish samples included tuna (Tunnus spp.—Scombridae), Caribbean red snapper (Lutjanus purpureus), blacktip shark (Carcharrhinus spp.), sardine (Sardinella spp.), angel shark (Squatina squatina), hake (Merluccius spp.), weakfish (Cynoscion spp.) and caitipa mojarra (Diapterus rhombeus). From the seafood group, we selected octopus (Octopus vulgaris), clam (Mytilus galloprovincialis), shrimp (Caridina sp.), squid (Loligo farbesi), and mussel (Mytella guianensis).
For all groups, only the edible parts (muscle) of the samples were used for the analysis. First, about 15 g of each sample was weighed, frozen to –80˚C and freezedried (Liobrás L101, Brazil). Subsequently the samples were weighed again and the percentage of water was calculated. Then, the samples were milled and sieved (406 µm pore size) and then stored in Falcon® tubes in a dry location until analysis.
Chemical elements were determined as follows: samples (75 - 100 mg) were accurately weighed in triplicate and 1 mL of TMAH 50% v/v was added. Samples were homogenized rotationally (Tecnal TE 165, Brazil) for 24 hours. After that the volume was made up to 10 mL with a diluent containing 0.5% v/v HNO3 and 0.01% p/v Triton X-100 [17]. Analytical calibration standards were prepared daily over the range of 0 - 20 ng·g−1 for the trace elements (As, barium (Ba), Cd, Pb, Hg, antimony (Sb), cobalt (Co), manganese (Mn), Se, molybdenum (Mo), strontium (Sr) and vanadium (V) and from 0 - 5000 ng·g−1 for the other elements, Cu, Fe, Mg) and Zn, in the same diluent (0.5% v/v HNO3 and 0.01% p/v Triton X-100). The correlation coefficient for calibration curves was better than 0.9999. In all experiments 10 µg·L−1 of the internal standard Rh was used. As, Ba, Cd, Pb, Hg, Sb, Co, Mn, Se, Fe, Mg, Zn, Cu, Mo, Sr and V detection limits were 0.0023, 0.0060, 0.0021, 0.0076, 0.103, 0.0013, 0.0026, 0.0039, 0.024, 0.571, 0.147, 0.092, 0.019, 0.0051, 0.0042 and 0.181 ng·g−1, respectively.
In order to verify the accuracy of the data, the following reference materials (RMs) were analyzed: 1) Fish Protein DORM-3 from the NRC Institute for National Measurement Standards, Canada; 2) Bovine liver SRM 1577; 3) Bovine muscle SRM 8414; and 4) Whole egg powder SRM 8415, all from the National Institute of Standards and Technology, USA.
2.3. Estimation of Daily Intake
Daily intake (EDI) of chemical elements was estimated on the basis of a survey of the amount of fish consumed by Brazilian households [18] and on the concentration of elements in raw fish. The average percentage of water in the fish and seafood was 74%. Therefore, the EDI was calculated using the formula:
EDI = Ec × M
in which EDI means the estimated daily intake of an element (mg/day/person or µg/day/person); Ec is the element concentration in raw fish and/or seafood; and M is the mass of raw fish and/or seafood consumed daily in Brazil. Risk characterization for toxic elements intake was performed based on toxicological reference values provided by the Joint Expert Committee on Food Additives (JECFA) or European Food Safety Authority (EFSA).
For essential elements the results were compared to the dietary reference intakes (DRIs) from the Food and Nutrition Board of the Institute of Medicine, 1997-2001 [19].
2.4. Statistical Analysis
Data for essential, nonessential and toxic elements were reported as mean dry weight ± standard deviation (SD). Levels of chemical elements in the river fish, sea fish and seafood groups were compared using the Kruskal-Wallis test, followed by Duncan’s post hoc. P values < 0.05 were considered significant. Statistica® 8.0 (Statsoft Software , USA) was used to analyze data.
3. Results and Discussion
Prior to analysis, quality controls were (reference materials) were analyzed and the chemical element levels obtained were very close to the certified reference values (Table 1), ensuring the accuracy of the method used for ordinary sample analysis.
Levels of chemical elements in the samples analyzed in the present study are shown in Tables 2 and 3. The concentrations of the toxic elements Ba, Cd, Pb, Sr, V and Sb were statistically higher in seafood than in either river or sea fish (Table 2). Arsenic levels were higher in seafood and sea fish than in river fish. On the other hand, Hg levels were higher in fish (river and sea) than in marine invertebrates, suggesting that this element bioaccumulates in the food web.
Similarly, the concentrations of essential chemical elements except Se were significantly higher in seafood than in either kind of fish. Se levels in sea fish and sea food were comparable (Table 3).
Furthermore, As is the toxic element with the highest magnitude of concentration in fish, with the other toxic elements listed in descending order: As > Sr > Hg > Ba-V > Pb-Cd > Sb. In seafood, however, this order was different: Sr > As > Ba > Cd > V > Pb > Hg > Sb (Table 2). The same pattern held true for essential elements. In thetissues of both types of fish, the magnitude order of the essential elements was similar (Mg > Zn > Fe > Se > Cu > Mn > Mo > Co) but in seafood it differed somewhat (Mg > Fe > Zn > Cu > Se > Mn > Mo > Co) (Table 3).
Anthropogenic activities have resulted in massive environmental pollution, making both aquatic and terrestrial environments vulnerable to a range of contaminants [20,21]. Several studies have been carried out to determine the distribution of chemical elements in aquatic ecosystems [20-22]. However, there is no consensus among the available studies. This may be due to different habitats, species, growth rates or metal accumulation and detoxification mechanisms [23,24]. Most of the chemical elements evaluated in the present study accumulated more intensely in seafood invertebrates than in fish. The species classified

Table 1. Analytical performance for the determination of essential and non-essential elements in certified reference materials DORM-3 (fish protein), SRM 1577 (bovine liver), SRM 8414 (bovine muscle), and SRM 8415 (whole egg powder) (values are denoted as mean ± SD).
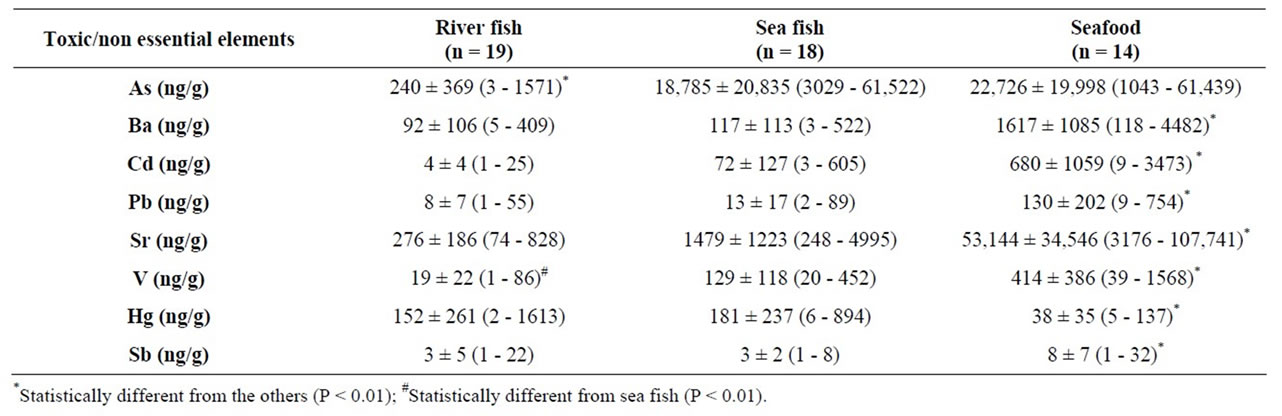
Table 2. Concentrations of nonessential and toxic elements in river fish, sea fish, and seafood from different regions of Brazil, represented by mean ± standard deviation (SD) and range.
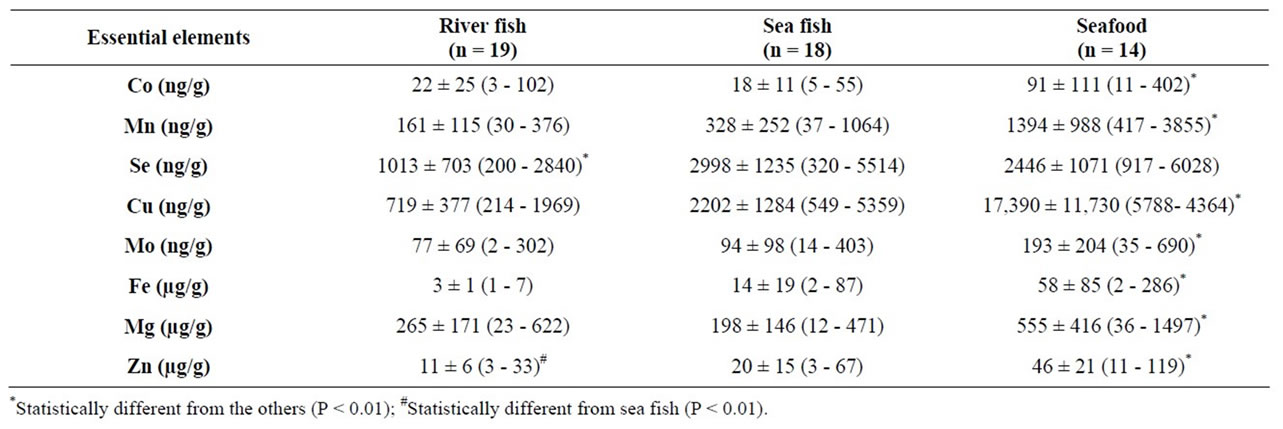
Table 3. Concentrations of essential elements in river fish, sea fish, and seafood from different regions of Brazil, represented by mean ± standard deviation (SD) and range.
as seafood in this study are in general shrimps and mollusks, known to be the scavengers of the sea [25]. Therefore, the higher content of most chemical elements found in seafood may be attributed to the high filtering activity of these animals.
Hg levels in fish (both river and sea) were similar to those presented by Cui and colleagues [22]. The authors showed higher Hg levels moving up the food chain. Hence, the higher Hg levels observed in fish compared to seafood imply that feeding habits may affect Hg accumulation at higher trophic levels [26]. In addition, it is worth pointing out that our study also evaluated fish from the Brazilian Amazon, a region known to be contaminated with Hg [27]. Despite the wide range of Hg levels, our results showed mean levels of 152 ng/g in river fish and 181 ng/g in saltwater fish. The Hg levels found by Burger, et al. [28] sea fish from New Jersey were similar to our outcomes (around 170 ng/g Hg) while Tuzen [29] reported values from 25 to 84 ng/g Hg in sea fish from Turkey. On the other hand, the Hg values (mean of 309 ng/g Hg) in fish from the Savannah River in the southeastern United States were considerably higher than those in our river fish group [30].
Levels of As were significantly higher in sea fish (mean of 18.7 µg/g) and seafood (mean of 22.7 µg/g) than in river fish (mean of 0.24 µg/g) (Table 2). However these concentrations are considerable lower than those recently reported in edible freshwater fish species (41 - 61.5 µg/g) collected from the Ravi River, Pakistan [31]. It must be pointed out that the toxic properties of As are directly related to its chemical form [32]. Although the As levels found in our samples were high, unfortunately they are only total As amounts. Most of this As is in organic form, mainly arsenobetaine or arsenocholine, which are nontoxic forms of this metalloid. The widespread occurrences of Pb and Cd in the environment pose a threat to human health and nowadays there is debate about whether a there is any safe exposure threshold for lead. Storelli, et al. [14] determined Cd and Pb levels in salted anchovies in Italy. They found Cd levels around 225 ng/g while we found sea fish with mean Cd levels of 72 ng/g. They found a mean of 80 ng/g for Pb compared to 13 ng/g in our samples. Storelli showed higher Cd than Pb levels while our data show similar levels in sea fish [14].
In order to determine the concentrations of elements including Ba in the 2006 UK Total Diet Study, a several kinds of food were examined [33]. Their fish samples had a mean Ba level of 140 ng/g, which is very similar to the mean found in the present study for Brazilian river fish samples (mean 92 ng/g Ba) and sea fish samples (mean 117 ng/g Ba). On the other hand, Ba levels in seafood samples in our study were much higher (mean of 1.61 µg/g Ba) which indicates that seafood is an important Ba source for Brazilians.
Levels of strontium (Sr), antimony (Sb) and vanadium (V) in edible fish and seafood have been poorly investigated. The Sb levels we found are in close agreement with those of Rose and colleagues [33], who found a mean of 2.6 ng/g compared to the 3 ng/g observed here (for both river and sea fish). In UK fish, Sr mean levels were 2.5 µg/g [33]. This value was higher than those found in our Brazilian samples: 276 ng/g for river fish and 1.5 µg/g for sea fish. Fish samples from the Adriatic Sea had V levels of around 70 ng/g [34] while the V level in our sea fish sample was 129 ng/g. Antimony, Sr and V were also determined in fish and seafood from the marketplace in France [35]. In fresh fish samples, means were 1.5 ± 2.9 ng/g for Sr, 32 ± 49 ng/g for V, and 1 ng/g for Sb. The same authors found means of 12.6 ± 14.5; 200 ± 252 and 3 ± 2 ng/g for Sr, V and Sb, respectively. In contrast to fish, French seafood Sr and Sb levels were similar to those of the Brazilian samples. However, V levels were lower for French seafood.
The mean levels of the important antioxidant Se in the present study were approximately 1 µg/g and 3 µg/g for river fish and sea fish, respectively (Table 3). These levels may be considered high when compared with those reported in previous studies in other geographic regions. For instance, the mean Se concentration for 19 fish species in New Jersey was 300 ng/g [28]. A Turkish report found a mean Se level of 440 ng/g for ten different Black Sea fish species [29]. Few studies provide Se levels in river fish samples and the values are in general lower than those found in the present study. This variability may be due to different species, ages and also different study locations. Cobalt (Co) is an essential trace element whose main source for humans is beef [36]. Co levels ranged from 3 to 402 ng/g (dry weight) in the three groups of food samples analyzed in this study. Other studies have also shown low Co levels in fish. Mean Co levels of 10 ± 20 ng/g (dry weight) for edible marine fishes, and 10 ± 20 ng/g (dry weight) for mollusks were reported in marine fish and mollusks from the Lakshadweep Archipelago in the Arabian Sea [37]. Both values were lower than those found in this study with Brazilian samples: 18 ± 11 ng/g for sea fish and 91 ± 111 for seafood. The mean levels of Co in French fish and seafood samples, however, were 5 ± 7 ng/g (fresh mass) and 67 ± 104 ng/g (fresh mass), respectively [35]. These values are in close agreement with our findings. Conversely, the Co levels of three commercial sea fish from Turkey northeast Mediterranean Sea) were much higher than our results: around 1500 ng/g (ranging from 30 to 5610 ng/g (dry weight) [38].
Copper levels in Brazilian fish samples varied from 214 to 5359 ng/g (for both river and sea fish) (Table 3). Our findings are in close agreement with Storelli [39] and Ersoy and Çelik [40]. These authors found mean levels of 1.35 ± 0.57 µg/g in fish samples from the Mediterranean Sea [41], and from 1.06 to 2.09 mg/kg in fish from the eastern Mediterranean in Turkey [39]. The mean values for sea fish samples were 2202 ± 1284 ng/g. The copper level in Brazilian seafood samples were 17,390 ± 11,730 ng/g. These values are in agreement with those reported for the same samples in Poland (Cu range: 0.1 - 18.4 mg/kg) [41].
Our values for the essential element Mn are in close agreement with those found in other geographic regions [40]. For fish samples from the eastern Mediterranean Sea, Mn values ranged from 0.11 to 0.64 µg/g [40], while our mean sea fish Mn levels were 328 ± 252 ng/g. On the other hand, Mn levels are considerably lower in Brazilian than in Polish seafood (417 - 3855 ng/g against 0.1 - 40 µg/g in Poland [41]).
The Mg levels of both sorts of Brazilian fish in our study were very comparable while seafood presented somewhat higher Mg concentrations (Table 3). In agreement with our findings, Mg levels varied from 94.1 to 210 mg/kg (wet weight) in Turkish fish [40], and from 52.6 - 532 mg/kg (wet weight) in Polish seafood [41].
It is interesting that of the chemical elements evaluated here, Mg, Fe and Zn were found most abundantly in both Brazilian fish and seafood samples. Moreover, Fe and Zn levels were higher in seafood than in fish (Table 3). Fe levels varied from 0.4 to 26.1 µg/g (wet weight) and Zn levels varied from 0.06 to 39.3 µg/g (wet weight) in marine fish samples from Rio de Janeiro State, Brazil [42]. Likewise, in French fish samples, mean Fe and Zn concentrations were, respectively, 4.42 ± 4.51 and 5.43 ± 4.85 µg/g (fresh weight) [35]. Finally, seafood from France had about twice the levels found in this study for Fe and Zn.
Furthermore, the Zn concentrations found in the present study are comparable to those found in a previous study of samples collected in Italian markets. Although these researchers measured Zn levels in fresh samples, mean Zn levels in fish (8.43 mg/kg) and in seafood, or more specifically, mollusks (33 mg/kg) [39], were very similar to our values (Table 2).
Little is known about the levels of molybdenum (Mo), another essential element, in edible fish and seafood. We found higher levels of Mo in seafood (mean of 193 ± 204 ng/g) than in river or sea fish samples (mean of 77 ± 69 and 94 ± 98 ng/g). In comparison, fish and seafood from French markets had Mo means of 13 ± 14 ng/g and 123 ± 106 ng/g, respectively [35].
The mean consumption of fish and seafood in Brazil is 11.0 g/person/day. However, consumption varies considerably from region to region. For instance, people in the North and Northeast consume 48 and 14 g/person/day, respectively, while in the South the consumption is only 4 g/person/day [18]. Seafood and fish are important sources of proteins for many people. Therefore estimating the daily intake (EDI) of essential and toxic elements from the ingestion of this food is fundamental to evaluate risk.
Table 4 shows Brazilian EDI for toxic, essential and nonessential elements based on the mean 11 g/person/day.
EDI for Cd and Pb in both types of fish and seafood were 0.91 and 0.18 µg·day–1, respectively. These values are relatively low. For example, based on a consumption of 20 g/person/day, Turkish EDI levels for Cd and Pb were 1.7 and 4.4 µg·day–1, respectively [40] and for Spanish men and women As, Cd, Hg and Pb EDIs were 195, 1.1, 9.4 and 2.1 µg·day–1, respectively [43]. From this it is clear that the Spanish fishand seafood-based EDI for As and Hg are around 4 and 20 times higher than the estimated values for Brazilians. Nevertheless, despite none of them exceeded the limits established by JECFA/FAO to methylmercury [44], or to arsenic [45], it is important to keep in mind the power of bioaccumulation of some elements, such Hg, whose chronic exposure could represent a risk for Brazilians [27]. And although the considerable As daily intake for Brazilians, it must be considered that commonly the least toxic As form—arsenobetaine—is present in fish and seafood [46].
Regarding essential elements fish and seafood contributed moderately to the dietary reference intake (DRI) for Se (>14%) and Cu (3.5%). For the other elements (Mn, Fe, Mg, Zn and Mo) the contribution to the DRI is lower than 1.2% (Table 4). However, considering the highest Brazilian fish/seafood consumption (48 g/person/day), these sorts of food represent a source of Se and Cu (61 and 15%, respectively). On the other hand, Northern people also intake more levels of toxic elements, although none of them, except As, exceeded the toxicological reference values.
Thus, considering Brazilians’ moderate fish and seafood consumption, the present study sheds new light on the occurrence of essential, nonessential and toxic elements in river and sea fish and seafood from different Brazilian regions. There was a significant difference between chemical element concentrations in fish and in seafood samples, with a predominance and higher accumulation in seafood samples.
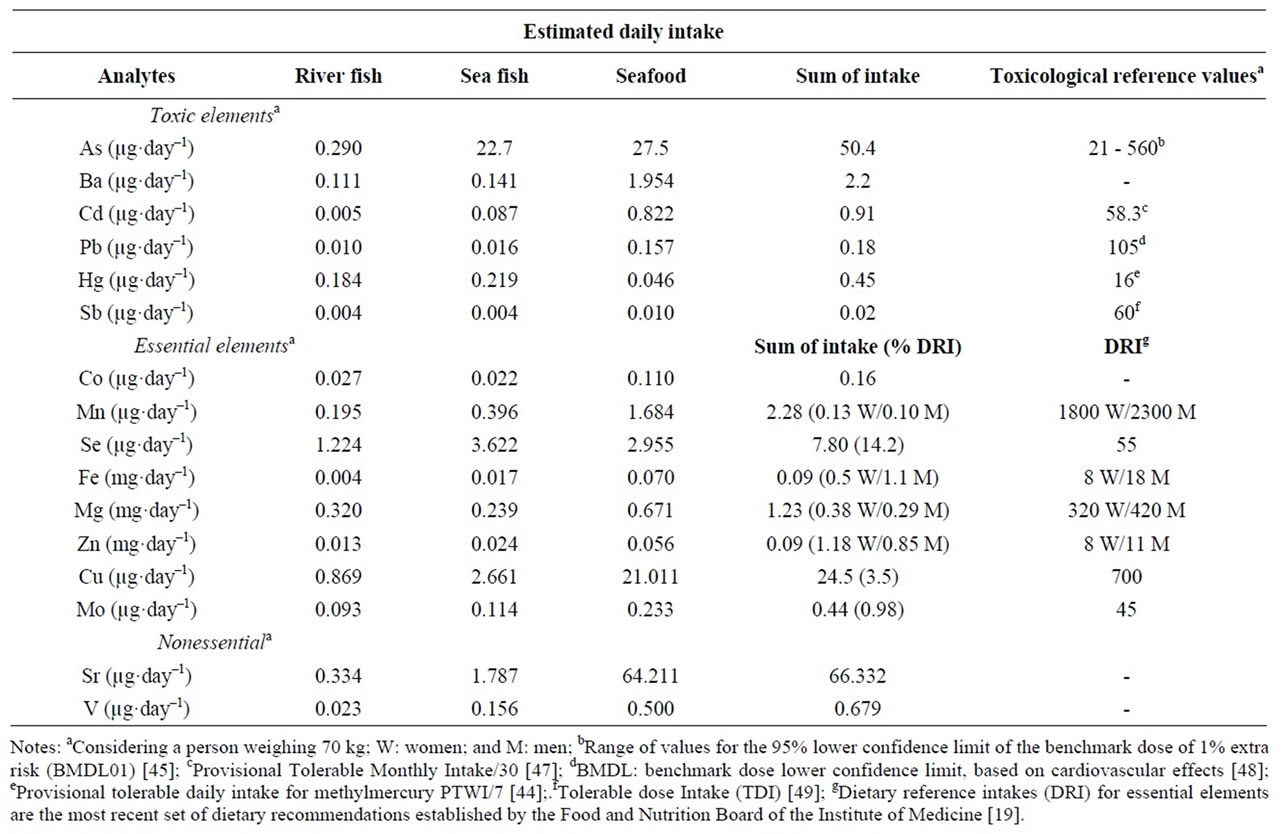
Table 4. Estimated daily intake of toxic, essential and nonessential and considerations regarding the potential health risk through consumption of in nature fishes (sea and river) and seafood by Brazilians.
Finally, the estimated daily intake for toxic elements shows that fish and seafood consumption apparently do not represent a risk for Brazilians. Nonetheless since there are evidences for bioaccumulation for some toxic chemical elements such as Hg and As, data have to be interpreted cautiously, even with low intake of these elements. Moreover, fishes and seafood are an interesting source of the essential element Se for Brazilians. However, due to different dietary habits, Brazilian regions differ considerably regarding fish and seafood consumption, especially North and South. Thus, specific analysis of population sub-groups is essential to acquire more precise toxicological risk data.
4. Acknowledgements
The authors would like to acknowledge the financial support of the São Paulo State Foundation for Scientific Research (FAPESP, Brazil) and thank the Brazilian National Council for Scientific and Technological Development (CNPq) and the Foundation for the Coordination of Improvement of Higher Education Personnel (CAPES) for fellowships.
REFERENCES
- “Dietary Guidelines for Americans.” US Department of Agriculture, US Department of Health and Human Services, 2010.
- H. O. Bang, J. Dyerberg and H. M. Sinclair, “The Composition of the Eskimo Food in Northwestern Greenland,” The American Journal of Clinical Nutrition, Vol. 33, 1980, pp. 2657-2661.
- D. N. Carroll and M. T. Roth, “Evidence for the CardioProtective Effects of Omega-3 Fatty Acids,” The Annals of Pharmacotherapy, Vol. 36, 2002, pp. 1950-1956. doi:10.1345/aph.1A314
- A. P. Simopoulos, “Omega-3 Fatty Acids in Inflammation and Autoimmune Diseases,” Journal of the American College of Nutrition, Vol. 21, No. 6, 2002, pp. 495-505.
- C. Afonso, H. M. Lourenço, C. Pereira, M. F. Martins, M. L. Carvalho, M. Castro and M. L. Nunes, “Total and Organic Mercury, Selenium and a-Tocopherol in Some Deep-Water Fish Species,” Journal of the Science of Food and Agriculture, Vol. 88, 2008, pp. 2543-2550. doi:10.1002/jsfa.3379
- S. Serini, E. Piccioni, C. Rinaldi, D. Mostra, G. Damiani and G. Calviello, “Fish from an Artificial Lake: n-3 PUFA Content and Chemical-Physical and Ecological Features of the Lake,” Journal of Food Composition and Analyses, Vol. 23, 2010, pp. 133-141. doi:10.1016/j.jfca.2009.08.010
- M. Harada, “Minamata Disease: Methylmercury Poisoning in Japan Caused by Environmental Pollution,” Critical Reviews in Toxicology, Vol. 25, No. 1, 1995, pp. 1-24. doi:10.3109/10408449509089885
- C. R. Estrellan and F. Iino, “Toxic Emissions from Open Burning,” Chemosphere, Vol. 80, 2010, pp. 193-207. doi:10.1016/j.chemosphere.2010.03.057
- O. Malm, W. C. Pfeiffer, C. M. M. Souza and R. Reuther, “Mercury Pollution Due to Gold Mining in the Madeira River Basin, Brazil,” Ambio, Vol. 19, 1990, pp. 11-15.
- M. Roulet and M. Lucotte, “Geochemistry of Mercury in Pristine and Flooded Ferralitic Soils of a Tropical Rain Forest in French Guiana, South America,” Water, Air and Soil Pollution, Vol. 80, 1995, pp. 1079-1088. doi:10.1007/BF01189768
- C. J. S. Passos, D. Mergler, M. Lemire, M. Fillion and J. R. D. Guimarães, “Fish Consumption and Bioindicators of Inorganic Mercury Exposure,” The Science of the total Environmental, Vol. 373, 2007, pp. 68-76. doi:10.1016/j.scitotenv.2006.11.015
- X. Liao, T. B. Chen, H. Xie and Y. R. Liu, “Soil as Contamination and Its Risk Assessment in Areas near the Industrial Districts of Chenzhou City, Southern China,” Environment International, Vol. 31, 2005, pp. 791-798. doi:10.1016/j.envint.2005.05.030
- A. Gupta, D. K. Rai, R. S. Pandey and B. Sharma, “Analysis of Some Heavy Metals in the Riverine Water, Sediments and Fish from River Ganges at Allahabad,” Environmental Monitoring and Assessment, Vol. 157, 2009, pp. 449-458. doi:10.1007/s10661-008-0547-4
- M. M. Storelli, L. Giachi, D. Giungato and A. Storelli, “Occurrence of Heavy Metals (Hg, Cd, and Pb) and Polychlorinated Biphenyls in Salted Anchovies,” Journal of Food Protection, Vol. 74, No. 5, 2011, pp. 796-800. doi:10.4315/0362-028X.JFP-10-453
- United States Food and Drug Administration, “Guidance Document for Arsenic in Shellfish,” Washington DC: US Food and Drug Administration, 1993, pp. 25-27.
- J. Tressou, A. Crépet, P. Bertail, M. H. Feinberg and J. Ch. Leblanc, “Probabilistic Exposure Assessment to Food Chemicals Based on Extreme Value Theory. Application to Heavy Metals from Fish and Sea Products,” Food and Chemical Toxicology, Vol. 42, No. 8, 2004, pp. 1349- 1358. doi:10.1016/j.fct.2004.03.016
- B. L. Batista, D. Grotto, J. L. Rodrigues, V. C. O. Souza and F. Barbosa, “Determination of Trace Elements in Biological Samples by Inductively Coupled Plasma Mass Spectrometry with Tetramethylammonium Hydroxide Solubilization at Room Temperature,” Analytical Chimica Acta, Vol. 646, No. 1-2, 2009, pp. 23-29. doi:10.1016/j.aca.2009.05.022
- Instituto Brasileiro de Geografia e Estatística—IBGE, “Aquisição Alimentar Domiciliar per Capita Anual, por Grandes Regiões, Segundo os Produtos, Período 2008- 2009,” Brasilia, 2010.
- Institute of Medicine—IOM, “Dietary Reference Intakes for Vitamin A, Vitamin K, Arsenic, Boron, Chromium, Copper, Iodine, Manganese, Molybdenum, Nickel, Silicon, Vanadium and Zinc,” National Academy Press, Washington DC, 2002.
- P. B. P. Kfouri, R. C. L. Figueira, A. M. G. Figueiredo, S. H. M. Souza and B. B. Eichler, “Metal Levels and Foraminifera Occurrence in Sediment Cores from Guanabara Bay, Rio de Janeiro, Brazil,” Journal of Radioanalytical and Nucelar Chemistry, Vol. 265, No. 3, 2005, pp. 459- 466. doi:10.1007/s10967-005-0849-8
- M. Longjiang, F. Qiang, M. Duowen, H. Ke and Y. Jinghong, “Contamination Assessment of Heavy Metal in Surface Sediments of the Wuding River, Northern China,” Journal of Radioanalytical and Nucelar Chemistry, Vol. 290, No. 2, 2001, pp. 409-414. doi:10.1007/s10967-011-1227-3
- B. Cui, Q. Zhang, K. Zhang, X. Liu and H. Zhang, “Analyzing Trophic Transfer of Heavy Metals for Food Webs in the Newly-Formed Wetlands of the Yellow River Delta, China,” Environmental Pollution, Vol. 159, No. 5, 2011, pp. 1297-306. doi:10.1016/j.envpol.2011.01.024
- L. Marin-Guirao, J. Llotet and A. Marin, “Carbon and Nitrogen Stable Isotopes and Metal Concentration in Food Webs from a Mining-Impacted Coastal Lagoon,” The Science of the Total Environmental, Vol. 393, 2008, pp. 118-130. doi:10.1016/j.scitotenv.2007.12.023
- V. Laura, “Metallothioneins in Aquatic Organisms: Fish, Crustaceans, Molluscs, and Echinoderms,” Metal Ions in Life Sciences, Vol. 5, 2009, pp. 99-237.
- S. A. Oustromov, “Some Aspects of Water Filtering Activity of Filter-Feeders,” Hydrobiologia, Vol. 542, No. 1, 2005, pp. 275-286. doi:10.1007/s10750-004-1875-1
- Z. S. Zhang, X. G. Lu, Q. C. Wang and D. M. Zheng, “Mercury, Cadmium and Lead Biogeochemistry in the Soil-Plant-Insect System in Huludao City,” Bulletin of Environmental Contamination and Toxicology, Vol. 83, 2009, pp. 255-259. doi:10.1007/s00128-009-9688-6
- D. Grotto, J. Valentini, M. Fillion, C. J. S. Passos, S. C. Garcia, D. Mergler and F. Barbosa Jr., “Mercury Exposure and Oxidative Stress in Communities of the Brazilian Amazon,” The Science of the Total Environmental, Vol. 408, 2010, pp. 806-811. doi:10.1016/j.scitotenv.2009.10.053
- J. Burger, C. Jeitner and M. Gochfeld, “Locational Differences in Mercury and Selenium Levels in 19 Species of Saltwater Fish from New Jersey,” Journal of Toxicology and Environmental Health A, Vol. 74, No. 13, 2011, pp. 863-874. doi:10.1080/15287394.2011.570231
- M. Tuzen, “Toxic and Essential Trace Elemental Contents in Fish Species from the Black Sea, Turkey,” Food and Chemical Toxicology, Vol. 47, 2009, pp. 1785-1790. doi:10.1016/j.fct.2009.04.029
- J. Burger, K. F. Gaines, C. S. Boring, W. L. Stephens Jr., J. Snodgrass and M. Gochfeld, “Mercury and Selenium in Fish from the Savannah River: Species, Trophic Level, and Locational Differences,” Environmental Research, Vol. 87, No. 2, 2001, pp. 108-118. doi:10.1006/enrs.2001.4294
- S. Nawaz, S. A. Nagra, Y. Saleem and A. Priydarshi, “Determination of Heavy Metals in Fresh Water Fish Species of the River Ravi, Pakistan Compared to Farmed Fish Varieties,” Environment Monitoring and Assessment, Vol. 167, 2010, pp. 461-471. doi:10.1007/s10661-009-1064-9
- National Research Council, US—NRC, “Arsenic in Drinking Water: 2001 Update. Subcommittee on Arsenic in Drinking Water,” National Academies Press, Washington DC, 2001, 225 p.
- M. Rose, M. Baxter, N. Brereton and C. Baskaran, “Dietary Exposure to Metals and Other Elements in the 2006 UK Total Diet Study and Some Trends over the Last 30 Years,” Food Additives and Contaminants Part A, Vol. 27, No. 10, 2010, pp. 1380-1404. doi:10.1080/19440049.2010.496794
- A. Sepe, L. Ciaralli, M. Ciprotti, R. Giordano, E. Funari and S. Costantini, “Determination of Cadmium, Chromium, Lead and Vanadium in Six Fish Species from the Adriatic Sea,” Food Additives and Contaminants Part A, Vol. 20, No. 6, 2003, pp. 543-552. doi:10.1080/0265203031000069797
- T. Guérin, R. Chekri, C. Vastel, V. Sirot, J. C. Volatier, J. C. Leblanc and L. Noël, “Determination of 20 Trace Elements in Fish and Other Seafood from the French Market,” Food Chemistry, Vol. 127, 2011, pp. 934-942. doi:10.1016/j.foodchem.2011.01.061
- United States Department of Agriculture—USDA—Nutrient Data Laboratory, 2011. http://www.ars.usda.gov/services/docs.htm?docid=9673
- K. V. Dhaneesh, M. Gopi, R. Ganeshamurthy, T. T. A. Kumar and T. Balasubramanian, “Bio-Accumulation of Metals on Reef Associated Organisms of Lakshadweep Archipelago,” Food Chemistry, Vol. 131, No. 3, 2011, pp. 985-991. doi:10.1016/j.foodchem.2011.09.097
- A. Türkmen, M. Türkmen, Y. Tepe and I. Akyurt, “Heavy Metals in Three Commercially Valuable Fish Species from Iskenderun Bay, Northern East Mediterranean Sea, Turkey,” Food Chemistry, Vol. 91, 2005, pp. 167-172. doi:10.1016/j.foodchem.2004.08.008
- M. M. Storelli, “Intake of Essential Minerals and Metals via Consumption of Seafood from the Mediterranean Sea,” Journal of Food Protection, Vol. 72, No. 5, 2009, pp. 1116-1120.
- B. Ersoy and M. Celik, “The Essential and Toxic Elements in Tissues of Six Commercial Demersal Fish from Eastern Mediterranean Sea,” Food and Chemical Toxicology, Vol. 48, No. 5, 2010, pp. 1377-1382. doi:10.1016/j.fct.2010.03.004
- M. Kwoczek, P. Szefer, E. Hać and M. Grembecka, “Essential and Toxic Elements in Seafood Available in Poland from Different Geographical Regions,” Journal of Agricultural and Food Chemistry, Vol. 54, No. 8, 2006, pp. 3015-3024. doi:10.1021/jf0600511
- R. J. Medeiros, L. M. dos Santos, A. S. Freire, R. E. Santelli, A. M. C. B. Braga, T. M. Krauss and S. C. Jacob, “Determination of Inorganic Trace Elements in Edible Marine Fish from Rio de Janeiro State, Brazil,” Food Control, Vol. 23, 2012, pp. 535-541. doi:10.1016/j.foodcont.2011.08.027
- G. Falcó, J. M. Llobet, A. Bocio and J. L. Domingo, “Daily Intake of Arsenic, Cadmium, Mercury, and Lead by Consumption of Edible Marine Species,” Journal of Agricultural and Food Chemistry, Vol. 54, 2006, pp. 6106-6112. doi:10.1021/jf0610110
- JECFA—Joint FAO/WHO Expert Committee on Food Additives, 61st Meeting, Rome, 2003.
- EFSA—European Food Safety Authority Panel on Contaminants in the Food Chain (CONTAM) “Scientific Opinion on Arsenic in Food,” EFSA Journal Vol. 7, No. 10, 2009, p. 1351.
- Y. Shibata, M. Morita and K. Fuwa, “Selenium and Arsenic in Biology: Their Chemical Forms and Biological Functions,” Advances in Biophysics, Vol. 28, 1992, pp. 31-80. doi:10.1016/0065-227X(92)90022-J
- JECFA—Joint FAO/WHO Expert Committee on Food Additives, 73rd Meeting, Geneva, 2010.
- EFSA—European Food Safety Authority Panel on Contaminants in the Food Chain (CONTAM), “Scientific Opinion on Lead in Food,” EFSA Journal, Vol. 8, No. 4, 2010, p. 1570.
- World Health Organization—WHO, “Antimony in Drinking Water”, Background Document for Preparation of WHO Guidelines for Drinking Water Quality (WHO/ SDEWSH/03.04/74), Geneva, 2003.
NOTES
*Corresponding author.