Food and Nutrition Sciences
Vol. 3 No. 6 (2012) , Article ID: 19925 , 6 pages DOI:10.4236/fns.2012.36105
Nutrient and Anti-Nutrient Content of Soy-Enriched Tapioca
![]()
1Department of Human Nutrition, University of Ibadan, Ibadan, Nigeria; 2Department of Food Science and Technology, Bowen University, Iwo, Nigeria.
Email: samuelfolake@yahoo.co.uk, botegbayo@cgiar.org
Received March 28th, 2012; revised April 16th, 2012; accepted April 18th, 2012
Keywords: Soybean; Cassava; Tapioca; Anti-Nutrients
ABSTRACT
Tapioca is a cassava-based food product made in the form of irregular lumps of partly gelatinized starch grits. Tapioca was enriched with varying proportions of soybean flour (0, 85% - 15%, 75% - 25%, 50% - 50%) to produce Soy-tapioca (ST). Nutrient and anti-nutrient composition of ST were determined by standard methods, while sensory evaluation was also carried out. Results showed significant increase in protein, fat and mineral contents of tapioca as the level of soy-substitution increased. There was a decrease in the cyanogenic potential and an increase in the level of trypsin inhibitor as soy-substitution increased. Tannin, phytic acid and oxalate contents of the soy-tapioca samples were below minimum levels of safety. ST (50% - 50%) was more nutrient dense than the other products, but ST (85% - 15%) was more accepted in terms of colour, taste and texture. ST suggests a safe, nutritious and acceptable food product that can enhance food and nutrition security among cassava consuming populations.
1. Introduction
Cassava (Manihot esculanta Crantz) is a major staple in Nigeria. It is popularly consumed in various forms including gari, fufu and lafun and tapioca [1]. The cassava root is energy-dense, containing 80% to 90% carbohydrate on a dry weight basis [2] and is a predominantly starchy food [3]. Grown in more than 90 countries, it ranks as the 6th most important source of energy in human diets on a worldwide basis and as the 4th supplier of energy after rice, sugar, and corn/maize [4]. However, it is low in protein, at 1% to 3% on a dry matter basis [5]. Cassava has the lowest protein:energy ratio of any staple crop; the protein content among common cassava cultivars is typically only 1% [6]. This is of nutritional importance for populations that depend largely on cassava products for their energy needs. An observational study in Kenya and Nigeria [7] showed that consuming cassava as a staple food placed children 2 - 5 years old at risk for inadequate protein intake. In addition cassava contains toxic substances such as cyanide and antinutrients, such as phytate, fiber, nitrate, polyphenols, oxalate, and saponins that can reduce nutrient bioavailability [2,8]. Hence, improving the nutritional value of cassava food products becomes a necessary intervention in such areas.
Tapioca is a cassava based food product in the form of irregular lumps of partly gelatinized starch [9]. It came into existence in the Southern part of Nigeria during the 20th century mostly among the inhabitants of Lagos and its environs [10]. Nigerian scientists have therefore investigated several ways of enriching cassava products by fortifying with protein rich legumes, chief of which are soybeans. For instance, soybeans have been used to fortify “gari” [11-13] and “Lafun” [14]; both being widely consumed cassava products. Previous studies have described attempts to improve the nutritional quality of Tapioca using soybeans [15-17], including in vivo studies [18,19] Soybeans (Glycine max) contain a reasonable amount of protein, minerals, vitamins and even phytochemicals such as isoflavones which are lacking in the cassava root. Tapioca can therefore be fortified with soy to improve its nutritional quality. Nevertheless, it has been long established that despite its high nutritional qualities, soybean contains some non-toxic biologically active substances which may inhibit the availability of desired substances or reduce the nutritional value of soybean if not removed [20]. These include the trypsin inhibitors, hemaglutinnin, goitrogens, urease tannin and phytic acid. This study therefore determined the nutrient and anti-nutrient contents, as well as acceptability of the Tapioca enriched with soy at varying levels of substitution.
2. Materials and Methods
2.1. Procurement of Materials
The main raw materials used in this project are the cassava roots and soybean seeds. Fresh cassava roots as well as soybean seeds were obtained from Odo-ori market, Iwo, Osun State, Southwestern Nigeria.
2.2. Production of Cassava Starch and Tapioca
Fresh cassava roots were peeled to remove the woody bark. The peeled roots were washed with clean water to remove dirt and all foreign material. The washed roots were grated with a mechanical grater to reduce particle size and to facilitate hydrolysis of cyanogens. The grated cassava was sieved with a muslin cloth under water to separate the slurry according to particle size, leaving starch and water as the filtrate, and shaft as the residue. The extracted starch was allowed to settle at the base of the container and water decanted off. The extracted starch was washed several times with water, to remove fibrous materials and to obtain a pure and high quality starch. The extracted starch was then dewatered and partially dried at room temperature by spreading in a tray. Tapioca was processed by roasting the damp cassava starch obtained. The damp starch was granulated with the use of a sieve spread in a pan, and roasted to form a coarse granulated product in the form of lumps of partly gelatinized starch.
2.3. Production of Soy Flour (Full-Fat)
Soybean seeds were cleaned to remove all dirt, bad seeds and foreign material, and then weighed. The soybean seeds were then soaked in water for about 18 hours to soften the hulls before dehulling. The soybean seeds were then dehulled and cooked for 20 minutes to remove the anti-trypsin inhibitors. The cooked soybean was then dried in an oven (Gallenkamp Hotbox Oven, size 2, Gallenkamp, UK) at 60˚C for 72 hours. The dried and dehulled soybean seeds were then milled into flour with a hammer mill.
2.4. Production of Soy Tapioca
Soy tapioca was produced by the incorporation of full-fat soy flour into the damp starch just before roasting in the pan.
Different mixing percentages were used in the production of soy tapioca, as shown below:
Sample A—100% Tapioca, 0% Full-fat soy flour.
Sample B—85% Cassava starch, 15% Full-fat soy flour.
Sample C—75% Cassava starch, 25% Full-fat soy flour.
Sample D—50% Cassava starch, 50% Full-fat soy flour.
2.5. Proximate Analysis
All samples were milled to pass through a mesh of 250 mm and packed in zip-lock bags and kept in a dessicator at room temperature prior to analyses. All analyses were carried out in triplicates. Proximate analysis (moisture, crude protein, fat, fibre, and ash) was carried out on the samples as described by the Association of Official Analytical Chemists [21]. Carbohydrate was calculated by difference. Gross energy was determined using a Gallenkamp Bomb Calorimeter (Model Ce1305 ASDA).
2.6. Mineral Analysis
Potassium, sodium and calcium were determined using the nitric-perchloric acid mixture digested-ash and readings taken with the Jenway Flame Photometer (Model PFP7, Essex, UK). Phosphorus was determined by the vanado-molybdate spectrophometric method; the absorbance was read at 410 nm.
2.7. Anti-Nutritional Properties
Cyanogenic potential of samples was determined as described by Bradbury et al. [22], while the Trypsin Inhibitor Activity was determined using the casein digestion method [23,24]). Phytic acid was extracted and precipitated [25], iron in the precipitate was measured [26] while a 4:6 Fe/P atomic ratio was used to calculate the phytic acid content. Tannin was determined spectrophotometrically by the acidified vanillin method as modified by Chang et al., [27] using catechin as the tannin standard. Oxalate was determined by the titrimetric method of AOAC [28] using KMnO4. The heavy metals in the acidified extract were precipitated using tungstophosphoric acid reagent.
2.8. Sensory Evaluation
Sensory Evaluation was conducted on the soy tapioca granules and pastes. A descriptive evaluation (using the scoring method) was done to determine the textural quality (smoothness, hardness and particle size), of the soytapioca paste by seven trained panelists comprising students of Department of Food Science and Technology, Bowen University, Iwo. The panelists were selected on the basis of their motivation, interest and availability. They were familiar with Tapioca and were trained to enhance their sensitivity, discriminating and descriptive ability. An acceptability test (preference) was also conducted using 1 - 7 hedonic scale where 1 represents like extremely and 7 represents dislike extremely on the samples. Sensory quality parameters evaluated include: colour, texture taste, aroma and general acceptability.
2.9. Statistical Analysis
The data generated from all analyses and from sensory evaluation and all analyses were subjected to statistical analysis of variance (ANOVA) followed by Turkey’s test to determine differences in samples where necessary. The data obtained from chemical analysis of samples were subjected to one way analysis of variance (ANOVA).
3. Results and Discussion
3.1. Nutrient Analyses
The results of chemical analysis of tapioca samples are as shown in Table 1. Sample D had the highest percentage crude protein content (19.19%) while sample A had the least (0.52%). The varying crude protein content of soysubstituted tapioca samples is as a result of the use of varying amounts of soy flour in its formulation. Soy flour is a rich source of protein. The low protein content of sample A can be attributed to the low protein content of cassava starch. From the results, it can be seen that the higher the level of substitution, the higher the protein content.
The mean percentage crude fat levels ranged from 0.15 to 13.74% with significant difference (p < 0.05) between the samples. The fat level was low in sample A but higher in fortified samples, with sample D having the highest percentage crude fat content. Sample D is therefore prone to rancidity during storage because of its high fat content. Sample A, B and C had lower percentage crude fat levels, and may therefore be less prone to rancidity during storage.
There was no significant difference (p > 0.05) between the samples in terms of their crude fiber content, which ranged from 0.01% to 1.805%. However, sample D had the highest crude fiber content with sample A having the lowest (0.06%).
The mean ash contents of samples ranged from 0.92 to 2.085% with sample D having the highest percentage ash content. Statistical analysis showed significant differences (p < 0.05) between samples. High ash contents indicates high mineral content, therefore sample D would have the highest mineral content. Sample D had the highest dry matter content (91.30%) with mean values of dry matter for samples ranging from 88.15% to 91.30%. There was significant difference between samples (P < 0.05). The high dry matter content of soy fortified tapioca is derives from the soy protein, which possesses a high water absorption capacity [29]. Thus, addition of soybean flour would have a positive effect in extending the shelf-life of tapioca samples as the low percentage of dry matter in pure tapioca increases liability to microbial spoilage.
The mean gross energy values of samples ranged from 3.687 to 4.728 kcal/g with significant differences (p < 0.05) between the samples. Sample A had the lowest gross energy value compared with fortified samples B, C and D. The fortified samples would therefore yield more energy per gram of the sample consumed. The total carbohydrate content of samples ranged from a mean value of 65.15% to 95.58% with significant differences between samples (p < 0.05). Sample A contained the highest per-centage of carbohydrate compared to the soy fortified samples; this is expected because sample A is mainly starch.
The results of mineral analysis of samples are as shown in Table 2. The mean values estimated for all minerals showed significant difference (p < 0.05) between samples. The mean values for sodium ranged from 4.5 to 13.35 mg/100g, potassium ranged from 23.35 to 624.45 mg/100g, calcium ranged from 8.9 to 61.35 mg/100g and phosphorus ranged from 33.35 to 142.60 mg/100g. The fortified samples are better sources of minerals compared to the unfortified sample. The high level of calcium in enhanced samples would promote good bone and tooth health for adults and children who consume them. Phosphorus in fortified samples is important in preventing bone loss, decreased growth and poor tooth development, while sodium and potassium is important in the regulation of body fluids.
3.2. Anti-Nutritional Properties
The anti-nutritional composition of tapioca samples is as shown in Table 3. Significant differences (p < 0.05) exist between all samples in terms of their anti-nutritional
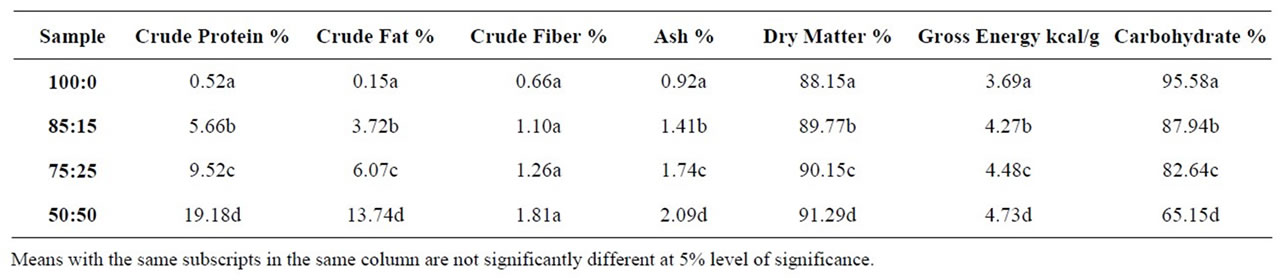
Table 1. Proximate composition of tapioca samples.
components. The mean values for Trypsin Inhibitor Units (TIU) ranged from 0.00 to 2.11 mg/protein.
Tannin content values ranged from 0.01% to 0.09%. Phytic acid values ranged from 0.17% to 0.76% and oxalate from 0.6% to 0.9%. Mean values for HCN ranged from 3.14 to 6.54 mg/kg. Tannins form complex with protein and thus precipitate proteins in the gut thereby reducing its digestibility, they can cause an astringent reaction in the mouth and make food unpalatable. Tannins can also interfere with dietary iron absorption [30]. The presence of high levels trypsin inhibitor in the samples can lead to the formation of a trypsin inhibitor complex, which can cause a drop in trypsin in the intestine and protein digestibility after consumption. Oxalates form complexes with calcium, magnesium and iron leading to the formation of insoluble salts and resulting in the formation of oxalate stones. It has also been known to inhibit potassium and sodium. Phytic acid also forms insoluble salts with essential minerals like calcium, iron, magnesium and zinc in food, rendering them unavailable for absorption in the blood stream. The anti-nutritional factors in all samples are present at safe levels necessary to prevent all these effects from occurring.
3.3. Sensory Evaluation
As shown in Table 4, the mean scores of the sensory evaluation by the panelists shows that sample B (85:15) in its cooked form (paste) and raw form (granules), was rated the most acceptable sample amongst other soy enhanced samples, in terms of colour, smoothness, taste,
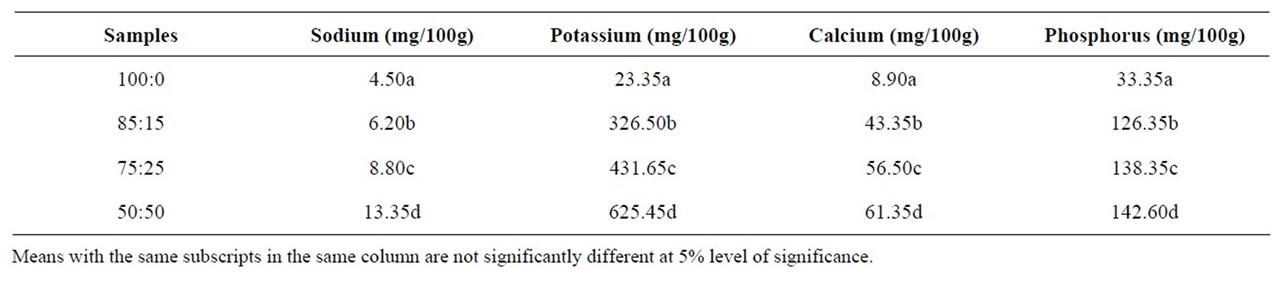
Table 2. Mineral composition of tapioca samples.
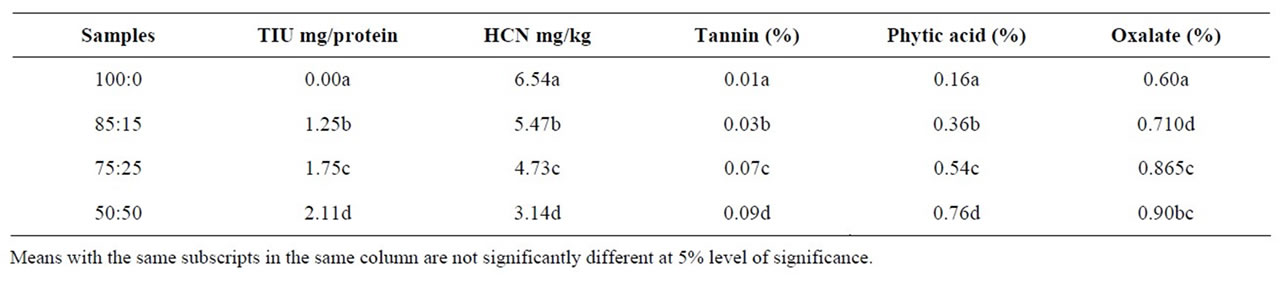
Table 3. Anti-nutritional composition of tapioca samples.
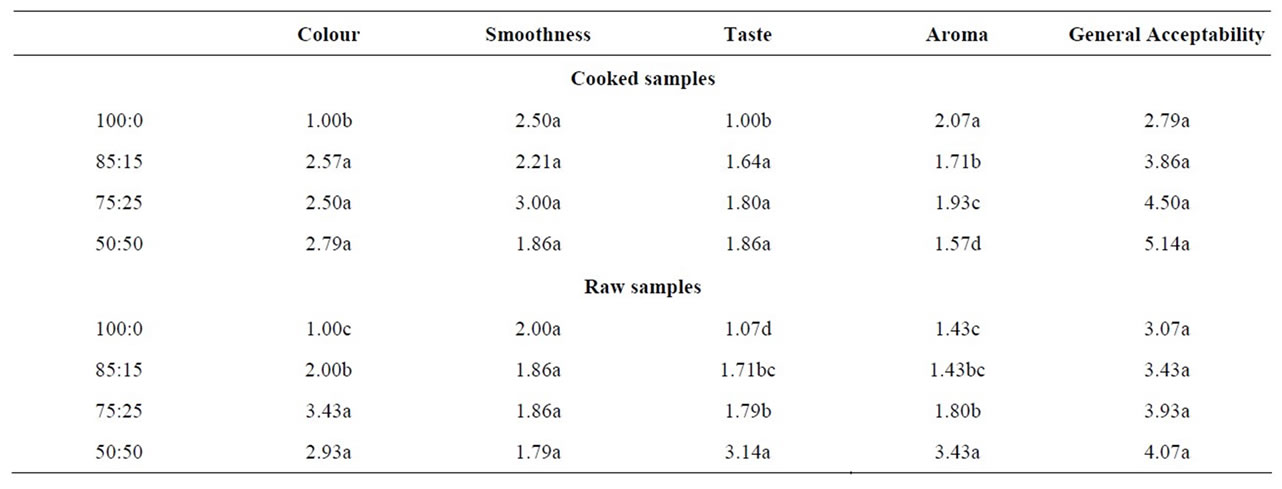
Table 4. Sensory scores of tapioca samples.
aroma and overall acceptability.
3.3.1. Cooked Form (Paste)
Colour of cooked samples was scored from white to brown where 1 represents white (good attribute) and 4 represents brown (poor attribute). The results show that sample A was rated as white and samples B, C and D as light brown. For taste, which was evaluated as bland (1), beany (2), sweet (3) and sour (4). Sample A was thus rated as being bland, while samples B, C and D was rated as being beany in taste. In terms of smoothness, samples A and C was rated as having big lumps, while samples B and D was rated as having small lumps. In terms of aroma, all samples were rated as being pleasant.
3.3.2. Raw Form (Granules)
For the sensory evaluation of the uncooked tapioca samples, sample A was rated as white, sample B as cream, samples C and D as light brown in terms of colour. For particle size, samples A and B was rated as coarse, C was rated grainy and sample D was rated as being gritty. In terms of hardness, sample A was rated as very hard. Samples B and C was rated as being hard and sample D, soft. In terms of aroma, all samples were rated as being pleasant.
Overall, for both cooked and uncooked, sample B appeared to be the most desirable product, as it showed slight variation from the pure tapioca product (Sample A), particularly in terms of colour and texture.
3.4. Conclusion
Incorporation of full-fat soy flour into tapioca had varying effects on the nutritional and sensory properties of the product. Soy fortification resulted in improvement of the nutrient composition in terms of protein, fat, energy and mineral contents. Soy enhanced tapioca samples had a low level of anti-nutritional components, making them safe for consumption. However there is need for further toxicological studies on this product. Sample B (85:15) is high in crude protein, crude fiber and has low crude fat which can make it suitable for longer storage periods as the onset of rancidity might take longer periods. It was also found to be the most acceptable sample in terms of its general acceptability. Further studies are also necessary to determine protein digestibility; microbial examination and stability studies can be carried out on soy enhanced tapioca products to determine their safety and their shelf-life. Fortification of tapioca can also be carried out by the use soybean meal, soy protein isolate or concentrates in varying substitution levels.
REFERENCES
- K. O. Falade and A. O. Akingbala, “Improved Nutrition and National Development through the Utilization of Cassava in Baked Foods,” In: G. L. Robertson and J. R. Lupien, Eds., Using Food Science and Technology to Improve Nutrition and Promote National Development, International Union of Food Science & Technology, 2008, pp. 1-12.
- J. A. Montagnac, C. R. Davies and S. A. Tanumihardjo, “Nutritional Value of Cassava for Use as a Staple Food and Recent Advances for Improvement,” Comprehensive Reviews in Food Science and Food Safety, Vol. 8, No. 3, 2009, pp. 181-219. doi:10.1111/j.1541-4337.2009.00077.x
- A. L. Charles, K. Sriroth and T. C. Huang, “Proximate Composition, Mineral Contents, Hydrogen Cyanide and Phytic Acid of 5 Cassava Genotypes,” Food Chemistry, Vol. 92, No. 4, 2005, pp. 615-620. doi:10.1016/j.foodchem.2004.08.024
- C. Heuberger, “Cyanide Content of Cassava and Fermented Products with Focus on Attiéké and Attiéké Garba,” Ph.D. Dissertation, Swiss Federal Institute of Technology, Zurich, 2005.
- A. J. A. Buitrago, “La Yucca en la Alimentacion Animal,” Centro Internacional de Agricultura Tropical, Cali, 1990.
- M. Stupak, H. Vanderschuren, W. Gruissem and P. Zhang, “Biotechnological Approaches to Cassava Protein Improvement,” Trends in Food Science & Technology, Vol. 17, No. 12, 2006, pp. 634-641. doi:10.1016/j.tifs.2006.06.004
- K. Stephenson, R. Amthor, S. Mallowa, R. Nungo, B. Maziya-Dixon, S. Gichuki, A. Mbanaso and M. Manary, “Consuming Cassava as a Staple Food Places Children 2 - 5 Years Old at Risk for Inadequate Protein Intake, an Observational Study in Kenya and Nigeria,” Nutrition Journal, Vol. 9, No. 9, 2010.
- C. O. Eleazu, I. U. Amajor, A. I. Ikpeama and E. Awa, “Studies on the Nutrient Composition, Antioxidant Activities, Functional Properties and Microbial Load of the Flours of 10 Elite Cassava (Manihot esculenta) Varieties,” Asia Pacific Journal of Clinical Nutrition, Vol. 3, 2011, pp. 33-39. doi:10.3923/ajcn.2011.33.39
- B. N. Okigbo, “Nutritional Implications of Projects Giving High Priority to the Productionof Staples of Low Nutritive Quality. The Case of Cassava in the Humid Tropics of West Africa,” Food and Nutrition Bulletin, Vol. 2, No. 4, 1980, pp. 1-10.
- F. I. Nweke, S. C. Dunstan and J. K. Lynam, “The Cassava Transformation. Africa’s Best Kept Secret,” Michigan State University Press, East Lansing, 2002.
- M. O. Sanni and A. O. Sobamiwa, “Processing and Characteristics of Soybeans-Fortified Gari,” World Journal of Microbiology & Biotechnology, Vol. 10, 1994, pp. 268-270. doi:10.1007/BF00414860
- U. B. Eke, S. O. Owalude and L. A. Usman, “Enrichment of a Cassava Meal (Gari) with Soyabean Protein Extract,” Advances in Natural and Applied Sciences, Vol. 2, No. 2, 2008, pp. 60-62.
- E. O. Afoakwa, E. J. Kongor, G. A. Annor and R. Adjonu, “Acidification and Starch Behaviour during Co-Fermentation of Cassava (Manihot esculenta Crantz) and Soybean (Glycine max Merr) into gari, an African Fermented Food,” International Journal of Food Sciences & Nutrition, Vol. 61, No. 5, 2010, pp. 449-462. doi:10.3109/09637480903393727
- A. Kuye and L. O. Sanni, “Analysis of the Equilibrium Moisture Sorption Data for Lafun and Soyaflour,” Journal of Modeling, Design and Management of Engineering System, Vol. 1, 2002, pp. 63-70.
- A. L. Kolapo and M. O. Sanni, “Processing and Characteristics of Soybean-Fortified Tapioca,” Journal of Women in Technical Education, Vol. 4, 2005, pp. 59-66.
- F. O. Samuel, E. O. Ayoola and F. O. Ayinla, “Chemical Analysis and Consumer Acceptability of Tapioca Fortified with Soybeans,” International Journal of Applied Agricultural Research, Vol. 3, No. 1, 2006, pp. 1-5.
- A. L. Kolapo and M. O. Sanni, “A Comparative Evaluation of the Macronutrient and Micronutrient Profiles of Soybean-Fortified Gari and Tapioca,” Food and Nutrition Bulletin, Vol. 30, No. 1, 2009, pp. 90-94.
- A. J. Omole, O. Omueti and O. J. Ogunleke, “Performance Characteristics of Weaned Rabbits Fed Graded Levels of Dry Cassava Peel Fortified with Soycorn Residue Basal Diet,” Journal of Food, Agriculture & Environment, Vol. 3, No. 3-4, 2005, pp. 36-38.
- J. M. Babajide, S. O. Babajide and S. V. A. Uzochukwu, “Cassava-Soy Weaning Food: Biological Evaluation and Effects on Rat Organs,” Plant Foods for Human Nutrition, Vol. 56, 2001, pp. 167-173. doi:10.1023/A:1011112926012
- I. E. Liener, “Factors Affecting the Nutritional Quality of Soy Products,” Journal of America Oil Chemists Society, Vol. 58, No. 3, 1981, pp. 406-415. doi:10.1007/BF02582390
- Association of Official Analytical Chemists, “Official Method of Analysis,” 15th Edition, Washington, 1998.
- J. H. Bradbury, S. M. Egan and M. J. Lynch, “Analysis of Cyanide in Cassava Using Acid Hydrolysis of Cyanogenic Glucosides,” Journal of the Science of Food and Agriculture, Vol. 55, No. 2, 1991, pp. 277-290. doi:10.1002/jsfa.2740550213
- M. L. Kakade, N. Simons and J. E. Liener, “An Evaluation of Natural versus Synthetic Substrates for Measuring the Antitryptic Activety of Soybean Samples,” Cereal Chemistry, Vol. 46, 1969, pp. 518-526.
- M. L. Kakade, J. J. Rackis, J. E. McGhee and G. Puski, “Determination of Trypsininhibitor Activity of Soy Products: A Collabortive Analysis of an Improved Procedure,” Cereal Chemistry, Vol. 51, 1974, pp. 376-382.
- E. L. Wheeler and R. E. Ferrel, “A Method for Phytic Acid Determination in Wheat and Wheat Fractions,” Cereal Chemistry, Vol. 48, 1971, pp. 312-316.
- R. U. Makower, “Extraction and Determination of Phytic Acid in Beans (Phaeolus vulgaris),” Cereal Chemistry, Vol. 47, 1970, pp. 288-295.
- M. J. Chang, J. L. Collins, J. W. Baily and D. L. Coffey, “Tannins Related to Cultivar, Mturity, Dehulling, and Heating,” Journal of Food Science, Vol. 59, No. 5, 1994, pp. 1034-1036. doi:10.1111/j.1365-2621.1994.tb08183.x
- R. E. Burns, “Method for Estimation Oftanin in Grain Sorghum,” Agronomy Journal, Vol. 63, 1971, pp. 511- 512. doi:10.2134/agronj1971.00021962006300030050x
- D. D. Ribotta, S. A. Anurphi, A. E. Leon and M. C. Aron, “Effects of Soybean Addition on the Rheological and Bread Making Quality of Flour,” Journal of Science Food Agriculture, Vol. 85, 2005, pp. 1889-1896. doi:10.1002/jsfa.2191
- World Health Organization, “Trace Elements in Human Nutrition and Health,” World Health Organization, Geneva, 1996.