International Journal of Medical Physics, Clinical Engineering and Radiation Oncology
Vol.07 No.01(2018), Article ID:82700,16 pages
10.4236/ijmpcero.2018.71010
Detection of Spherical Gold Fiducials in kV X-Ray Images Using Intensity-Estimation-Based Method
Masaki Kokubo1,2, Masahiro Yamada3, Akira Sawada4, Nobutaka Mukumoto3, Yuki Miyabe3, Takashi Mizowaki3, Masahiro Hiraoka3
1Division of Radiation Oncology, Institute of Biomedical Research and Innovation, Kobe, Japan
2Department of Radiation Oncology, Kobe City Medical Center General Hospital, Kobe, Japan
3Department of Radiation Oncology and Image-Applied Therapy, Graduate School of Medicine, Kyoto University, Kyoto, Japan
4Department of Radiological Technology, Faculty of Medical Science, Kyoto College of Medical Science, Nantan, Japan

Copyright © 2018 by authors and Scientific Research Publishing Inc.
This work is licensed under the Creative Commons Attribution International License (CC BY 4.0).
http://creativecommons.org/licenses/by/4.0/


Received: January 22, 2018; Accepted: February 25, 2018; Published: February 28, 2018
ABSTRACT
Fiducial marker detection algorithms in kilovoltage x-ray images using physical characteristics of transmission x-ray have been proposed. It, however, has been suggested recently that factors besides transmission x-ray affect x-ray images. The purpose of this study was to develop a new fiducial detection algorithm using fiducial intensity estimation based on physical characteristics of x-ray images with gold fiducials. First, x-ray images of a fiducial on a water-equivalent phantom were acquired. It was observed that the ratio of background to fiducial intensity in the images decreased as phantom thickness increased. Based on the negative correlation, we identified a function for estimating fiducial intensity that consists of background intensity and the amount of scattered radiation by the other x-ray source of an orthogonal imaging system and a treatment beam. Then, we developed an algorithm that extracts fiducial candidates using the estimation function. Its performance was measured using x-ray images which had 3824 fiducials altogether. The average number of false-positive detection of the proposed algorithm in single image was one-tenth of an algorithm considering only transmission x-ray. The proposed algorithm detected 99.5% of all fiducials under an error of 1.0 mm, while the other algorithm detected 94.7% or less (Clinical trial number: UMIN000005324).
Keywords:
Fiducial Marker Detection, Intensity Estimation

1. Introduction
It has been emphasized recently that management of intrafraction motion is an important feature of image-guided radiotherapy [1] [2] . One method used to compensate for respiratory motion is fluoroscopy-based tracking [1] . In some such tracking methods, surrogate fiducials placed close to a tumor are used to identify the position of the tumor easily [3] [4] .
A method of detecting spherical gold fiducials has been developed using normalized cross-correlation (NCC) indices between a predefined template mask and a test image [3] . However, it is reported that NCC values of the objects that should be detected will decrease and the number of false-positive will be larger for low contrast images [5] . Another correlation index was proposed for robustness to image noise [6] . Image processing filters for enhancing fiducial visibility have been also used in some researches [7] [8] [9] . The methods using correlation indices or image processing filters, however, did not explicitly utilize potentially information-rich physical characteristics of x-ray that induces image intensity.
A method based on physical characteristics of kilovoltage (kV) x-ray has been proposed for detecting metal seeds in a prostate [10] . That method assumes that the intensity of x-rays passing through the patient’s body (I) is approximately
(1)
where is initial intensity of x-ray, line integral along the x-ray path line L, and describes the absorption of x-rays in the patient body. Equation (1) means the ratio between the image intensity of a seed and that of its background is constant. It has, however, been pointed out that the ratio varies depending on the x-ray path length [11] .
The purpose of the present study was to identify physical characteristics of kV x-ray images with spherical gold fiducials and to develop a fiducial detection algorithm using fiducial intensity estimation based on the characteristics.
2. Materials and Methods
2.1. Estimation of Fiducial Intensity
To estimate fiducial intensity in kV x-ray images, regression analysis between the intensity of a fiducial and that of its surrounding background using water-equivalent phantoms was performed as a preliminary experiment. In all experiments, we used Vero4DRT (Hitachi, Ltd., Japan) [12] [13] [14] , which was equipped with an orthogonal kV x-ray imaging system that consists of two sets of a kV x-ray tube and a flat panel detector (FPD) (Figure 1). The FPD acquired kV x-ray images without halting MV x-ray irradiation. Intensity of exported kV x-ray images was not normalized.
2.1.1. Experimental Conditions
First, a fiducial of 1.5 mm in diameter was placed at the isocenter and x-ray path
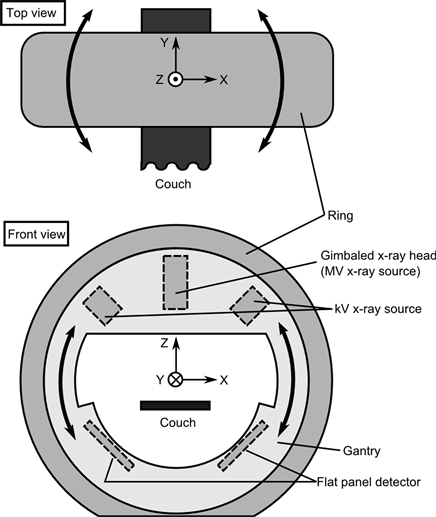
Figure 1. Structure of the Vero4DRT. The ring of the Vero4DRT rotates around the vertical axis (Z axis). The gantry is mounted inside the ring frame and rotates around the Y axis. An orthogonal kV x-ray imaging system (two sets of a kV x-ray tube and a flat panel detector) and a gimbaled x-ray head (an MV x-ray source) are mounted on the gantry, and they rotate with the gantry rotation.
length along the line passing through the isocenter was varied by using water-equivalent phantoms (0, 50, 100, and 200 mm in thickness). Then, kV x-ray images with a resolution of 0.21 mm/pixel at the isocenter and a bit depth of 14 bits were acquired using a single detector set composed of a kV x-ray tube and an FPD (Figure 2) under the x-ray tube conditions (voltage [kV] and current time product [mAs]) of (80, 0.5), (100, 0.5), (120, 0.5), and (120, 2.0), respectively. The mean value in 3 × 3 pixels centered at the centroid of a fiducial was served as the intensity of the fiducial while the mean value in pixels that were 7 pixels away from the centroid of the fiducial was served as the intensity of the background.
2.1.2. Regression Analysis among the Intensity of a Fiducial, the Intensity of the Background, and X-Ray Path Length
As the results of the preliminary experiment, the following equations (from (2)

Figure 2. Photograph of acquisition of kV x-ray images using a phantom with a fiducial. The top right image shows a kV x-ray source. The bottom right image shows a sample of kV x-ray image.
to (4)) were derived.
It was observed that logarithm of the intensity ratio decreased in proportion to the thickness of the phantom (R2 > 0.99);
, (2)
where is the intensity of a fiducial, the intensity of the background, and p the thickness of the phantom, “x-ray path length”. Here, was 6.68 and b −5.14 × 10⁻³.
A qualitatively plausible explanation for the decrease in the intensity ratio is that, as phantom thickness increased, scattered radiation from the phantom increased the intensity of both the fiducial and the background (Figure 3).
Then, it was observed that the background intensity was proportional to the inverse of phantom thickness (R2 > 0.9999) for (tube voltage [kV], tube current time product [mAs]) = (100, 0.5). can be expressed as
, (3)
where c and d are determined by a combination of tube voltage and tube current time product. For (tube voltage [kV], tube current time product [mAs]) = (100, 0.5), c was 5.40 × 10⁵ and d −2.04 × 10³. The correlation value with (3) was slightly higher than the correlation value between and (R2 > 0.9993).
Finally, was proportional to (R2 > 0.96) for a tube current time product of 0.5 mAs, where and denote two arbitrary tube voltages, respectively. and denote the background intensities as well. Therefore, the following equation is assumed:
(4)
Here, was 3.3.
Theoretically, intensity of x-ray is proportional to tube current. Let D and D0 be tube current time products for and , respectively. From (2), (3),

Figure 3. Conceptual figure for explanation of the decrease in the intensity ratio between a fiducial and its background.
and
are transmission x-ray intensities for the point on FPD at which a fiducial is projected and that at which a fiducial is not projected, respectively (
).
and
are scattered x-ray intensities for a thin phantom and a thick phantom, respectively. Here, intensities in the figure are normalized with respect to
,  or
or . As phantom thickness increases, scattered x-ray intensity relatively increases and, therefore, background intensity decreases relative to fiducial intensity (
 ).
).
and (4), coefficient c and d in (3) are expressed as
 , (5)
, (5)
 , (6)
, (6)
where  and
and  are coefficients for
 , respectively.
Subsequently, intensity of a fiducial with scattered radiation of MV x-ray and/or kV x-ray from the other set of a kV x-ray tube and an FPD was specified as
 , (7)
, (7)
where S denotes the amount of scattered radiation. Intensity of background with scattered radiation is expressed as
 . (8)
. (8)
Then, the intensity of fiducial with scattered radiation is obtained as follows (Appendix A)
 . (9)
. (9)
2.2. Fiducial Detection Algorithm
We developed a detection algorithm based on intensity of fiducial estimated by (9). The algorithm has intensity-based detection and estimation of scattered radiation process, which are described in detail below. The detail flowchart of the algorithm and processings except two above are shown in Appendices B-E.
2.2.1. Intensity-Based Detection
At the first fiducial detection step, intensity-based detection is performed using a discrimination threshold for intensity. The threshold is selected fundamentally based on the estimated intensity of a fiducial [(9)]. Therefore, the discrimination threshold T is given by
 , (10)
where  is the estimated intensity of a fiducial shown in (9). If the intensity of a pixel of interest is T or below, the pixel is judged to be a fiducial candidate. Here, S was initially set to a given (tentative) value to allow calculation of
  using (9).
However, in order to reduce the extent of false-positive detection attributable to noise, on condition that  is close to the intensity of the background pixel that is the surrounding of a pixel of interest
 , that is,
  , T is given by
 , (11)
where  is the threshold of the intensity difference between a pixel of interest and the background thereof.
Furthermore, in order to prevent both false-positive and false-negative detection, the characteristic of intensity of non-fiducials, that is, all objects that are not fiducials, was considered. The lower limit of intensity of non-fiducials at each background intensity was determined by reference to the kV x-ray images of five patients with implanted fiducials. Edges of bones (for example) were included in non-fiducials exhibiting the lower limits. The images were acquired using a tube voltage of 100 kV and a tube current time product of 0.5 mAs. Figure 4 shows the lower limit of intensity; for non-fiducials, this limit was higher

Figure 4. The lower limit of intensity of non-fiducials at each background intensity  The straight line shows values that are 0.7 fold the
  value.
than the  of Figure 4. On condition that
  is larger than the lower limit of the intensity of non-fiducials, that is,
  , T is given by
 , (12)
where  is the lower limit of the intensity of non-fiducials (
 in Figure 4).
Eventually, the discrimination threshold T is given as shown in Figure 5.
2.2.2. Determination of the Amount of Scattered Radiation
Estimation of the amount of scattered radiation, S, is performed with reference to the number of detected fiducial candidates. If this number is greater than or equal to the number of fiducials previously registered, the algorithm moves to the next step. If not, the algorithm iteratively performs the intensity-based and round-index-based (Appendix C) detection, with increasing S in increments of 100. This incremental value is selected so as to balance reasonable computational time with adequate false-positive detection. An increase in S causes the threshold T to rise and the algorithm to identify more fiducial candidates.
2.3. Implementation
The algorithm was implemented using C++ Builder XE (Embarcadero Technologies, Inc., San Francisco, CA) and Matrox Imaging Library (Matrox Electronic Systems Ltd., Quebec, Canada) and was run on a computer with a 3.4-GHz core-i7 processor and 4 GB of random-access memory.

Figure 5. A schematic diagram of the discrimination thresholds. In ,
,  is applied to a threshold, where
  is the intensity of the background and
  the threshold of the intensity difference. In
 , the estimated intensity of a fiducial,
  , is applied to the threshold. In
 , the middle value of
  and the lower limit of intensity of non-fiducials,
  , is applied to the threshold.
  is the threshold in the case where the level of scattered radiation is greater than that of T.
2.4. Verification of the Proposed Algorithm Using Patient Data
2.4.1. Validity of the Discrimination Threshold for Intensity
The estimated fiducial intensity  was compared with the actual fiducial intensity for the fiducials shown in Figure 4. Data in Figure 4 include 259 values, which consists of 11 sets of kV x-ray images. Each set of the images was acquired continuously at a certain gantry angle. For each set, one value of S was selected to minimize squared error between estimated fiducial intensity and actual fiducial intensity.
2.4.2. False-Positive Detection
The number of false-positive detections in the kV x-ray images was computed. The kV x-ray images of four patients who underwent tracking irradiation therapy in Kyoto University Hospital were employed for the evaluation in Sections 2.4.2, 2.4.3 and 2.4.4. The patients each had three to five implanted fiducials. The numbers of the fiducials located in S6, S7, S8, S9 and S10 in the right lung were 4, 1, 5, 4 and 3, respectively. The images were acquired once per second in seven treatment ports during delivery of a single fraction; in total, 3824 fiducials in 900 image pairs (1800 images) was available for analysis. The orthogonal kV x-ray imaging system was rotated in combination with the MV x-ray source; this meant that the kV x-ray images were acquired at various angles (Table 1). Several kV x-ray images were acquired in each treatment port prior to application of the MV beam. MV field size ranged from 20.8 to 39.8 cm2.
2.4.3. Validity of Estimation of the Amount of Scattered Radiation
The differences between actual increase and estimated increase in intensity, which were caused by a scattered MV beam, were computed. The actual increase was calculated as the difference between the average intensity of the kV x-ray image prior to MV irradiation and that of the image during irradiation; the estimated increase was calculated as the difference between the S estimated in Section 2.2.2 for the image before irradiation, and that for the image during irradiation. Ten image pairs, which were composed of two images acquired before or

Table 1. Numbers of kV x-ray images taken at various gantry and ring angles.
during irradiation, were used to calculate the errors.
2.4.4. Overall Performance of the Proposed Detection Algorithm
Our algorithm was compared to constant-ratio threshold algorithms in terms of detection rate and positional error. A “constant-ratio threshold” algorithm is an algorithm in which the discrimination threshold of the ratio between the image intensity of a fiducial and that of the background thereof is constant, as assumed in a previous study [10] . Two different constant ratios were applied for two constant-ratio threshold algorithms, respectively. A constant ratio threshold of 1.10 was used in one algorithm (hereafter referred to as large constant-ratio threshold algorithm). A constant ratio threshold of 1.07 was used in the other algorithm (hereafter referred to as small constant-ratio threshold algorithm). Visually observed fiducial positions were served as the gold standards. Constant-ratio algorithms were implemented by making the threshold of the ratio be constant, that is, making  in (9) be proportional to the background intensity.
3. Result
3.1. Validity of the Discrimination Threshold for Intensity
The estimated intensity showed a strong correlation with the actual intensity (Figure 6, R2 >0.95). The observed strong correlation shows that the estimated intensities were valid.
3.2. False-Positive Detection in Each Image
Table 2 shows the averages and 95th percentiles of the numbers of false-positive

Figure 6. The relationship between the actual intensity of a  and the estimated intensity
 , which is the discrimination threshold. The straight line is the regression
 .
.
Table 2. Numbers of false-positive detections.
detections evident after applying the detection processes based on intensity and round index values for the proposed algorithm and for the contrast-ratio threshold algorithms.
3.3. Validity of Estimation of the Amount of Scattered Radiation
We found that the average number of absolute errors for the estimated amounts of scattered radiation was 65.1, thus lower than the increment step (100) used to progress S. The lower error than resolution means that the proposed algorithm has capability of estimating the amount of scattered radiation.
3.4. Overall Performance of the Proposed Detection Algorithm
Table 3 shows the detection rates, the absolute positional errors for all detected fiducials and the detection rate under a three dimensional error of 1.0 mm. Our algorithm detected 99.5% of all fiducials. The 99th percentiles of positional errors were 0.16, 0.16, and 0.21 mm in the left-right (LR), cranio-caudal (CC), and anterior-posterior (AP) directions, respectively. The means (±standard deviations) of positional errors of the proposed algorithm were 0.0 (±0.1), 0.0 (±0.1), and 0.0 (±0.1) mm in LR, CC, and AP directions, respectively.
The proposed algorithm failed to detect some fiducials lying on the same epipolar line due to the function of preventing a reduction in positional accuracy (Appendix E).
The average processing time was 67 ms per image pair and the maximum processing time was 140 ms per image pair.
4. Discussion
The detection rate afforded by the proposed algorithm was higher than that of the constant-ratio algorithms that applied an assumption in a previous study [10] . Furthermore, the positional errors of the proposed algorithm were smaller than those of the small constant-ratio threshold algorithm. Figure 7 shows images in which use of the small constant-ratio threshold algorithm caused large
Table 3. Detection rates and 99th percentiles of positional errors for all detected fiducials. The values in parentheses show the range of the detection rates or the 99th percentiles of positional error for 28 ports (7 ports for each patient).

Figure 7. Images on which the small constant-ratio threshold algorithm caused large positional errors. The squares indicated by A, B, and C show the fiducial that was detected correctly, non-fiducials incorrectly detected as fiducials, and fiducials that were not detected, respectively. Other squares show fiducial candidates in each x-ray image. The hatched regions are areas that are not regions of interest.
positional errors. This was because many false-positive fiducial candidates were evident in each image in Figure 7 and some false-positive candidates met the conditions applied for calculation of a three-dimensional fiducial position (Appendix D). Therefore, it is possible that the lower level of false-positives associated with the use of the proposed algorithm (Table 2) reduced positional error. It may be observed, in Figure 7, that as a region became brighter (associated with a reduced x-ray path length), more false-positive fiducial candidates emerged. This suggests that the intensity ratio threshold should be higher in bright regions, as indicated also by consideration of Figure 3 and (2), on which the proposed algorithm is based.
In some x-ray images, the proposed algorithm failed to detect fiducials. One possible method that may be used to eliminate such false-negative findings is to use the loci of fiducials evident in images acquired before the images of interest were taken.
A previous study on the detection of spherical gold fiducials showed that the means (± standard deviations) of positional errors were −0.2 (±0.2), 0.0 (±0.2), and 0.0 (±0.3) mm in the LR, CC, and AP directions, respectively, when 2-mm-diameter fiducials were used in the absence of a scattered MV beam [3] . The results in Section 3.4 show that, even when a scattered MV beam was present, our algorithm afforded equivalent or higher-level accuracy.
The Vero4DRT acquires kV x-ray images every second during tumor tracking irradiation. As the algorithm completed fiducial detection within a maximum time of 140 ms, the algorithm will be able to detect fiducial positions in real time in kV x-ray images acquired during irradiation. This capability affords further functions. For example, irradiation may be terminated if the difference between a fiducial position predicted and that calculated using a monitoring kV x-ray image is greater than a predetermined threshold.
Furthermore, intensity-based detection using the relationship between fiducials and its background in the proposed algorithm has possibility of being adapted to fiducials with other shapes such as cylindrical or coil-shape fiducials if the relationship is investigated by a method shown in Section 2.1 and if imaging angles are considered for a fiducial that is not point-symmetric.
5. Conclusion
We identified a relationship between the intensity of a fiducial and that of the background thereof. This relationship depends on tube voltage, tube current time product, x-ray path length, and the extent of the scattered MV and/or kV x-ray beam. We have shown that our proposed fiducial detection algorithm (based on the above-mentioned relationship) affords high accuracy with low false-positive detection.
Acknowledgements
This research was partially supported by AMED under Grant Number JP17ck0106303.
Cite this paper
Kokubo, M., Yamada, M., Sawada, A., Mukumoto, N., Miyabe, Y., Mizowaki, T. and Hiraoka, M. (2018) Detection of Spherical Gold Fiducials in kV X-Ray Images Using Intensity-Estimation-Based Method. International Journal of Medical Physics, Clinical Engi- neering and Radiation Oncology, 7, 115-130. https://doi.org/10.4236/ijmpcero.2018.71010
References
- 1. Khan, F.M. (2010) The Physics of Radiation Therapy. Lippincott Williams & Wilkins, Baltimore and a Wolters Kluwer Business, Philadelphia.
- 2. Keall, P.J., Mageras, G.S., Balter, J.M., Emery, R.S., Forster, K.M., Jiang, S.B., Kapatoes, J.M., Low, D.A., Murphy, M.J., Murray, B.R., Ramsey, C.R., Van Herk, M.B., Vedam, S.S., Wong, J.W. and Yorke, E. (2006) The Management of Respiratory Motion in Radiation Oncology Report of AAPM Task Group 76. Medical Physics, 33, 3874-3900. https://doi.org/10.1118/1.2349696
- 3. Shirato, H., Shimizu, S., Kunieda, T., Kitamura, K., van Herk, M., Kagei, K., Nishioka, T., Hashimoto, S., Fujita, K., Aoyama, H., Tsuchiya, K., Kudo, K. and Miyasaka, K. (2000) Physical Aspects of a Real-Time Tumor-Tracking System for Gated Radiotherapy. International Journal of Radiation Oncology Biology Physics, 48, 1187-1195. https://doi.org/10.1016/S0360-3016(00)00748-3
- 4. Nuyttens, J.J., Prevost, J.B., Praag, J., Hoogeman, M., Van Klanveren. R.J., Levendag, P.C. and Pattynama, P.M.T. (2006) Lung Tumor Tracking during Stereotactic Radiotherapy Treatment with the CyberKnife: Marker Placement and Early Results. Acta Oncologica, 45, 961-965. https://doi.org/10.1080/02841860600902205
- 5. Ching, W. (1994) A Novel Change Detection Algorithm Using Adaptive Threshold. Image and Vision Computing, 12, 459-463. https://doi.org/10.1016/0262-8856(94)90029-9
- 6. Elboher, E. and Werman, M. (2013) Asymmetric Correlation: A Noise Robust Similarity Measure for Template Matching. IEEE Transactions on Image Processing, 22, 3062-3073. https://doi.org/10.1109/TIP.2013.2257811
- 7. Nederveen, A., Lagendijk, J. and Hofman, P. (2000) Detection of Fiducial Gold Markers for Automatic On-Line Megavoltage Position Verification Using a Marker Extraction Kernel (MEK). International Journal of Radiation Oncology Biology Physics, 47, 1435-1442. https://doi.org/10.1016/S0360-3016(00)00523-X
- 8. Slagmolen, P., Hermans, J., Maes, F., Budiharto, T., Haustermans, K. and Heuvel, F. (2010) Fast, Accurate, and Robust Automatic Marker Detection for Motion Correction Based on Oblique kV or MV Projection Image Pairs. Medical Physics, 37, 1554-1664. https://doi.org/10.1118/1.3355871
- 9. Jiang, X., Haase, D, Körner, M., Bothe, W. and Denzler, J. (2013) Accurate 3D Multi-Marker Tracking in X-Ray Cardiac Sequences Using a Two-Stage Graph Modeling Approach. Computer Analysis of Images and Patterns Lecture Notes in Computer Science, 8048, 117-125. https://doi.org/10.1007/978-3-642-40246-3_15
- 10. Tubic, D., Zaccarin, A., Pouliot, J. and Beaulieu, L. (2001) Automated Seed Detection and Three-Dimensional Reconstruction. I. Seed Localization from Fluoroscopic Images or Radiographs. Medical Physics, 28, 2265. https://doi.org/10.1118/1.1414308
- 11. Akimoto, M., Nakamura, M., Mukumoto, N., Yamada, M., Ueki, N., Matsuo, Y., Sawada, A., Mizowaki, T., Kokubo, M. and Hiraoka, M. (2012) Optimization of the X-Ray Monitoring Angle for Creating a Correlation Model between Internal and External Respiratory Signals. Medical Physics, 39, 6309-6315. https://doi.org/10.1118/1.4754648
- 12. Kamino, Y., Takayama, K., Kokubo, M., Narita, Y., Hirai, E., Kawawda, N., Mizowaki, T., Nagata, Y., Nishidai, T. and Hiraoka, M. (2006) Development of a Four-Dimensional Image-Guided Radiotherapy System with a Gimbaled X-Ray Head. International Journal of Radiation Oncology Biology Physics, 66, 271. https://doi.org/10.1016/j.ijrobp.2006.04.044
- 13. Matsuo, Y., Sawada, A., Ueki, N., Miyabe, Y., Nakamura, M., Yano, S., Kaneko, S., Mizowaki, T., Kokubo, M. and Hiraoka, M. (2012) An Initial Experience of Dynamic Tumor Tracking Irradiation with Real-Time Monitoring Using Vero4DRT (MHI-TM2000). Radiotherapy and Oncology, 103, S64. https://doi.org/10.1016/S0167-8140(12)70505-4
- 14. Mukumoto, N., Nakamura, M., Sawada, A., Suzuki, Y., Takahashi, K., Miyabe, Y., Kaneko, S., Mizowaki, T., Kokubo, M. and Hiraoka, M. (2013) Accuracy Verification of Infrared Marker-Based Dynamic Tumor-Tracking Irradiation Using the Gimbaled X-Ray Head of the Vero4DRT (MHI-TM2000). Medical Physics, 40, 041706. https://doi.org/10.1118/1.4794506
- 15. Forsyth, D.A. and Ponce, J. (2003) Computer Vision: A Modern Approach. Pearson Education, Upper Saddle River.
Appendices
Appendix A. Derivation of an Equation for Estimating Fiducial Intensity
By solving (3) for p, we get
 . (A1)
By substituting (A1) for (2), we obtain
 . (A2)
Solving for  gives
gives
 . (A3)
By substituting (7) and (8) for (A3), we obtain
 . (A4)
Solving for  gives (9).
Appendix B. Flowchart of Proposed Algorithm
Figure A1 shows the flowchart of the proposed fiducial detection algorithm. The algorithm has two steps in which the estimated fiducial intensity  is used. In the first step (“high-contrast fiducial detection” in Figure A1), the algorithm is used to detect fiducials that contrast well with the background. In the second step (“low-contrast fiducial detection” in Figure A1), fiducials that contrast poorly with the background are detected.
Appendix C. Round-Index-Based Detection
After performing detection based on intensity, we then conduct detection based on the round index of each fiducial candidate. Round index values,  , are computed to identify round dark objects in x-ray images as fiducial candidates. Each round index is calculated using steps (a) to (c) below. (a) The average intensity,
  , of pixels located at a distance of
  from the location of a pixel of interest,
  is acquired. (b) In the same manner as in (a) above, the average intensity,
  , of pixels located at a distance of
  from
from  is acquired. These pixels are assumed to lie outside a fiducial area. (c) Pixels within the circle with a radius of
  and with a center of
  are extracted. These pixels,
  , are assumed to lie inside a fiducial area.
  is set as the number of the pixel, p, that satisfies
  and
and , where
 is the intensity of p. Regions of interest with
  are considered fiducial candidates, where
  is a threshold.
Appendix D. Matching Fiducial Candidates to Registered Fiducials
After fiducial candidate detection is performed in both kV x-ray images (image 1 and image 2) acquired using the orthogonal kV x-ray imaging system, three-dimensional fiducial positions are calculated [3] under the following

Figure A1. Flowchart of our proposed fiducial detection algorithm. The algorithm has both high- and low-contrast fiducial detection processing. Both forms of fiducial detection have processing (Detection A and Detection B) for image 1 and 2. Processing for image 1 is performed on images acquired with FPD 1. Processing for image 2 is similar for FPD 2.
conditions of (a) and (b) below. (a) The three-dimensional relative positions of fiducial candidates are close to those of fiducials that were manually identified

Figure A2. An example of regions to which low-contrast fiducial detection is applied.  and
and  are fiducial candidates in image
 .
. ,
,  , and
, and  are fiducial candidates in image
 .
.  has a corresponding fiducial candidate
  in
in , which lies in the range adjacent to the epipolar line corresponding to
 . However,
  does not have any corresponding fiducial candidate in
 . In this instance, the fiducial detection algorithm attempts to detect fiducial candidates by applying lower thresholds to
 .
.
in CT images acquired before treatment. (b) Fiducial candidates are ignored if multiple candidates for the image i (I = 1 or 2) are present near the epipolar line [15] .
Appendix E. Low-Contrast Fiducial Detection
The threshold T (Section 2.2.1), to which the amount of scattered radiation described in Section 2.2.2 was applied, and the round index are used in the step detecting low-contrast fiducials. Here, however, both the threshold of the intensity difference  in (11) and that of the round index are lower than the values used for high-contrast fiducial detection. The lower thresholds are applied only near the epipolar line associated with fiducial candidates (Figure A2). After fiducial candidate detection, such candidates are matched to registered fiducials in the same way as described in Appendix D.