Advances in Nanoparticles
Vol.2 No.2(2013), Article ID:31882,12 pages DOI:10.4236/anp.2013.22022
Plasma Proteome Profiling with Monoclonal Antibody Libraries: A Pilot Biomarker Analysis for Nanomedicine-Induced Complement Activation
1Nanomedicine Research and Education Center, Semmelweis University, Budapest, Hungary
2Department of Nanobiotechnology and Regenerative Medicine, Faculty of Health Sciences, Miskolc University, Miskolc, Hungary
3Seroscience Ltd., Budapest, Hungary
4Arrayit Corporation Sunnyvale, USA
5Biosystems International Kft., Debrecen, Hungary
6Department of Human Genetics, Medical and Health Science Center, University of Debrecen, Debrecen, Hungary
Email: *jszebeni2@gmail.com, jozsef.lazar@biosys-intl.com
Copyright © 2013 János Szebeni et al. This is an open access article distributed under the Creative Commons Attribution License, which permits unrestricted use, distribution, and reproduction in any medium, provided the original work is properly cited.
Received December 31, 2012; revised February 2, 2013; accepted February 9, 2013
Keywords: Hypersensitivity Reactions; Complement Factor H; Serum Amyloid P; Proteome Profiling; Biomarkers
ABSTRACT
Complement (C) activation-related hypersensitivity reactions (HSRs) represent an unsolved adverse immune effect of many i.v. administered “nanomedicines”, such as liposomal doxorubicin (Doxil/Caelyx). Because these pseudoallergic reactions can be severe or even lethal, it is an important clinical objective to find biomarkers for proneness for C activation by reactogenic nanoparticles that will allow the prediction of in vivo reactions by in vitro assays. With this goal in mind we identified a normal human blood donor whose serum consistently showed high sensitivity to Caelyx-induced C activation in vitro (CSS). The plasma of this blood (Caelyx-sensitive plasma, CSP) was subjected to proteome profiling with a library of human plasma proteome specific mAbs. The chip (PlasmaScan-380TM) contained 380 non-redundant (with respect to epitopes) mAbs. The analysis revealed 8 proteins that were differentially represented in CSP in comparison with Caelyx-insensitive control plasma. These proteins were identified by mass spectrometry and Western blot analyses to represent factor H (decreased in CSP), factor H related protein, serum amyloid P component, fibronectin, complement component C4, Apo B100, prothrombin and alpha-2-HS glycoprotein (all increased in CSP). Some of these protein changes are consistent with proneness for increased C activation, suggesting the potential use of this method in the search for biomarkers for liposome-induced or other types of nanomedicine-induced HSRs.
1. Introduction
Complement (C) activation-related pseudoallergy (CARPA) is a relatively new concept that explains those drug-induced acute hypersensitivity reactions (HSRs) where the drug activates C while a role for specific IgE, or direct stimulation of mast cells cannot be identified [1]. Liposomal drugs, such as liposomal doxorubicin (Doxil, Caelyx), micellar solvents, radiocontrast media, monoclonal antibodies, enzymes and a variety of polymeric and miscellaneous other types of drugs can cause such reactions, also known as infusion or anaphylactoid reactions [1,2]. The clinical picture includes typical allergic symptoms with skin rash and signs of cardiopulmonary distress, and shows substantial individual variation. While tolerable in most cases, the main problem with CARPA is that it can be fatal in an occasional hypersensitive individual; however, there is at present no known diagnostic method to predict who will react [3-5]. Thus, severe CARPA represents a life-threatening condition whose prevention could be significantly advanced by developing a predictive laboratory assay [2].
With this ultimate goal in mind, the present preliminary study was initiated to utilize a new, state-of-the-art protein biomarker profiling method to identify biomarker candidates for CARPA. Monoclonal antibody proteomics, the methodology applied in the work, has recently shown unique success in identifying lung cancer specific [6,7] and other biomarkers [8] using high throughput ELISA assays for the discovery. In this study, to further explore the potential of mAb proteomics technology, an antibody biochip (PlasmaScan-380TM) on which 380 monoclonal antibodies (mAb) are coated with specificity for native, immunogenic, accessible epitopes present in human plasma was applied for biomarker research.
Our working hypothesis was that using the PlasmaScan-380TM biochip for comparative protein profiling of normal human plasmas and a human plasma which shows increased sensitivity to Caelyx-induced C activition would reveal differences in one or more protein levels that might serve as biomarker candidates for proneness for C activation, and, hence CARPA.
2. Materials and Methods
2.1. Materials
Caelyx®, the trade name of Doxil® in Europe, was obtained from the pharmacy of Semmelweis University. It contains doxorubicin, 2 mg/mL (4.22 mM); fully hydrogenated soy phosphatidylcholine (HSPC), 9.58 mg/mL; cholesterol (Chol), 3.19 mg/mL; 2K-PEG-DSPE (N-carbamyl-poly(ethylene glycol methyl ether)-1, 2-distearoyl-sn-glycerol-3-phosphoethanolamine triethyl ammonium salt with a polyethylene glycol (PEG) moiety of average molecular mass of 2000 Da, 3.19 mg/mL; ammonium sulfate, ~0.2 mg/mL; histidine (10 mM, pH 6.5); and sucrose (10%). Total phospholipid: 12.8 mg/mL (13.3 mM). Zymosan A was purchased from Sigma-Aldrich Hungary Ltd. PlasmaScan-380TM biochips were provided by ArrayIt Co’s (http://arrayit.com/), (http://arrayit.com/Products/Protein_Microarrays/PlasmaScan_Microarrays/plasmascan_microarrays.html). Normal pooled human plasma was purchased from the Institute Nationale de la Transfusion Sanguine (INTS, France).
2.2. Methods
2.2.1. Preparation of Normal Human Plasma and Serum
Human blood was drawn from healthy volunteers by venipuncture according to an institutionally approved protocol. The blood was then either anticoagulated with EDTA, or allowed to clot at room temperature, followed by centrifugation at 3500 g for 7 min. The supernatant sera (normal human serum, NHS) were used either freshly, or were aliquoted and stored at −80˚C. Frozen specimens were thawed at 37˚C and kept on ice until use.
2.2.2. Measurement of Complement Activation
The serum specimens were exposed to Doxil at the volume ratio of 3:1; typically, 15 μl of serum was mixed with 5 μl of 10-fold diluted Doxil in Eppendorf tubes, which were then incubated at 37˚C for 60 min. Samples were placed on ice, and C reactions were stopped by 980 μl of specimen diluents, provided by the supplier, completed with 10 mM EDTA. Reaction markers of C activation were quantitated by enzyme-linked immunosorbent assays (ELISA). The reagent kits for SC5b-9, C3a-desArg and Bb were purchased from Quidel Ltd (via TECO-Medical Group, Sissach, Switzerland), while the C5a-desArg test was supplied by BD Biosciences Inc. Absorbance values at 450 nm were measured by a FluoStar Omega microplate reader. Concentration of analytes was determined in the linear range of the calibration curves.
2.2.3. Statistical Analysis of Complement Activation Data
Kolmogorov-Smirnov test was conducted to evaluate the normality assumption of the data sets. To assess statistical significance, one-way ANOVA followed by Dunnett’s post-hoc evaluation, was used. The difference between two groups was considered statistically significant at p < 0.05. A test material induced C activation, when parallel treatments of a randomly selected group of sera resulted in a significant increase of a C activation product, relative to the vehicle controls.
2.2.4. Preparation of Plasma for Biochip Analysis
EDTA-anticoagulated plasma from the same patients, whose sera was analyzed for C activation (see above), were subjected to biochip analysis as follows. The seven most abundant plasma proteins were depleted from the sera in an AKTA purifier-10 HPLC workstation (GE Healthcare Ltd. Piscataway NJ USA) using the Human-7 Multiple Affinity Removal System (MARS) (Agilent Technologies, Santa Clara, CA). The individual depleted plasma samples were labeled with a bi-functional NHSbiotin having a long alkyl chain as a spacer EZ-Link Sulfo-NHS-LC-Biotin from Pierce (Rockford, IL) according to the manufacturer’s instructions. Protein concentration of the samples was then determined by the BCAmethod and was set to either 5 or 10 mg/ml, working aliquots were stored at −70˚C.
2.2.5. Characteristics and Use of PlasmaScan-380TM Biochips
PlasmaScan-380TM biochips have been printed on a microscope slide-sized glass plate (six/plates), each containing 380 different antibodies spotted in triplicates. The microarrays were activated for 60 min by the protein microarray activation buffer, and the chips were washed two times for 5 min in protein microarray wash buffer and one time for 1 sec in protein microarray rinse buffer. After washing, they were dried by spinning for 1 sec in a microarray high-speed centrifuge. Samples for microarray analysis were prepared by mixing 50 µg (5 to 10 µl) of labeled serum proteins with protein microarray reaction buffer. The same volume of protein sample was used for all reactions. Activated PlasmaScan™ microarrays were reacted with labeled plasma samples in an AHC1 × 24 or AHC4 × 24 microarray hybridization cassette with a modified gasket having 300 µl reaction volumes. The binding was allowed to proceed for 60 min at room temperature with gentle mixing. The reaction was stopped by washing the microarrays three times for 3 min in protein microarray wash buffer, with gentle agitation. After washing, the slides were dried by spinning for 1 sec in a microarray high-speed centrifuge.
2.2.6. Visualization of Bound Proteins
To visualize antibody-bound proteins, the microarrays were stained with a fluorescent (Cy3™) streptavidin secondary reagent, diluted to 1 µg/ml in protein microarray reaction buffer. Staining was done for 60 min at room temperature with gentle agitation. Microarrays were washed three times for 3 min in protein microarray wash buffer and one time for 1 sec in protein microarray rinse buffer with gentle agitation. After washing chips were dried as above. Finally, the microarrays were scanned for fluorescence emission using Arrayit InnoScan® 710 (is710 70LC1 709045) microarray scanner. Scanner settings were: pixel size: 5 µm, scanning wavelength: 635 nm.
2.2.7. Biochip Image Analysis and Quantitation
All data files were saved as 16-bit TIFF images for data analysis. Spot intensities in these images were quantified using Arrayit Mapix Microarray Quantification Software (Mapix 4.6.2, driver 5.0.0) and data were saved in a text-file (.txt). The .txt file was imported into Microsoft Excel for additional analysis. As a first step, median background subtracted spot pixel intensities were threshold corrected. Threshold was calculated using the equation: [3 × B × CVb,] where B equaled to the median local background of each spot and CVb expressed the averaged coefficient of variation of all the backgrounds on the array. Those (“bad”) spots, of which median background subtracted spot pixel intensity was lower than the threshold were not used in further calculations. Replicates were combined; means and standard deviations (SD) were calculated in each array. When the standard deviation within the replicates was larger than 1/3rd of the mean [SD > (mean/3)] the outlier spot was identified and its value was eliminated.
For global normalization, the sum of total intensities of all spots within each array was calculated. Within the corresponding replicate arrays, a correction factor (cf) was determined. For example, correction factor between array A and B (cfAB) is calculated from the total intensity of array *A (TIA) divided by the total intensity of array *B (TIB): cfAB = TIA/TIB. Using the correction factor the median background subtracted intensity of each spots was recalculated: TIB × cfAB. Scatter plots of raw and global normalized data and selection of differentiating antibodies were done using the selected data pairs. To select antibodies giving significant signals (higher than sample signal deviation), global mean normalizations were done to correct systematic bias in antibody signal ratios by fitting the LOESS regression in R software [9]. In the next step, the residuals (distances between the original points and the LOESS regression derived values at the given x axis position) were calculated and plotted as corrected ratio. Finally antibodies giving significantly different signals, with values higher or lower than ± 2 × SD (standard deviation calculated from the corrected ratios) were recorded.
The analysis was done for each of three individual experiments separately, and the antibodies that were recorded in at least two separate experiments were selected for antigen specificity determination.
2.2.8. Determination of the Antigen Specificity of
Selected Antibodies
2.2.8.1. Immunoprecipitation The antigen was first immuno-precipitated with the selected antibodies using the Dynabeads protein G immuno-precipitation kit (Invitrogen, San Diego, CA). All steps were carried out using the buffers and instructions supplied by the manufacturer. Briefly, immunoaffinity magnetic beads were prepared for each selected antibody individually by mixing the antibody with protein G coupled dynabeads followed by covalent cross-linking of the bound antibody using dimethoxypropane (DMP). The antigen was immune-precipitated by mixing the immunoaffinity beads with IgG depleted total human plasma, and if this immuno-precipitation was not successful, then it was done with the seven most abundant protein depleted human plasma (Human-7 Multiple Affinity Removal System (MARS) from Agilent Technologies (Santa Clara, CA)) to increase the chance of the antibody to find its antigen. Following incubation to allow antigen binding, the beads with bound antigen were washed and the antigen eluted using elution buffer supplied with the kit. Proteins from the resulting eluate were separated by SDS-PAGE and the gels subjected to coomassie blue or silver staining.
2.2.8.2. Mass-Spectrometry Analysis 2.2.8.2.1. In-Gel Digestion The band(s) corresponding to the specifically immunoprecipitated protein was excised, subjected to in-gel trypsin digestion and the samples processed for mass-spectrometry analysis. The latter was performed at the Laboratory of Proteomics Research at the Biological Research Center of the Hungarian Academy of Sciences (Szeged, Hungary) using a Thermo LCQ Fleet 3D ion trap coupled with Eldex nano-HPLC system. Data were analyzed using Mascot software with default parameters and the searches were restricted to human sequences.
2.2.8.2.2. In Solution Digestion The specifically immune-precipitated proteins were subjected to in-solution trypsin digestion according to a previously described protocol [10] at the Institute of Structural Chemistry at the Chemical Research Center of the Hungarian Academy of Sciences (Budapest, Hungary). The samples were processed for mass-spectrometry (MS) analysis using a QTOF Premier mass spectrometer (Waters, Milford, MA, USA) coupled with a nanoflow UHPLC system (nanoAcquity UPLC, Waters, Milford, MA, USA). MS survey data was processed using ProteinLynx Global Server v.2.3 (Waters, Milford, MA, USA) and searched against version 2011_10 of SwissProt sequence database using Mascot Server version 2.2 (Matrix Science, London, UK). One missed cleavage was allowed, carbamidomethyl cysteine was set as fixed modification and the searches were restricted to human sequences.
2.2.8.3. Western Blot (WB) Analysis Ten μg of human total and MARS-depleted plasma protein samples were separated by SDS-PAGE on 4% - 20% Tris-Glycine gel from Invitrogen (San Diego, CA) under reduced as well as non-reduced conditions, and transferred to a 0.45 μm nitrocellulose membrane (Whatman) by electroblotting. Membranes were blocked for 1 hour in PBS-Tween (pH 7.2) containing 5 mg/ml Polyvinylpyrrolidone (Sigma) and incubated individually with the specific monoclonal antibodies selected from the chip experiments (0.2 or 0.4 µg/ml) overnight. Immunoblots were developed by peroxidase-conjugated anti-mouse antibody from Southern Biotechnology Associates, Inc. (Birmingham, AL) and an ECL detection kit (Pierce (Rockford, IL). Protein bands were detected using different exposure times with a Gel Logic 1500 imaging system and Kodak MI software from Eastman Kodak (Rochester, NY). PageRuler Prestained Protein Ladder (Fermentas, Thermo Fischer Scientific) and MagicMarkXP Western Protein ladder (Invitrogen) were used for molecular weight determination.
2.2.9. ELISA with Commercial Purified Proteins
Ninetysix well plates (Corning 96 well plates, half-area clear polystyrene, high-binding, non-sterile, Sigma) were coated with 30 µl/well of a serial concentration (from 2 µg/ml to 15 µg/ml) of commercial purified proteins at 37˚C for 60 minutes.
Protein was prepared in carbonate coating buffer (15 mM Na2CO3, 35 mM NaHCO3, pH 9.6) or PBS (123 mM NaCl, 3 mM KH2PO4, 10.5 mM Na2HPO4, pH 7.2) for coating depending on its isoelectric point. After washing the plates for 2 times with PBS-Tween buffer (PBS and 0.5 v/v% Tween-20, pH 7.2) wells were blocked at 37˚C for 30 minutes in 60 µl/well of blocking buffer (500 mM NaCl, 3 mM KH2PO4, 10.5 mM Na2HPO4, 0.5 v/v% Tween-20, 0.5 m/m % bovine serum albumin, pH 7.2). After 3 times washing, plates were incubated with serial dilutions of mouse monoclonal antibodies at 37˚C for 60 minutes. All antibody dilutions were done in blocking buffer. Antigen captured antibodies were detected with HRP labeled polyclonal goat anti mouse IgG, Human Adsorbed (GAM-HRP; Southern Biotech, Birmingham, AL, USA) secondary antibody diluted to 1:8000 utilizing TMB (3,3’,5,5’,-tetramethylbenzidine; Sigma). The co-lorimetric reactions were stopped with 30 µl/well of 4n H2SO4, then endpoint measurements were done at 450 nm.
Raw data were imported into Office Excel software for further data manipulations such as background (incubated with blocking buffer instead of plasma samples) correction and plotting.
3. Results
3.1. Selection and Tests on Caelyx Sensitive Serum
Previous studies showed substantial individual and interexperimental variation of C activation by Doxil in NHS in vitro [11,12], highlighting the sensitivity of the assay to individual controlling factors and experimental conditions. This variation necessitated that for our predictive biomarker identification we use serum wherein, under our experimental conditions, Caelyx exerts strong and consistent C activation in comparison with serum wherein the drug is not reactive.
Figure 1 shows the experiments which ensured the presence of these preconditions: in Figure 1(a) we incubated Caelyx with 10 different NHS and found in one relatively high (3-fold, or 200%) rise of SC5b-9 (Figure 1(a)), arrow), indicating relatively “strong” C activation. The rise of SC5b-9 in this Caelyx sensitive serum (CSS) was quantitatively reproduced in 4 independent experiments on different days using the CSS collected at different occasions from the same donor (Figure 1(b)), suggesting that the increased reactivity was an inherent feature of this CSS.
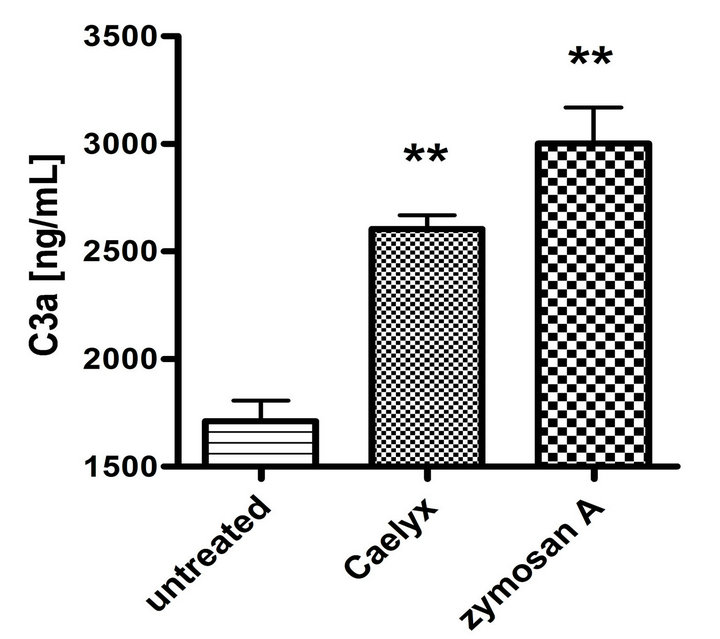
Figure 2 shows that the above described elevation of SC5b-9 in CSS was a manifestation of activation of the whole C cascade, inasmuch as it was associated with elevation of C3a (Figure 2(a)) and C5a (Figure 2(b)), i.e., anaphylatoxins which mediate the clinical symptoms of CARPA. Thus, it could be excluded that the Caelyx-induced rise of SC5b-9 was an isolated protein response in CSS. Finally, Figure 2(c) shows that Caelyx caused eleva-
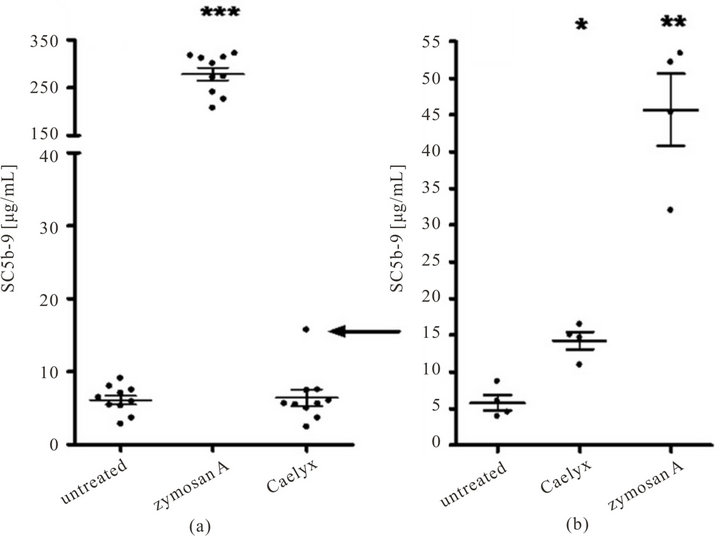
Figure 1. Complement activation by Caelyx in normal human sera, measured by ELISA of SC5b-9 production after 60 min incubation at 37˚C. (a) Measurements done in 10 NHS, Zymosan was used as a positive control at 300 µg/mL final concentration. (b) Four independent experiments as in (a), using the serum which in (a) showed sensitivity to Caelyx (arrow). Serum samples were stored at −80˚C until complement activation and ELISA. Significant differences were established by one way ANOVA (***p < 0.001, **p < 0.01, *p < 0.05).
 (a)
(a)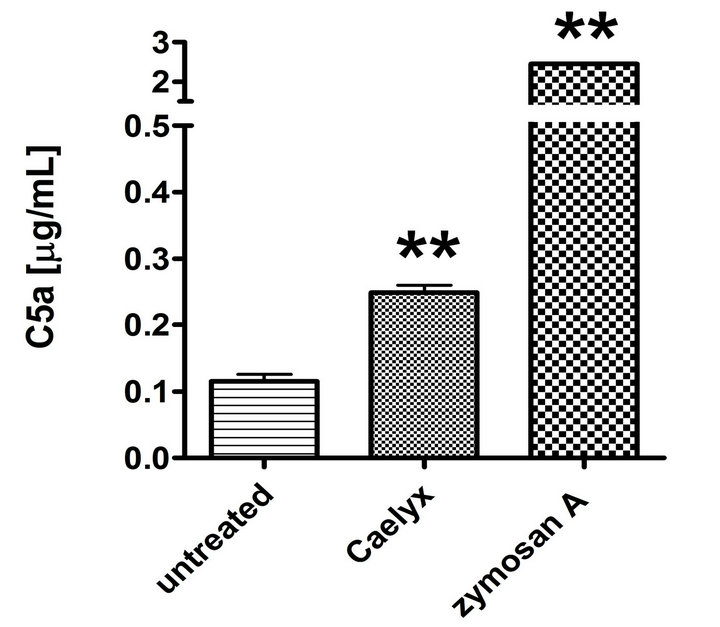 (b)
(b)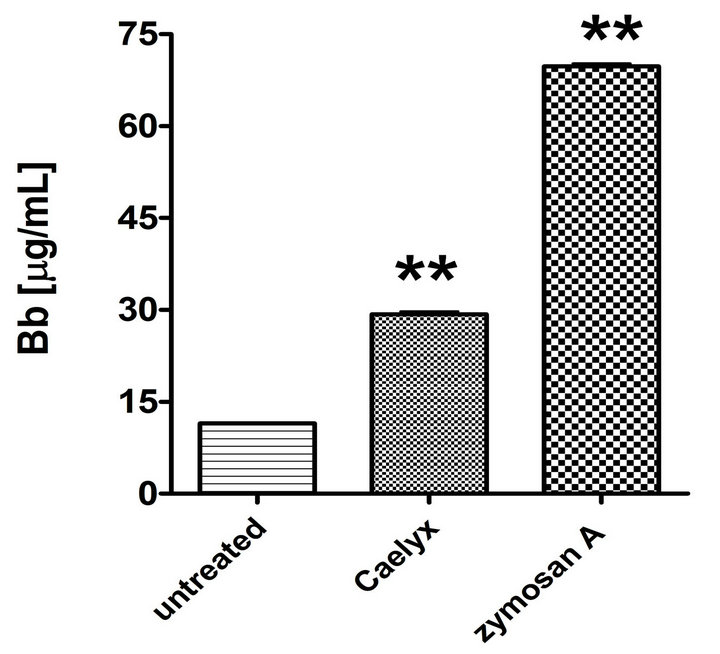 (c)
(c)
Figure 2. Effect of Caelyx on C3a (a), C5a (b) and Bb (c) formation in the CSS identified in Figure 1(a). Serum samples of the Caelyx-reactive donor were treated by Caelyx or zymosan A (300 µg/mL) for 60 min at 37˚C. Bars indicate mean ± SEM of two data points per column. Significant differences were calculated by one way ANOVA (**p < 0.01).
tion of Bb in CSS, providing evidence for the involvement of the alternative pathway in the C activation.
3.1.1. Quality Controlling of Biochip Studies
Two critical parameters characterizing the function of biochips are the number of outliers (SD > Mean/3) and bad spots (threshold > intensity). In our 3 different biochip screenings in this study, both the number of bad spots and the outliers remained below 7%. Their appearance did not show any pattern, however, there were some antibodies where irregularities occurred more frequently than with others. As the antibodies were spotted in each array in triplicates, the presence of one outlier or one bad spot in one triplicate did not have significant effect on the results. However, if in case of one triplicate two spots were bad or outlier, this antibody was not considered in the analysis. The average percent of antibodies that must have been left out from the evaluation in one of the screenings was 8.5%, 1.2% of them had to be left out twice and less than 0.2% of them had to be left out in all three experiments.
3.1.2. Selection of Differentiating Antibodies
Differentiating antibodies were selected as described above. The residuals (differences between the LOESS regression derived and the original ratio values) were plotted as a function of average signal intensity of the two samples for each antibody. Antibodies giving significantly different signals, with values higher or lower than ± 2 × SD (standard deviation calculated from the corrected ratios) were recorded. Figure 3 shows part of one analysis of an experiment when all the antibodies are displayed on the graph and the differentiating ones are listed on the side table. The cognate antigen of 8 antibodies appeared in higher and of 9 antibodies in lower amount in CSS than in the Caelyx insensitive sera. Out of these antibodies, four (Bsi0296, Bsi0790, Bsi1547 and Bsi1328) were selected later as hits.
3.1.3. Determination of Cognate Antigens of the Selected Antibodies
Antigen specificity of the selected antibodies was determined by MS analysis of the immunoprecipitates and results were verified by WB and EIA, using commercially available standard proteins. Immunoprecipitates were separated on SDS-PAGE and bands containing the suspected specific proteins were cut out and subjected to MS analysis (in-gel digestion). When it was difficult or was not possible to determine and pick the specific bands after the SDS-PAGE separation, the whole immunprecipitate was analyzed by MS (in solution digestion). By way of an example, Figure 4 shows the detailed results for Bsi1547. Here, after immunoprecipitation, a single band of >70 kDa appeared (panel A) also the WB showed the specific recognition of a protein of >70 kDa, the concentration of which increased in the plasma sample after depletion of the seven most abundant protein. It was also evident that the antibody recognized only the non-reduced form of the protein, indicating the presence of a structured epitope stabilized by probably several disulphide bonds (Figure 4(b)). MS analysis of
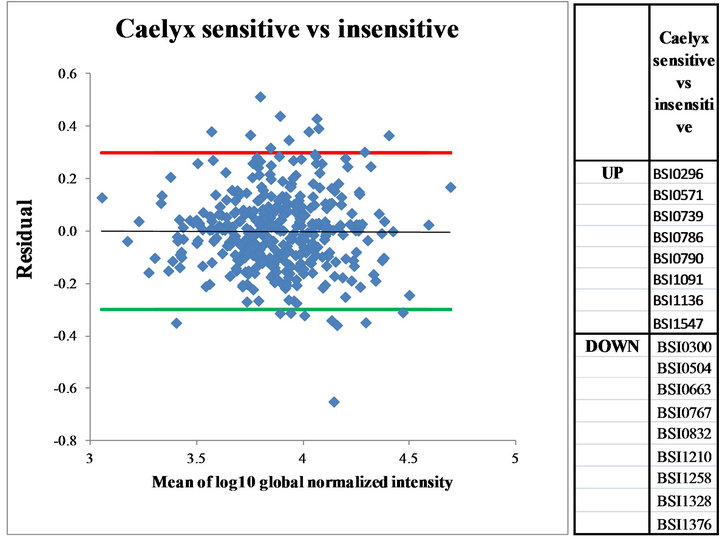
Figure 3. Corrected log10 ratios (Residuals) in the global normalized intensities viewed as the function of the mean global normalized intensities. Residuals giving ± 2SD-fold differences were calculated and set. Antibodies above upper residual (UP) or below lower residual (DOWN) were identified and listed in the right panel.
Figure 4. Identification and validation of the cognate antigen for the monoclonal antibody Bsi1547. (a) Analysis of immunoprecipitate by SDS-PAGE (reduced) followed by Coomassie BB staining: lane 1, immunoprecipitate; lane 2, standard for molecular mass calculation PageRuler Prestained Protein Ladder (Fermentas); (b) Western Blot of different plasma samples: 5 µg each of total (lanes 1, 3) and Hu7 depleted healthy (lanes 2, 4) human plasma samples separated under reduced (1, 2) and non-reduced (3, 4) were probed with Bsi1547 mAb and was developed by ECL. Lane 5 is the Mw markers (Prosieve QuadColor Protein Markers (Lonza)) stained with amidoblack on the membrane. (c) Binding of antibodies to human prothrombin (Sigma) in an indirect EIA. Bsi0365 (human protrombin specifikus mAb); Bsi0185 (isotype matched monoclonal antibody with irrelevant specificity).
the sample showed the presence of several, most likely associated proteins (Table 1) α-2-macroglobulin, prothrombin and complement C3 almost equally represented by the number of identified peptides. From these proteins the molecular weight of protrombin was closest to the size of that of the polypeptide shown up on the gels orrecognized on NC membrane; therefore its identity was verified with an ELISA assay using commercial proteins. From Figure 4(c) it is evident that Bsi1547 recognized
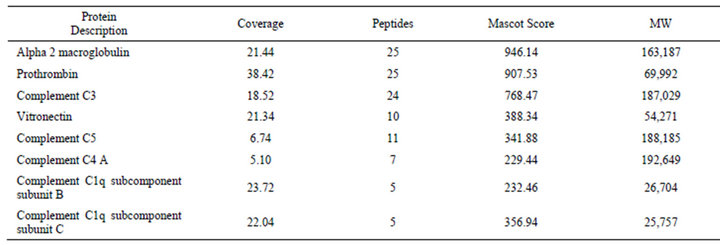
Table 1. Proteins identified from Hu7-depleted plasma immunoprecipitate of Bsi1547 antibody.
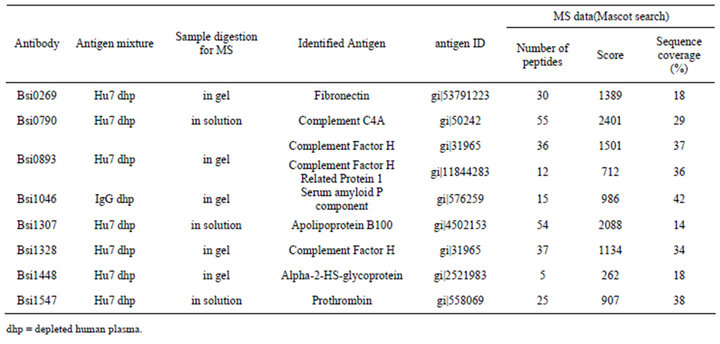
Table 2. Summary of the identified antigens for the selected antibodies with MS-data.
prothrombin just as well as the control prothrombin specific monoclonal antibody.
With similar procedures all the eight antigens for the antibodies were determined, the summary of the MS data are shown in Table 2.
3.1.4. Protein Differences in Reactive vs. Non-Reactive Plasma
Table 3 shows the changes in the representation of the proteins, whose levels were found to be significantly different in CSP relative to one or two out of 3 control non-sensitive plasma samples with spot intensities being higher in sensitive compared to non-sensitive plasma in the case of 7 proteins, and lower in the case of one protein (Table 3). In 2 cases (fH and SAP), the changes were consistent with what is known about the impact of these proteins on C activation, as detailed in the discussion below.
4. Discussion
4.1. Hypersensitivity to Liposomal Doxorubicin: Clinical Aspects
Liposomal doxorubicin (Doxil/Caelyx) is the first “nanodrug” approved by the FDA [13] initially (in 1995) for AIDS-related Kaposi’s sarcoma, and later, for ovarian cancer and myeloma multiplex. Its use in cancer chemotherapy has been rising over the years, and, as shown by the high number (~400) of completed or ongoing clinical trials testing its single or combination use in various cancers [14], its clinical application is expected to further rise in the future.
Hypersensitivity, or infusion reaction to Doxil is one of the early recognized [15-20], yet until today unsolved adverse immune effect of this drug. Most recent statistics specify the occurrence of HSR to Doxil in up to 10% of cancer patients [21], which, based on publicly available
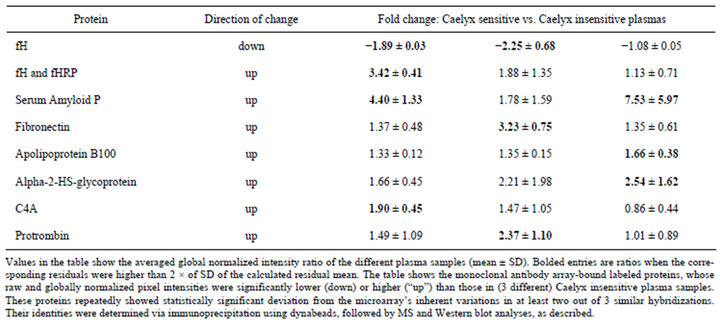
Table 3. Protein representation changes in Caelyx sensitive relative to Caelyx insensitive plasmas.
drug cost and sale figures, projects the number of reactions in a year roughly in the 104th order. Serious and sometimes fatal allergic/anaphylactoid-like infusion reactions have also been reported [21], which unfortunate facts highlight the clinical significance of a predictive laboratory test that may eliminate this risk.
4.2. The Role of Complement Activation: The CARPA Concept
Hypersensitivity reactions to Doxil and other liposomes were previously shown to arise, at least in part, from the capability of liposomes to cause C activation. Hence, the phenomenon was called C activation-related pseudoallergy (CARPA) [5,11,16,22-24]. An early clinical study analyzing the correlation between C activation in vivo and rise of clinical symptoms in cancer patients treated with Doxil for the first time established that the plasma levels of SC5b-9 (S-protein-bound C terminal complex), a marker of C activation, correlate with the presence and severity of symptoms only in case of “strong” C activation, roughly defined as several-fold rise of SC5b-9 over baseline [16]. It follows from this observation that C activation may be a contributing factor to HSRs, a cotrigger, only above certain threshold level of activation. Consequently, only those people may be susceptible to CARPA in whom Doxil/Caelyx activates C above this threshold. Hence, a search for (a) biomarker (s) needed to be done in blood wherein Doxil/Caelyx activates C to the above defined degree. Accordingly, the first goal of this study that we had to reach was to identify a human blood donor in whose serum Caelyx caused C activation resulting several-fold increase of SC5b-9, which we referred to as Caelyx-sensitive serum (CSS).
The experiment serving this goal, i.e., incubation of Caelyx with 10 NHS showed 1 CSS, which ratio, by and large corresponds to the ratio of HSRs to Doxil (10%). Nevertheless it needs to be pointed out that the ratio of Doxil reactive sera and extent of C activation by Doxil in different human sera shows substantial inter-experimental variation in vitro as the source and age of liposomal doxorubicin [11,12], possible presence of aggregates [25] and the treatment of blood and sera can all influence the results, just as the incubation conditions. During the experiment presented here special attention was paid to storage of sera and plasma at -80˚C, thawing sera at 37˚C for C activation assays and aliquoting and diluting Caelyx under sterile conditions.
After finding a CSS as detailed above, we set out to pursue the original, “innovative” research for finding biomarkers of extensive C activation in the plasma of this CSS donor, by applying monoclonal antibody proteomics on the plasma of this donor.
4.3. Plasma Proteome Profiling with Monoclonal Antibody Libraries
Biosystems International’s monoclonal antibodies are made against mixtures of native human plasma proteins therefore these antibodies are able to recognize accessible epitopes on these polypeptides. Proteins in their native configuration, harbor numerous potential post-translational modifications and carry the imprints of their also numerous interactions with other (macro) molecules including other proteins. Our goal in creating the mAb set for plasma profiling was to cover the natural, and importantly, accessible, epitopes with antibodies. Certainly, as the plasma proteome may contain up to 10 thousands of proteins and obviously several-fold more epitopes, PlasmaScan 380TM covers only a small part of all available epitopes. However, considering that the low abundant protein species (<500 ng/ml) compartment of the human plasma is not accessible for profiling with this methodology, the epitope coverage of medium and highly abundant proteins (about 100 in total) is relatively higher. Nevertheless, the tool can already demonstrate the idea behind this type of experimentation: these antibodies are primarily planned to be used in experiments where no pre-conception is set toward antibody specificity and so these antibodies can serve as discovery tools capable of targeting high—as well as medium-abundant analytes in complex, fractionated or non-fractionated proteomes. The resolution of such proteome profiling efforts correlate directly with the number of antibodies included and specificity becomes important if new discoveries have been made. Therefore the intended use of such a tool is to do the profiling experiment first, then characterize the selected target later using individual mAbs from the discovery tool.
4.4. Experimental Strategy
Based on the above, during the course of this study we first determined which of the antibodies recognize target proteins, the appearance of which was reproducibly different in Caelyx sensitive vs. non-sensitive plasma. Because of the previously experienced substantial individual and inter-experimental variation of C activation by Doxil in NHS in vitro, special attention was paid to reproducibility both in selecting a CSS and mAbs on the chips that tagged HSR-specific marker proteins. Thus, the extent of C activation by Caelyx in CSS was confirmed in three independent experiments, as was the profiling of CSP versus Caelyx insensitive plasmas with the PS380 microarray. In the latter studies 8 antibodies showed differences which were consistent and statistically significant in at least in two experiments out of three. In the following steps the cognate antigens (protein ID) of the antibodies were determined via immune-precipitation followed by MS, WB or other biochemical verification.
4.5. Biomarker Candidates: Rationalizations
of Findings With the above mentioned procedures eight potential biomarkers were identified. Among these, the protein change that made most “biological sense” is the decrease of fH in CSP, which is in keeping with the known role of this C control glycoprotein in health and disease. Factor H is a natural inhibitor of C activation via the alternative pathway, and, as shown in Figure 1(c), Caelyx activated C in CSS, at least in part, via the alternative pathway. Thus, at reduced fH levels one expects increased C activation by Caelyx via the alternative pathway.
The primary function of fH in the body is the prevention of C activation on host cells by possessing both cofactor activity for Factor I-mediated C3b cleavage, and decay accelerating activity against the alternative pathway C3-convertase, C3bBb. Consistent with its potential use as a HSR predictor, reduced fH levels or fH dysfunction were previously associated with radiocontrast reactions [26,27] and allergen-induced airway hyperresponsiveness [28]. Because fH can be measured by commercial ELISA, it is a relatively easily accessible, realistic biomarker if further studies validate its use in predicting HSRs to Caelyx or other pseudo allergic drugs.
As for the increase of SAP in CSP, SAP is a 25 kDa pentameric protein, member of the pentraxins family, a constituent of amyloid deposits causing amyloidoses. The latter diseases are characterized by the ordered aggregation of normal globular proteins and peptides into insoluble fibers in various tissues. The flattened β-sheet structure of SAP is similar to that found in lectins, which can mediate C activation, just as C-reactive protein (CRP), with which human SAP has 51% sequence homology. Based on these considerations it is possible that increased SAP may be a contributing factor to the increased C activation by Caelyx in CSS.
The rise of fibronectin in CSP may also reflect C activation proactivity, inasmuch as fibronectin is one of the proteins that readily bind to liposomes exposed to plasma, and it is well known that the protein “corona” of liposomes [29] has a major impact on their properties and fate, including C activation [30].
Alpha-2-HS glycoprotein (A2HSG), also known as fetuin-A, is a Ca2+-binding plasma glycoprotein that is best known for its involvement in brain and bone tissue development [31]. Ca2+ is a known regulator of C activation, and, importantly, the serum level of A2HSG showed significant correlation with C3 levels in SLE [32]. Nevertheless, this information is not sufficient to make hypotheses on why its increase in CSP would promote hypersensitivity to liposomes, just as the increases of fH or fHRP.
As for the elevated prothrombin level in CSP, a complex crosstalk between the coagulation cascade and Cactivation at different levels is well known [33,34], and was established specifically to radiocontrast-induced HSRs too [35]. In particular, thrombin is a potent anaphylatoxin generator via direct cleaving of C5 (substituting C3-dependent C5 convertase) [36]; an effect that generated previously not documented intermediates of C5 C5(T) and C5b(T) [37]. The phenomenon is being considered as a new pathway of C activation [36]. In addition, thrombin also generates C3a when incubated with native C3 [33], so it is possible that increased level of prothrombin promotes C activation as an extra thrombin reserve. In our study WB and ELISA clearly showed that our antibody specifically recognized prothrombin, yet the immune-precipitates also contained large amounts of alpha-2 macroglobulin (A2M, Table 1). A2M is a general enzyme inhibitor that also inhibits, among others, C1 [38]. It is therefore a further possibility that prothrombin interferes with inhibition of the activation of C via A2M, ultimately leading to increased activation.
Regarding the elevation of C4 in CSP, although this protein is a key player in classical pathway C activation, its two-fold change may probably not be considered as a biomarker. This is because of the known variation of C4 gene copy number in men, resulting in a wide range of C4 plasma protein concentrations among healthy subjects which could cover an order of magnitude [39,40].
Likewise, it is difficult to attribute biological relevance to the demonstrated changes in apolipoprotein B, as it is a highly abundant protein, a key structural component of lipoproteins [41] whose level in blood shows much greater biological variation than the difference detected in our study.
In summarizing the above facts and considerations, some of the protein changes in CSP are consistent with proneness for increased C activation, while others are difficult to fit in this paradigm, at least on the basis of our current knowledge on the function of these proteins. However, it should also be pointed out that the relationship between protein function and amount, estimated in our assay on the basis of epitope detection, is not straightforward. Our antibodies may recognize epitopes involved in the function of proteins, as well as well as non-functional epitopes, and the functional epitopes detected may represent neoepitopes associated with increased or decreased function. Thus, at this time it cannot be a priori stated that a rise or decrease of a protein in our assay actually reflects increased or decreased function.
5. Conclusions
This study explores possible predictive biomarkers for Caelyx-induced HSRs, using a promising new method of biomarker identification. Without any pre-set conception we identified some potential markers, which, alone or in combination, might be useful in the prevention of an unsolved clinical problem affecting up to 10% of cancer patients treated with Doxil or Caelyx, as well as thousands of other patients treated with pseudoallergy-causing drugs, in whom CARPA is a life-danger or a barrier to therapy.
The present work was conceived as a pilot, “feasibility” study and not for providing clinical evidence for the use of any of the selected biomarkers. We realize the need for extending the tests to a large number of CSS/ CSP and, if the proteins identified to date hold up in further analyses, their use will need to be validated in clinical studies. The purpose of the report at this stage was to highlight the complex methodical approach of biomarker identification for CARPA, its various steps and checks, whose communication at an early stage will hopefully help progress in this field.
6. Acknowledgements
This work was partly supported by the National Office for Research and Technology (now National Development Agency) of Hungary (CARPA777, TECH-09-A1- 2009-0113 (to Biosystems International Ltd), mAbCHIC, and TECH-08-D1-2008-0030 “NANOMEDI”). Further support by TÁMOP-4.2.1.B-10/2/KONV-2010-0001 and 4-2-1 B-9/1/KMR are also acknowledged, as well as the generous support for the Nanomedicine Research and Education Center by Gedeon Richter NyRT.
REFERENCES
- J. Szebeni, “Complement Activation-Related Pseudoallergy: A New Class of Drug-Induced Immune Toxicity,” Toxicology, Vol. 216, No. 2-3, 2005, pp. 106-121.
- J. Szebeni, “Hemocompatibility Testing for Nanomedicines and Biologicals: Predictive Assays for Complement Mediated Infusion Reactions,” European Journal of Nanomedicine, Vol. 4, No. 1, 2012, pp. 33-53.
- J. Szebeni, “Complement Activation-Related Pseudoallergy Caused by Liposomes, Micellar Carriers of Intravenous Drugs and Radiocontrast Agents,” Critical Reviews in Therapeutic Drug Carrier Systems, Vol. 18, No. 6, 2001, pp. 567-606. doi:10.1615/CritRevTherDrugCarrierSyst.v18.i6.50
- J. Szebeni, “Complement Activation-Related Pseudoallergy: Mechanism of Anaphylactoid Reactions to Drug Carriers and Radiocontrast Agents,” 2004, pp. 399-440.
- J. Szebeni, F. Muggia, G. Gabizon and Y. Barenholz, “Activation of Complement by Therapeutic Liposomes and Other Lipid Excipient-Based Therapeutic Products: Prediction and Prevention,” Advancerd Drug Delivery Reviews, Vol. 63, No. 12, 2011, pp. 1020-1030. doi:10.1016/j.addr.2011.06.017
- D. Wang, M. Hincapie, M. Guergova-Kuras, J. Kadas, L. Takacs and B. L. Karger, “Antigen Identification and Characterization of Lung Cancer Specific Monoclonal Antibodies Produced by mAb Proteomics,” Journal of Proteome Research, Vol. 9, No. 4, 2010, pp. 1834-1842. doi:10.1021/pr900997z
- M. Guergova-Kuras, I. Kurucz, W. Hempel, N. Tardieu, J. Kádas, C. Malderez-Bloes, A. Jullien, Y. Kieffer, M. Hincapie, A. Guttman, E. Csánky, B. Dezso, B. Karger, L. Takács, “Discovery of Lung Cancer Biomarkers by Profiling the Plasma Proteome with Monoclonal Antibody Libraries,” Molecular and Cellular Proteomics, Vol. 10, No. 12, 2011, Article ID: M111.010298.
- E. Csanky, P. Olivova, E. Rajnavolgyi, W. Hempel, N. Tardieu, E. Katalin, A. Jullien, C. Malderez-Bloes, M. Kuras, M. X. Duval, L. Nagy, B. Scholtz, W. Hancock, B. Karger, A. Guttman and L. Takacs, “Monoclonal Antibody Proteomics: Discovery and Prevalidation of Chronic Obstructive Pulmonary Disease Biomarkers in a Single Step,” Electrophoresis, Vol. 28, No. 23, 2007, pp. 4401- 4406. doi:10.1002/elps.200700256
- R. D. C. Team, “R: A Language and Environment for Statistical Computing,” R Foundation for Statistical Computing, Vienna, 2010.
- L. Turiák, O. Ozohanics, F. Marino, L. Drahos and K. Vékey, “Digestion Protocol for Small Protein Amounts for Nano-HPLC-MS(MS) Analysis,” Journal of Proteomics, Vol. 74, No. 7, 2011, pp. 942-947. doi:10.1016/j.jprot.2011.01.007
- J. Szebeni, B. Baranyi, S. Savay, L. U. Lutz, E. Jelezarova, R. Bunger and C. R. Alving, “The Role of Complement Activation in Hypersensitivity to Pegylated Liposomal Doxorubicin (Doxil®),” Journal of Liposome Research, Vol. 10, No. 4, 2000, pp. 347-361. doi:10.3109/08982100009031112
- J. Szebeni, P. Bedőcs, Z. Rozsnyay, Z. Weiszhár, R. Urbanics, L. Rosivall, R. Cohen, O. Garbuzenko, G. Báthori, M. Tóth, R. Bünger and Y. Barenholz, “Liposome-Induced Complement Activation and Related Cardiopulmonary Distress in Pigs: Factors Promoting Reactogenicity of Doxil and AmBisome,” Nanomedicine NBM, Vol. 8, No. 2, 2012, pp. 176-184. doi:10.1016/j.nano.2011.06.003
- Y. Barenholz, “Doxil—The First FDA-Approved NanoDrug: From and Idea to Product,” In: D. Peer, Ed., Handbook of Harnessing Biomaterials in Nanomedicine, Pan Standford Publishing Pte. Ltd., Singapure, 2012, pp. 335- 398.
- ClinicalTrials, “ClinicalTrials.gov,” 2011.
- D. S. Alberts and D. J. Garcia, “Safety Aspects of Pegylated Liposomal Doxorubicin in Patients with Cancer,” Drugs, Vol. 54, No. 4, 1997, pp. 30-45. doi:10.2165/00003495-199700544-00007
- A. Chanan-Khan, J. Szebeni, S. Savay, L. Liebes, N. M. Rafique, C. R. Alving and F. M. Muggia, “Complement Activation Following First Exposure to Pegylated Liposomal Doxorubicin (Doxil): Possible Role in Hypersensitivity Reactions,” Annals of Oncology, Vol. 14, No. 9, 2003, pp. 1430-1437.doi:10.1093/annonc/mdg374
- A. A. Gabizon and F. M. Muggia, “Initial Clinical Evaluation of Pegylated Liposomal Doxorubicin in Solid Tumors. In: M. C. Woodle and S. G. Austin, Eds., LongCirculating Liposomes: Old Drugs, New Therapeutics, Landes Bioscience, Texas, 1998, pp. 155-174.
- O. Lyass, B. Uziely, R. Ben-Yosef, D. Tzemach, N. I. Heshing, M. Lotem, G. Brufman and A. A. Gabizon, “Correlation of Toxicity with Pharmacokinetics of Pegylated Liposomal Doxorubicin (Doxil) in Metastatic Breast Carcinoma,” Cancer, Vol. 89, No. 5, 2000, pp. 1037- 1047. doi:10.1002/1097-0142(20000901)89:5<1037::AID-CNCR13>3.0.CO;2-Z
- K. M. Skubitz, A. P. Skubitz, “Mechanism of Transient Dyspnea Induced by Pegylated-Liposomal Doxorubicin (Doxil),” Anticancer Drugs, Vol. 9, No. 1, 1998, pp. 45- 50. doi:10.1097/00001813-199801000-00005
- B. Uziely, S. Jeffers, R. Isacson, K. Kutsch, D. Wei-Tsao, Z. Yehoshua, E. Libson, F. M. Muggia and A. Gabizon, “Liposomal Doxorubicin: Antitumor Activity and Unique Toxicities during Two Complementary Phase I Studies,” Journal of Clinical Oncology, Vol. 13, No. 7, 1995, pp. 1777-1785.
- Doxil, “Package Insert,” 2012. http://www.doxil.com
- J. Szebeni, L. Baranyi, S. Savay, J. Milosevits, R. Bunger, P. Laverman, J. M. Metselaar, G. Storm, A. Chanan-Khan, L. Liebes, F. M. Muggia, R. Cohen, Y. Barenholz and C. R. Alving, “Role of Complement Activation in Hypersensitivity Reactions to Doxil and HYNIC-PEG Liposomes: Experimental and Clinical Studies,” Journal of Liposome Research, Vol. 12, No. 1-2, 2002, pp. 165-172. doi:10.1081/LPR-120004790
- J. Szebeni, L. Baranyi, S. Sávay, M. Bodó, J. Milosevits, C. R. Alving and R. Bünger, “Complement ActivationRelated Cardiac Anaphylaxis in Pigs: Role of C5a Anaphylatoxin and Adenosine in Liposome-Induced Abnormalities in ECG and Heart Function,” American Journal of Physiology, Vol. 290, No. 3, 2006, pp. H1050- H1058.
- S. M. Moghimi, I. Hamad, T. L. Andresen, K. Jörgensen and J. Szebeni, “Methylation of the Phosphate Oxygen Moiety of Phospholipid-methoxy(polyethylene glycol) Conjugate Prevents PEGylated Liposome-Mediated Complement Activation and Anaphylatoxin Production,” FASEB Journal, Vol. 20, No. 14, 2006, pp. 2591-2593. doi:10.1096/fj.06-6186fje
- G. Milosevits, Z. Rozsnyay, G. T. Kozma, J. Milosevits, G. Tömöry, H. Robotka, L. Rosivall, J. Szebeni, “Flow Cytometric Analysis of Supravesicular Structures in Doxorubicin-Containing Pegylated Liposomes,” Chemistry and Physics of Lipids, Vol. 165, No. 4, 2012, pp. 482-487. doi:10.1016/j.chemphyslip.2011.11.012
- P. Lieberman, R. L. Siegle and G. Treadwell, “Radiocontrast Reactions,” Clinical Reviews in Allergy, Vol. 4, No. 2, 1986, pp. 229-245.
- P. Lieberman, “Anaphylactoid Reactions to Radiocontrast Materia,” Clinical Reviews in Allergy, Vol. 9, No. 3-4, 1991, pp. 319-338.
- K. Takeda, J. M. Thurman, S. Tomlinson, M. Okamoto, Y. Shiraishi, V. P. Ferreira, C. Cortes, M. K. Pangburn, V. M. Holers and E. W. Gelfand, “The Critical Role of Complement Alternative Pathway Regulator Factor H in Allergen-Induced Airway Hyperresponsiveness and Inflammation,” Journal of Immunology, Vol. 188, No. 2, 2012, pp. 661-667. doi:10.4049/jimmunol.1101813
- A. Capriotti, G. Caracciolo, C. Cavaliere, C. Crescenzi, D. Pozzi, A. Lagana, “Shotgun Proteomic Analytical Approach for Studying Proteins Adsorbed onto Liposome Surface,” Analytical and Bioanalytical Chemistry, Vol. 401, No. 4, 2011, pp. 1195-1202. doi:10.1007/s00216-011-5188-8
- S. M. Moghimi and J. Szebeni, “Stealth Liposomes and Long Circulating Nanoparticles: Critical Issues in Pharmacokinetics, Opsonization and Protein-Binding Properties,” Progress in Lipid Research, Vol. 42, No. 6, 2003, pp. 463-478.doi:10.1016/S0163-7827(03)00033-X
- A. Heiss, T. Eckert, A. Aretz, W. Richtering, W. van Dorp, C. Schäfer and W. Jahnen-Dechent, “Hierarchical Role of Fetuin-A and Acidic Serum Proteins in the Formation and Stabilization of Calcium Phosphate Particles,” Journal of Biological Chemistry, Vol. 283, No. 21, 2008, pp. 14815- 14825. doi:10.1074/jbc.M709938200
- L. Kalabay, L. Jakab, K. Cseh, T. Pozsony and L. A. Jakab, “Correlations between Serum Alpha 2-HS-glycoprotein Concentration and Conventional Laboratory Parameters in Systemic Lupus Erythematosus,” Acta Medica Hungarica, Vol. 47, No. 1-2, 1990, pp. 53-64.
- U. Amara, D. Rittirsch, M. Flierl, U. Bruckner, A. Klos, F. Gebhard, J. D. Lambris and M. Huber-Lang, “Interaction between the Coagulation and Complement System,” Advances in Experimental Medicine and Biology, Vol. 632, 2008, pp. 68-76. doi:10.1007/978-0-387-78952-1_6
- M. M. Markiewski, B. Nilsson, K. N. Ekdahl, T. E. Mollnes and J. D. Lambris, “Complement and Coagulation: Strangers or Partners in Crime?” Trends in Immunology, Vol. 28, No. 4, 2007, pp. 184-192. doi:10.1016/j.it.2007.02.006
- E. C. Lasser, J. Slivka, J. H. Lang, W. P. Kolb, S. G. Lyon, A. E. Hamblin and G. Nazareno, “Complement and Coagulation: Causative Considerations in Contrast Catastrophies,” American Journal of Roentgenology, Vol. 132, No. 2, 1979, pp. 171-176. doi:10.2214/ajr.132.2.171
- M. Huber-Lang, J. V. Sarma, F. S. Zetoune, D. Rittirsch, T. A. Neff, S. R. McGuire, J. D. Lambris, R. L. Warner, M. A. Flierl, L. M. Hoesel, F. Gebhard, J. G. Younger, S. M. Drouin, R. A. Wetsel and P. A. Ward, “Generation of C5a in the Absence of C3: A New Complement Activation Pathway,” Nature Medicine, Vol. 12, No. 6, 2006, pp. 682-687.
- M. J. Krisinger, V. Goebeler, Z. Lu, S. C. Meixner, T. Myles, E. L. Pryzdial and E. M. Conway, “Thrombin Generates Previously Unidentified C5 Products That Support the Terminal Complement Activation Pathway,” Blood, Vol. 120, No. 8, 2012, pp. 1717-1725.
- P. C. Harpel, “Human Plasma Alpha2-macroglobulin. An Inhibitor of Plasma Kallikrein,” The Journal of Experimental Medicine, Vol. 132, No. 2, 1970, pp. 329-352. doi:10.1084/jem.132.2.329
- G. J. O’Neill and B. Dupont, “Serum C4 Levels, Chido, Rodgers, and Allotypes of C4 Component of Complement,” Transplantation Proceedings, Vol. 11, No. 1, 1979, pp. 1102-1106.
- Y. Yang, E. K. Chung, B. Zhou, C. A. Blanchong, C. Y. Yu, G. Füst, M. Kovács, A. Vatay, C. Szalai, I. Karádi and L. Varga, “Diversity in Intrinsic Strengths of the Human Complement System: Serum C4 Protein Concentrations Correlate with C4 Gene Size and Polygenic Variations, Hemolytic Activities, and Body Mass Index,” Journal of Immunology, Vol. 171, No. 5, 2003, pp. 2734-2745.
- S. Marcovina and C. J. Packard, “Measurement and Meaning of Apolipoprotein AI and Apolipoprotein B Plasma Levels,” Journal of Internal Medicine, Vol. 259, No. 5, 2006, pp. 437-446. doi:10.1111/j.1365-2796.2006.01648.x
NOTES
*Corresponding author.