Advances in Nanoparticles
Vol. 1 No. 3 (2012) , Article ID: 25208 , 4 pages DOI:10.4236/anp.2012.13012
One-pot Synthesis of TiO2 Nanoparticles in Suspensions for Quantification of Titanium Debris Release in Biological Liquids
1C-BIOSENSS, Clermont Université, Université d’Auvergne, Clermont Ferrand, France
2CRMD, CNRS, Université d’Orléans, Chartres, France
Email: komla.awitor@udamail.fr
Received September 16, 2012; revised October 28, 2012; accepted November 6, 2012
Keywords: Titanium Dioxide Nanotube Layer; TiO2 Nanoparticles; Debris Release; Biological Matrix; Inductively Coupled Plasma Atomic Emission Spectroscopy
ABSTRACT
In this work we have developed an analytical method to measure potential titanium debris released from TiO2 nanotube layers devices immersed in biological fluids. This quantitative study is highly required to ensure both the security and non toxicity of the nanostructured surfaces used as future implantable medical devices in the living. A one-pot synthesis process is developed to produce high quality standard solutions of titanium dioxide nanoparticles in aqueous medium. The elaborated dispersion is then used to fabricate standard solutions in both aqueous and human blood plasma media. The synthesized nanoparticles dispersion was characterized by granulometry. The nanoparticles structure and morphology were then observed using Transmission Electron Microscopy (TEM). Thermogravimetric Analysis (TGA) was used to evaluate the concentration of TiO2 in the suspension. A quantitative routine by the use of Inductively Coupled Plasma Atomic Emission Spectroscopy (ICP-AES) is developed. The quantification threshold of titanium species is found to be in the 30 - 40 ppb range. None interference is detected between the particles and the human blood plasma. Using the established quantitative routine, the titanium species release from titania nanotube layers in human blood plasma is evaluated.
1. Introduction
Nanotextured materials with the required surface properties are promising candidates to develop the implantation of new kind of biocompatible platforms in the living. Titanium dioxide nanotube layer is an active field of research concerning antibacterial efficacy [1], orthopedic [2], and dental surgery [3], drug delivery platforms [4], tissue regeneration [5-9] and implants [10]. The behavior of the nanostructured implants in the living is currently not well known. Numerous studies relate the toxicity of titanium dioxide nanoparticles in the living [11-13]. However, as far as we know, few studies are dedicated to the quantification of potential metallic release from the implanted device surface and their underlying potential toxicity. Works need to be done in order to ensure the biological security of such future nanostructured medical devices implanted in the living [14]. Debris from a likely wear in the living of these devices could be hazardous to human health. In this work, we develop a quantitative method to measure possible metallic debris released from the use of TiO2 nanotube layers as future nanostructured medical implants. This quantitative method using Inductively Coupled Plasma Atomic Emission Spectroscopy (ICP-AES) requires well defined TiO2 standard solutions commercially unavailable. So we have developed a onepot synthesis of nanoparticles dispersion in an aqueous medium. The physico-chemical properties of the nanoparticles in dispersion are investigated by granulometry, transmission electron microscopy and thermogravimetry. Different standard solutions are made by dilution from the native dispersion and assayed by inductively coupled plasma atomic emission spectroscopy (ICP-AES). Calibration lines are obtained and the method is checked in term of linearity, accuracy and repeatability. The possible influence of the human blood plasma matrix on the ICP analytical results is also investigated. To simulate the release, nanotube layers samples were immersed in human blood plasma under magnetic stirring at 37˚C, and the titanium species concentration in the liquid is followed by the established quantification method.
2. Experimental Section
2.1. Synthesis of Stable Suspension of TiO2 Nanoparticles
The starting precursor solution was 5 mL titanium IV isopropoxide 97% supplied by Sigma Aldrich mixed with 15 mL isopropanol (from Rhônes Poulenc) under a vigorous stirring. A 200 mL HNO3 0.01 M solution was used as an acid hydrolysis catalyst. The nanoparticles preparation started up with the quick addition of the hydrolysis solution heated to 80˚C in the precursor solution under vigorous stirring. The spontaneous hydrolysis of the titanium isopropoxide leads to a turbid white solution which was heated under reflux for almost 48 hours (peptidization process). After this peptidization step, some tartric acid powder supplied by Rhônes Poulenc was added to the white mixture in order to graft a carboxylic acid as surfactant on the oxide nanoparticles surface. The white, opaque resulting mixture was cooled down to room temperature. A few drops of Rhônes Poulenc triethylamine were added under stirring: the opaque, settling solution turned to a clear, soft blued aqueous suspension of TiO2 nanoparticles.
2.2. Granulometry Study of the Suspension
Granulometry studies are achieved by using the Nano Sizer S90 model (Malvern Instrument ltd.). In order to define the influence of the pH of the carrying liquid on the nanoparticles aggregate states, different samples were analysed by varying the pH from 3 to 10. A first sample with the highly measurable concentration is prepared and then different amounts of acid or base are added in order to vary the pH.
2.3. Transmission Electron Microscopy Analysis of the Suspension
The morphology and the particles sizes were characterized using a Philips CM 20 transmission electron microscope (TEM). The accelerating voltage was 200 kV. The samples were dispersed in methanol by ultrasonication. A drop of the suspension was then laid on a carbon-coated grid and dried. Selected area electron diffraction (SAED) was performed to determine the crystallinity of the structure. The interplanar distances were evaluated from the SAED patterns using the following formula:
 (1)
(1)
where λL is a constant of the microscope, R is the ring radius, and d is the interplanar distance. The constant of the microscope was calculated by measuring the radius of a gold standard pattern which interplanar distances are well documented in scientific publications.
2.4. Thermogravimetric Analysis of the Nanoparticles Suspension
The thermogravimetric analysis was carried out using the TGA 4000 thermogravimetric analyser (Perkin Elmer instrument). The analysis was performed at a heating rate of 5˚C/min under a 40 mL/min N2 gas flow. Prior to the TGA tests, a designated volume of 50 mL of the white, opaque acid tartric grafted mixture was centrifuged at 7000 rpm during 10 minutes. The clear supernatant was removed and the wet TiO2 grafted tartric acid nanopowder was dried at 110˚C overnight. As a reference 20 mg TiO2 nanopowder supplied by Sigma Aldrich has also been analyzed.
2.5. Synthesis of TiO2 Nanotube Layers
The main goal of this part is to obtain TiO2 nanostructured surface in order to study the potential titanium species release in biological fluids. To fabricate anodic TiO2 nanotube layers, Ti foils, 99.6% purity, 0.25 mm thick, supplied by Good-fellow are used. The foils are successively degreased in trichloroethylene, methyl alcohol, acetone and deionized water baths under sonication for 5 minutes. The drying is made under nitrogen flush. The anodization process is carried out at 20˚C in 0.4 wt% HF aqueous solution, under an anodizing voltage maintained at 20 volts during 20 minutes. Just after the anodization, samples are rinsed in deionized water, flushed under nitrogen and dried in an oven at 100˚C for 10 minutes. Finally, the anodized foils are cooled down to room temperature in a desiccator.
2.6. TiO2 Nanotube Layer Surface Characterization
The morphological study of the nano-structured surfaces was carried out using a Zeiss Supra 55 VP scanning electron microscope (SEM) with secondary emission and in lens detector. The accelerating voltage and working distance are respectively 5 kV and 3 mm.
2.7. Inductively Coupled Plasma Atomic Emission Spectroscopy
Inductively Coupled Plasma Atomic Emission Spectroscopy analysis was carried out using a Varian Liberty II apparatus under the operating conditions given in Table 1. To increase the results accuracy, three emitting wavelengths of the titanium are used for quantification at 334.941, 336.121 and 337.280 nm respectively.
2.8. Titanium Species release Quantification from TiO2 Nanotube Layers
In order to quantify the potential titanium release in human blood plasma, 3 anodized samples (0.5 cm × 2 cm)

Table 1. Instrumental operating conditions.
are immersed in 25 mL of human blood under magnetic stirring at 70 rpm. Each closed vial is kept at 37˚C in a thermostatic bath. A non-anodized titanium foil is used as a reference and dipped in the same conditions. A volume of 3 mL of solution is collected after the 2-day stirring and assayed by ICP in order to obtain the kinetic of release.
3. Results and discussion
3.1. Synthesis of Homogeneous Suspension of TiO2 Nanoparticles
Functionalized crystalline TiO2 nanoparticles in suspension have been synthesized by a derivated sol-gel process at low temperature. Figure 1 shows the proposed method for a one-pot synthesis of homogeneous suspension of TiO2 nanoparticles in an aqueous medium. The process begins by hydrolysis and condensation of titanium alkoxide specie, which the inorganic TiO2 core is made of. This step was followed by grafting a carboxylic acid as surfactant on the oxide nanoparticle surface. Finally the organic treatment was carried out by adding triethylamine into the mixture. This chemical functionalization of the surface provides the required stable dispersion of the particles in the aqueous medium, leading to a soft blued aqueous suspension of TiO2 nanoparticles.
Different synthesis methods lead to nanopowders with sharp sized distribution. The main problem occurs at the dispersion step of these nanopowders into water or water based solutions. The aggregative state is so high that it leads to turbid, opalescent and fairly stable solutions. Such settling solutions are not suitable for developing rigorous quantitative measurements. On the other hand, the use of commercial dispersion is not appropriate: the chemical compatibility between the turbid commercial product and the aqueous medium is low, so the dilutions cannot be used for quantitative analysis. In order to cope with this key problem of the required stability of the standard solution, we used a one-pot synthesis of TiO2 nanoparticles dispersion in an aqueous medium. This method solves the problem of the turbidity and settlement generated by the nanopowder dispersion in liquid. This gives rise to stable clear nanoparticles suspension, ready to induce rigorous standard solution for the development of the quantitative analysis contrary to those made from nanopowder or commercial formulation. The difference between the formulations is evidenced in Figure 2.
Figure 2(a) shows a try of TiO2 nanopowder dispersion in H2O: without chemical functions grafted on the nanoparticles surfaces, the TiO2 nanopowder settled quickly in the bottom of the tube: a white TiO2 paste is formed, the clear supernatant does not carry nanoparticles in suspension. Figure 2(b) demonstrates the high quality of our synthesized suspension; the suspension is not turbid, soft blued, with high transparency thanks to the chemical surface functions which maintained the TiO2 nanoparticles in a non aggregated state and highly dispersed in the carrying liquid. Figure 2(c) illustrates that the commercial suspension is totally turbid, the white color of the liquid shows that the TiO2 nanoparticles are aggregated: such dispersions can not be used as standards.
3.2. Granulometry Analysis
The grain size distribution is essential in our studies in order to control the nanoparticles dispersion in the carrying liquid. Most of the physico-chemical properties of the nanoparticles are correlated to their size distribution. The results of the different samples analyzed by Dynamic Light Scattering (DLS) are reported in Table 2. The three samples exhibit good correlogram, so the results are consistent with the real aggregative state of our samples.
The main peak in the 100 nm range is the most important one in order to check the efficiency of the nanodispersion of the TiO2 entities. We found that our synthesized dispersion is very pH-sensitive. For the two samples, P1 and P2, the percentage intensity of the main peak is close to 95%; so the effectiveness dispersion is for pH ranging from 3.7 to 5.4. Highest pH value seems to induce a decrease in the population in the 100 nm range. The dispersion quality in the 100 nm range is correlated to the pH modulation of the carrying liquid. We think that the Stern layer is modified by the pH modulation of the liquid; this parameter seems to be interesting in order to tailor the size distribution of the TiO2 nanoparticles in the liquid.
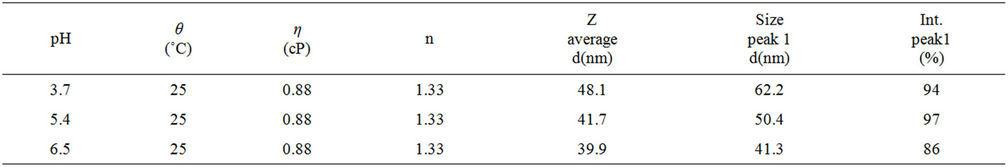
Table 2. Granulometric results for the Samples P1-P3.

Figure 1. Proposed method for one pot synthesis of homogeneous suspension of TiO2 nanoparticles in an aqueous medium.
3.3. Transmission Electron Microscopy
A representative TEM image and the associated SAED pattern of our as synthesized sample is shown in Figure 3.
The TEM image Figure 3(a) shows that most of the particles are elongated, some of them are spherical. It is possible to observe that the powder is composed of quiet heterogeneous sizes oscillating mainly between 30 - 100 nm consistent with the granulometry result. A typical SAED pattern corresponding to the most intense spots is shown in Figure 3(b). If we compare the interplanar distances calculated from the SAED patterns and the theoretical ones we can observe a high degree of consistency see Table 3. This comparison reveals the polycrystalline nature of the nanoparticles. The interplanar distances measured correspond to the TiO2 anatase structure.
3.4. Thermogravimetry Study
Table 4 gives the characteristics of the samples analysed by TGA. Sample S2 is made of TiO2 nanopowder without organic components and used as a reference. Sample S1 is the organic functionalized TiO2 nanopowder from the synthesis suspension. TGA measurements were carried out from 50˚C to 1000˚C at a heating rate of 5˚C/min.
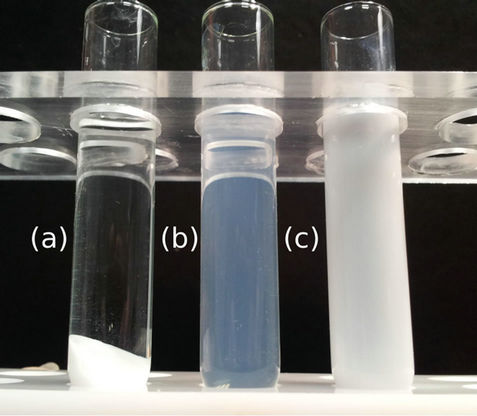
Figure 2. Comparison between a try of TiO2 nanopowder dispersion in H2O (a); our synthesized sample (b) and the commercial standard (c) both at 3400 ppm in titanium.
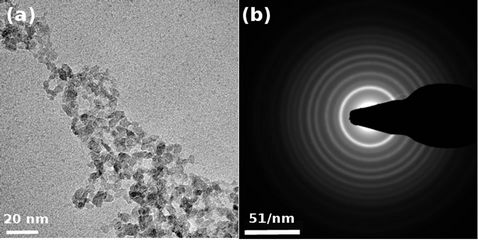
Figure 3. TEM image of TiO2 nanoparticles (a) and SAED pattern of the particles (b).
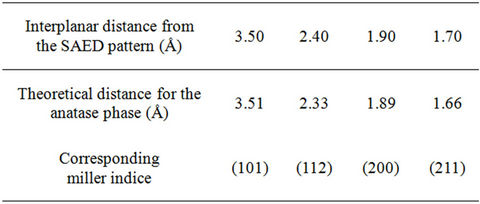
Table 3. Interplanar distances for the TiO2 nanoparticles deduced from the SAED patterns, compared to the expected ones for ideal anatase phase.
Table 4. Samples characterisitics analysed by TGA.
Figure 4 shows the TGA curves.
As far as the manufactured TiO2 nanopowder is concerned, no significant weight loss is recorded in the 50˚C - 1000˚C range. In comparison, the weight loss curve of the organic functionalized TiO2 nanopowder shows two significant weight losses. The first one occurs in the 100˚C - 150˚C range and is attributed to the desorption of volatile compound such as residual water and alcohol. The second weight loss in the 150˚C - 450˚C range is correlated with the progressive thermal degradation of the grafted tartric acid on the TiO2 nanoparticle surface. The pyrolysis of the organic surfactant is taken up to 450˚C. At the highest temperature, in our conditions, no more weight loss is recorded, so pure inorganic TiO2 nanopowder is obtained. For the sake of comparison between the samples, the total estimated weight loss is around 25 wt%.
Considering the initial amount of the precursor and the total volume of liquid, we have estimated the theoretical suspension concentration. The quantification of the weight loss of the organic functionalized TiO2 nanopowder leads to an estimation of the TiO2 concentration in the TiO2 peptidized dispersion of 5.7 mg/mL or 3400 ppm of titanium. The calculated result is in good agreement with the value given by the TGA evaluation.
3.5. ICP AES Results
The investigation of potential titanium species in biological liquid requires a low detection threshold in the ten part per billion range (ppb). With the ICP-AES apparatus, this threshold value can be reached. The MS-ICP is more accurate but the possible interaction between calcium ions and titanium species can degrade the measurement qualities. All the following calibration process, linearity, repeatability studies are developed using the International Conference on Harmonisation (ICH) requirements
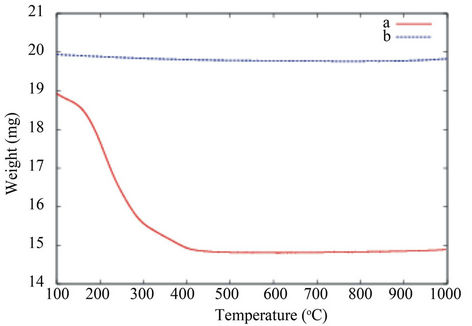
Figure 4. TGA curves of the TiO2 grafted carboxylic acid nanopowder from the synthesis (a) and pure TiO2 used as a reference (b).
concerning the validation of analytical method [15]. The calibration line is made with deionized water as carrying liquid. The starting solution is the as-synthesized dispersion (3400 parts per million in titanium). A first dilution is made in deionized water to reach a concentration of 340 ppm. Then, the different standard solutions are made with dilution in deionized water or in human blood plasma respectively. The calibration batch is composed of five standard solutions in the required concentration range:
• 0.1 ppm, 0.25 ppm, 1.0 ppm, 2.0 ppm.
The control batch is composed of three control solutions:
• 0.15 ppm, 0.4 ppm, 1.5 ppm.
3.5.1. Linearity Results
The calibration line obtained by assaying the five standard solutions and the blank is presented in Figure 5.
The correlation coefficient calculated with the linear regression analysis is r2 = 0.9998 better than the requested one r2 = 0.999. The method is linear in the (0 - 2) ppm range.
3.5.2. Repeatability Results
In order to check the repeatability of our method, the whole calibration procedure is repeated three different days in the same operating conditions. The results demonstrate a good linearity of the calibration line for the three different days. In every case, the correlation coefficient r2 is better than r2 = 0.999. The repeatability of our method's linearity is proven in the (0 - 2) ppm range.
3.5.3. Fidelity and Accuracy Studies
The fidelity of the method concerns the variation in the results obtained by assaying the control solutions on three different days. Fidelity is estimated by the variation coefficient VC:
 (2)
(2)
Accuracy of the method is defined as the difference between the experimental value and the theoretical one (relative error) RE:
 (3)
(3)
The fidelity and accuracy valided the method if their value are respectively below 10%. The different results obtained are described in Table 5.
All the results for the fidelity and accuracy criteria are below 10%. These results ensure the validity of our method in the range of the concentration.
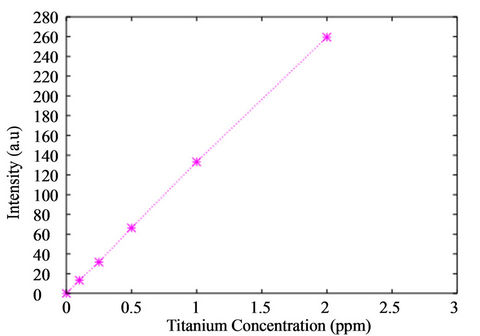
Figure 5. Calibration line obtained from the assayed samples .
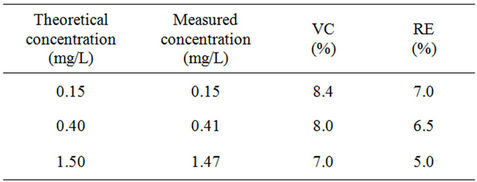
Table 5. Fidelity and accuracy results for the control samples.
3.5.4. Quantification Threshold Study
It is essential for our method to determine the quantification threshold. Using the ICH prescription, the quantification threshold is reached when the variation coefficient VC defined in Equation (2) is above 15%. For the quantification threshold determination, a calibration batch composed of five standard solutions and one blank in the required concentration range is used:
• 0 ppm, 0.1 ppm, 0.25 ppm, 0.5 ppm, 1.0 ppm, 2.0 ppm.
Five others samples used as standard solutions are assayed three times for the quantification threshold determination:
• 10 ppb, 20 ppb, 30 ppb, 40 ppb, 50 ppb.
The results are depicted in Tables 6 and 7.
The estimation of the quantification threshold is in the (40 - 50) ppb range in titanium species.
3.5.5. Biological Matrix Effect
The potential impact of the biological fluid on the titanium species quantification by ICP-AES must be studied to ensure accurate results using a calibration line. To measure the possible influence of human blood plasma on the titanium species measured by ICP-AES, a calibration line made by assaying five standard solutions in water is used. Six control solutions are prepared using human blood plasma as carrying liquid and assayed twice
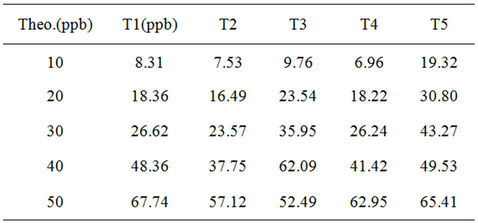
Table 6. Quantification threshold determination.
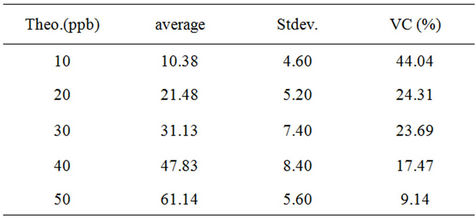
Table 7. Variation coefficient (VC) calculations.
by ICP. The results are depicted in Table 8.
The deviation between the theoretical concentration of the control sample in human blood plasma and the measured value is for the whole experiments under 8% concerning the Relative Error (RE) in the concentration range studied. No influence of the human blood plasma on the titanium species quantification is highlighted, the results are in good agreement using a calibration line made with standard solution in water and control solutions diluted in human blood plasma. The calibration line built in water as carrying liquid is also validated to determine the titanium concentration in blood plasma. Furthermore, the repeatability of our method is also demonstrated, the Variation Coefficient (VC) is below the threshold of 10%.
3.6. Release Studies from the Nanotube Layers Immersed in Human Blood Plasma
TiO2 Nanotube Layers Morphology
Ordered titanium dioxide nanotube arrays, approximately 80 nm in diameter, are observed from anodized Ti foil made with an anodizing voltage maintained at 20 volts during 20 minutes as shown in Figure 6.
In order to test our quantification method, a preliminary study is proposed. This study is the starting point for further investigations in the field of the potential toxicity of metallic nanostructured devices implanted in the living. We report the results concerning three anodized samples and a naked Ti foil (0.5 cm × 2 cm) immersed in 25 mL of human blood at 37˚C under magnetic stirring at 70 rpm during 2 days as described in Figure 7.
A volume of 3 mL of each sample are assayed by ICP-
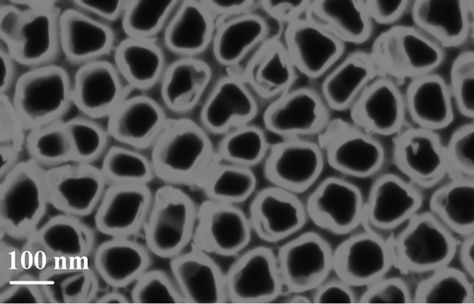
Figure 6. SEM top-view image of the TiO2 nanotube layer after 20 minutes of anodization at 20 Volts.
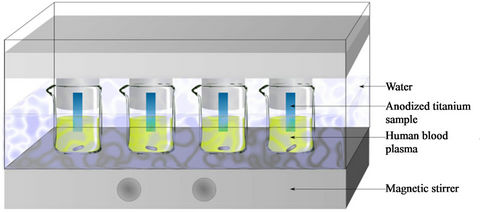
Figure 7. Experimental set-up for monitoring the release kinetic of titanium species from nanostructured surface immersed in human blood plasma.
AES at different times. The experimental results are shown in Table 9.
In every case, the experimental values are below the quantification threshold found in the 40 - 50 ppb range. In our experimental conditions, it seems that no signifycant titanium release occurs for 2 days in immersion in human blood plasma.
4. Conclusion
We reported the establishment of a rigorous quantitative method for assaying a potential titanium species release from TiO2 nanotube layers in biological fluid using ICP-AES. In order to induce accurate standard solutions needed for the calibration line, a one-pot synthesis of TiO2 nanoparticles in suspension is developed. The physico-chemical properties of the synthesized nanoparticles were characterized and the dispersion is used to induce well-defined standard and control solution by dilution in deionized water and human blood plasma. Satisfying results are obtained as far as repeatability, fidelity, linearity and accuracy are concerned. No biological matrix influence is detected; this fact validates the method using calibration line in water for titanium quantification in human blood plasma. The detection threshold is observed in the (40 - 50) ppb range in titanium species. To investigate the potential titanium
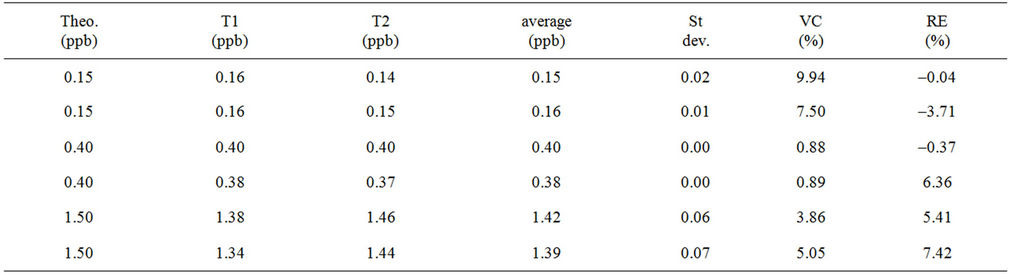
Table 8. Influence of the blood plasma matrix on the quantification of titanium species by ICP-AES.
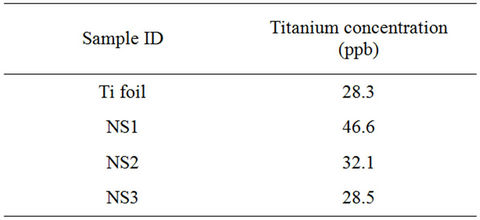
Table 9. Results of the quantification of titanium species released in human blood plasma from anodized surfaces.
species release, a preliminary study consisting of samples made of TiO2 nanotube layers immersed in human blood plasma is performed. No significant titanium species release was measured during this test. This work opens the way to further promising investigations concerning the biological security of the future medical metallic devices implanted in the living.
5. Acknowledgements
The authors thank Dominique Jalabert, Laurianne Truffault and Caroline Andreazza for the HRTEM images (université d’Orléans). The authors acknowledge the University of Auvergne for its financial support.
REFERENCES
- B. Ercan, E. Taylor, E. Alpaslan and T. J. Webster, “Diameter of Titanium Nanotubes Influences AntiBacterial Efficacy,” Nanotechnology, Vol. 22, No. 29, 2011, p. 295102. doi:10.1088/0957-4484/22/29/295102
- S. Oh, C. Daraio, L. H. Chen, T. R. Pisanic, R. R. Finones, and S. Jin, “Significantly Accelerated Osteoblast Cell Growth on Aligned TiO2 Nanotubes,” Journal of Biomedical Materials Research Part A, Vol. 78, No. 1, 2006, pp. 97-103. doi:10.1002/jbm.a.30722
- S. M. Z. Khaled, R. J. Miron, D. W. Hamilton, P. A. Charpentier and A. S. Rizkalla, “Reinforcement of Resin Based Cement with Titania Nanotubes,” Dental Materials, Vol. 26, No. 2, 2010, pp. 169-178. doi:10.1016/j.dental.2009.09.011
- K. C. Popat, M. Eltgroth, T. J. LaTempa, C. A. Grimes, and T. A. Desai, “Titania Nanotubes: A Novel Platform for Drug-Eluting Coatings for Medical Implants?” Small, Vol. 3, No. 11, 2007, pp. 1878-1881. doi:10.1002/smll.200700412
- D.-H. Kwak, Ji.-B. Yoo, and D. J. Kim, “Drug Release Behavior from Nanoporous Anodic Aluminum Oxide,” Journal of Nanoscience and Nanotechnology, Vol. 10, No. 1, 2010, pp. 345-348. doi:10.1166/jnn.2010.1531
- L. J. Zhang and T. J. Webster, “Nanotechnology and Nanomaterials: Promises for Improved Tissue Regeneration,” Nano Today, Vol. 4, No. 1, 2009, pp. 66-80. doi:10.1088/0957-4484/20/17/175101
- M. Sinn Aw, S. Simovic, J. Addai-Mensah and D. Losic, “Polymeric Micelles in Porous and Nanotubular Implants as a New System for Extended Delivery of Poorly Soluble Drugs,” Journal of Materials Chemistry, Vol. 21, No. 20, 2011, pp. 7082-7089. doi:10.1039/c0jm04307a
- J. L. Perry, C. R. Martin, and J. D. Stewart, “Drug-Delivery Strategies by Using Template-Synthesized Nanotubes,” Chemistry—A European Journal, Vol. 17, No. 23, 2011, pp. 6296-6302. doi:10.1002/chem.201002835
- Gultepe, Evin and Nagesha, Dattatri and Sridhar, Srinivas and Amiji, Mansoor. “Nanoporous Inorganic Membranes or Coatings for Sustained Drug Delivery in Implantable Devices,” Advanced Drug Delivery Reviews, Vol. 62, 2010, pp. 305-315. doi:10.1016/j.addr.2009.11.003
- S. Minagar, C. C. Berndt, J. Wang, E. Ivanova and C. Wen, “A Review of the Application of Anodization for the Fabrication of Nanotubes on Metal Implant Surfaces,” ActaBiomaterialia, Vol. 8, No. 8, 2012, pp. 2875-2888. doi:10.1016/j.actbio.2012.04.005
- E. Fabian, R. Landsiedel, L. Ma-Hock, K. Wiench, W. Wohlleben and B. van Ravenzwaay, “Tissue Distribution and Toxicity of Intravenously Administered Titanium Dioxide Nanoparticles in Rats,” Archives of toxicology, Vol. 82, No. 3, 2008, pp. 151-157. doi:10.1007/s00204-007-0253-y
- J. Wu, W. Liu, C. Xue, S. Zhou, F. Lan, L. Bi, H. Xu, X. Yang and F. D. Zeng, “Toxicity and Penetration of TiO2 Nanoparticles in Hairless Mice and Porcine Skin after Subchronic Dermal Exposure,” Toxicology letters, Vol. 191, No. 1, 2009, pp. 1-8. doi:10.1016/j.toxlet.2009.05.020
- J. Chen, X. Dong, J. Zhao and G. Tang, “In Vivo Acute Toxicity of Titanium Dioxide Nanoparticles to Mice after Intraperitioneal Injection,” Journal of Applied Toxicology, Vol. 29, No. 4, 2009, pp. 330-337. doi:10.1002/jat.1414
- E. Feschet-Chassot, V. Raspal, Y. Sibaud, O. K. Awitor, F. Bonnemoy, J. L. Bonnet and J. Bohatier, “Tunable Functionality and Toxicity Studies of Titanium Dioxide Nanotube Layers,” Thin Solid Films, Vol. 519, No. 8, 2011, pp. 2564-2568. doi:10.1016/j.tsf.2010.12.184
- ICH, “Validation of Analytical Procedure, Text and Methodology Q2(R1),” Federal Register, Vol. 62, No. 96, 2005, pp. 27463-27467.