American Journal of Plant Sciences
Vol.4 No.6A(2013), Article ID:33326,8 pages DOI:10.4236/ajps.2013.46A010
Potential Antioxidant Activities Improve Salt Tolerance in Ten Varieties of Wheat (Triticum aestivum L.)
![]()
1Department of Plant Breeding and Molecular Genetics, Faculty of Agriculture, University of the Poonch, Rawalakot, Pakistan; 2University of Azad Jammu and Kashmir, Muzaffarabad, Pakistan; 3Department of Chemistry, University of the Poonch, Rawalakot, Pakistan.
Email: *aurongzebrao@yahoo.com
Copyright © 2013 Aurangzeb Rao et al. This is an open access article distributed under the Creative Commons Attribution License, which permits unrestricted use, distribution, and reproduction in any medium, provided the original work is properly cited.
Received March 12th, 2013; revised April 13th, 2013; accepted May 15th, 2013
Keywords: Antioxidant Enzymes; Chlorophyll Content+/Na+ Ratio; Relative Water Content; Salinity; Wheat
ABSTRACT
The activity of antioxidative enzymes system is affected by salt stress, chlorophyll content (CHL), leaf relative water content (RWC), Na+ and K+ contents, their ratio and some oxidative stress indices were studied in leaves of ten bread wheat cultivarsSehar-06, Lu-26, NARC-09, BARC-09 and Pirsbak-09’ (salt-tolerant) and Kaghan-94, Rohtas-90, Soughat-90, Shaheen-94 and Zardana-89’ (salt-sensitive), grown under salinity treatments carried out in five levels (1 < dS·m−1 as control, 2, 4, 8, 16 dS·m−1) via sodium chloride. Under high salt potency significant increase for activities of antioxidant enzymes such as ascorbate peroxidase (APX) and guiacol peroxidase (GPX), occurred in salt tolerant varieties. Meanwhile, under salinity condition the activities of antioxidant enzymes such as superoxide dismutase (SOD), catalase (CAT) and (GPX) in sensitive cultivar were lower than control. Regarding (APX) activity there was no significant difference between salinity and control situation. Under salt stress membrane stability index (MSI) of both cultivars were negatively influenced. Hydrogen peroxide (H2O2) content of salinity sensitive cultivars was higher than control. Salt tolerant varieties had more amounts of K+ content, K+ and Na+ ratio, relative water content, yield and chlorophyll under salt conditions, and sensitive ones recorded higher Na+ content at tillering stage. The mechanism of salt stress might be achieved due to low lipid peroxidation, assumingly lower changes in membrane stability index and evasion of Na+ combination and amplified activity of antioxidant enzymes.
1. Introduction
Physiological and metabolic processes are adversely affected by a major abiotic stress, soil salinity that leads toward decreased growth and yield [1]. Availability of nutrients and water is affected by soil salinity. What is more, it induces osmotic stress, the physiological drought, which typically reduces the growth and photosynthesis in plants [2]. In addition to the known components of osmotic stress and ion toxicity, salt stress is also manifested as an oxidative stress [3]. Due to salinity growth reduction is also credited to ion toxicity and nutrient imbalance, which causes not only high sodium (Na+) and chloride (Cl−) accumulation in plants, but also destructively affects the uptake of essential nutrient elements such as potassium (K+), calcium (Ca2+) and magnesium (Mg2+) in rivalry with Na+ and also nitrate (NO3−) in contrast with Cl− [4,5]. Cations such as K+ and Na+ are recognized to be the main inorganic elements, which make available needed osmotic potential for water uptake by plant cells [6]. Regulation of K+ uptake alongside avoidance of Na+ entry and efflux of Na+ from the cell, and further more confiscation of Na+ in vacuole for osmotic adjustment are the ordinary strategies for continuation of desirable K+/Na+ ratios in the cytosol. A soaring K+ and Na+ ratio in the cytosol is necessary for usual cellular functions of plants [7].
Due to reactive oxygen species (ROS) production the salt-induced disturbance in ionic homeostasis causes a spill of secondary effects such as oxidative stress [7,8]. By entailing some key enzymes like peroxidase, catalase and superoxide dismutase (antioxidant enzymes) plants have developed an antioxidative defense system in order to escape from the damaging effects of ROS [7,9]. Though, by scavenging free radicals an active antioxidative defense system comprising enzymatic and non-enzymatic antioxidants reduces the level of oxidative stress in plant cells [9,10]. At the cellular level, salt inducing oxidative damage can be determined by malondialdehyde, a lipid peroxidation product, which is accumulated in plants under saline stress [11,12].
Wheat is the major cereal crop of Pakistan, which is cultivated all over the country and the food demand of over growing population of Pakistan is fulfilled by growing wheat. A large amount of underground water used for wheat cropping is brackish; though, some areas are irrigated with canal water but do not have drainage system. Both the irrigation systems are causing the soil salinity crisis in the country due to which weighty losses in crop yields are reported [13]. The wheat crop is moderately salt tolerant [14] and for viewing or developing salt tolerant wheat varieties, physiological and biochemical studies are essential to classify the physiological and biochemical markers. Genetically plants differ in their response to salt stress [15]. By plants diverse mechanisms of salt tolerance have been suggested by different workforce [16-18]. In view of the importance of wheat and salinity, current study has been intended to inspect the role peroxidation, membrane stability index, K+ and Na+ ratio, chlorophyll content and some oxidative stress indices in salt tolerance of wheat (Triticum aestivum L.).
2. Materials and Methods
2.1. Plant Material and Induction of Salt Stress
The plant material (varieties) was selected on the base of their frequent cultivation in the area. The selected wheat varieties i.e. Sehar-06, Lu-26, NARC-09, BARC-09 and Pirsbak-09’ (salt-tolerant) and Kaghan-94, Rohtas-90, Soughat-90, Shaheen-94 and Zardana-89’ (salt-sensitive), were collected from different Research stations of Pakistan, authenticated and grown in the experimental field of the University of Poonch Rawalakot Azad Kashmir Pakistan. At comparable conditions the leaves from all varieties grown in pots were taken for aqueous extraction. The experiment was laid out in two factors factorial RCBD design with three replications. Equal amounts of soil, sand and farm yard manure was mixed and used to fill the pots. Four doses of the table salt (NaCl) were functional to the wheat verities. When seedlings were four-weeks old, salt stress treatments were imposed by adding the doses included, 2 dS·m−1 (desi Siemen’s per meter), 4 dS·m−1, 8 dS·m−1 and 16 dS·m−1 against control (No salt applied) in the soil. At the same time, samples for membrane stability index (MSI) examine were collected from the earliest fully expanded leaf (second leaf from the top) and taken to the laboratory in ice buckets. All salt doses were practical at jointing stage and the electrical conductivity (EC) was calculated according to the agreed method of USDA (1954).
2.2. Extraction of Enzymes
For CAT, GPX and SOD extraction, leaf samples (0.5 g) were homogenized in ice-cold 0.1 M phosphate buffer (pH 7.5) containing 0.5 mM EDTA with pre-chilled pestle and mortar. Centrifuge tubes was used for each homogenate was and was centrifuged at 4˚C in Beckman refrigerated centrifuge for 15 min at 15,000 × g. For enzyme activity assay the supernatant was used [19,20].
For the extraction of APX, leaf samples (0.5 g) were homogenized in ice-cold 0.1 M phosphate buffer (pH 7.5) containing 0.5 mM EDTA, 2 mM ascorbate (AsA) and 5% polyvinylpyrrolidin (PVP 6000) with pre-chilled pestle and mortar. The other stages were similar to the extraction of other enzymes [19,20].
2.3. Enzyme Activity Assays
By recording the decrease in absorbance of superoxidenitro blue tetrazolium complex by the enzyme SOD activity was estimated [21]. In test tubes about 3 mL of reaction mixture, containing 0.1 mL of 200 mM methionine, 0.01 mL of 2.25 mM nitro-blue tetrazolium (NBT), 0.1 mL of 3 mM EDTA, 1.5 mL of 100 Mm potassium phosphate buffer, 1 mL distilled water and 0.05 mL of enzyme extraction, were taken from each enzyme sample. Absorbance was recorded at 560 nm and one unit of enzyme activity was taken as the quantity of enzyme which decreased the absorbance reading of samples to 50% in contrast with tubes lacking enzymes.
Activity of CAT was measured according to [2]. Reaction mixture limited 100 mM potassium phosphate buffer (pH 7), 75 mM H2O2, enzyme extract and distilled water. The Reaction started by adding H2O2, and the decrease in absorbance was recorded at 240 nm (ε = 36 mM−1·cm−1) for 1 min. By calculating the amount of H2O2 decomposed enzyme activity was calculated.
The activity of APX was measured by the method [2] by monitoring the rate of ascorbate oxidation at 290 nm (ε = 2.8 mM−1·cm−1).The reaction mixture contained 25 mM phosphate buffer (pH 7), 0.1 mM EDTA, 1 mM H2O2, 0.25 mM reduced ascorbate (AsA) and the enzyme sample. In the absence of AsA in the test medium no change in absorption was found.
The activity of GPX was measured according to [22]. The reaction mixture contained 100 mM potassium phosphate buffer (pH 7), 0.1 mM EDTA, 5 mM guaiacol, 15 mM H2O2 and enzyme sample. By using H2O2 and guiacol as substrates the enzyme created a colorful product. The absorbance of the product was monitored at 470 nm (ε = 26.6 mM−1·cm−1), and peroxidase activity was expressed as units/mg protein min.
Lipid peroxidation was measured as malondialdehyde (MDA) in the leaves was analyzed following [12].
Determination of Membrane stability index (MSI) was recording by the electrical conductivity of leaf ions leaching in double distilled water [23]. Leaf samples (0.1 g) were in use in test tubes containing 10 mL of double distilled water in two sets. One set was set aside at 40˚C for 30 min and another set at 100˚C in boiling water bath for 15 min and their respective electrical conductivities, C1 and C2, were measured by a pH-EC meter (HANNA, HI9811, Hanna Instruments, and Padova, Italy). Membrane stability index was calculated by the following formula:

Levels of Hydrogen peroxide were determined according to [24]. The content of H2O2 was calculated by plotting a standard curve using different concentrations of H2O2.
Samples of Protein content was determined by method of [11]. Bovine serum albumin was used as a standard and the enzyme activity was expressed in mg of protein. Following extraction of liquid-nitrogen frozen leaf with 80% acetone, the concentration of chlorophyll was determined according to the spectrophotometer method of [25].
2.4. Sodium and Potassium Contents
Sodium and Potassium contents were measured by flame photometry method. Leaf samples were dried out and ground. Powdered leaf materials (1 g) were kept at 560˚C for 4 h for ash preparation. To these samples, 20 ml 1N HCl was added and the mixtures were heated at 90˚C to drive off the hydrochloric acid. The digested ash was dissolved in 100 ml distilled water and then filtered. The filtrate was stored in a refrigerator until analysis. Concentrations of potassium and sodium ions were estimated by referring to 0, 5, 10, 20, and 30 mg/L standard working solution. The test solution was diluted if its signal was above that of the highest standard. Content of the elements were calculated by using the following equation [10].
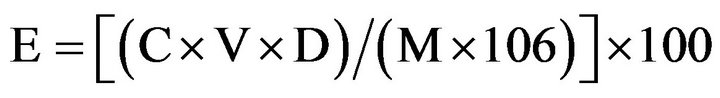
where, E is the element (either potassium or sodium) content of the test sample, expressed in %. C is the element mass of the test solution, expressed in mg/L, read from the calibration graph. V is the volume, in mL, of the digested solution (V = 100). D is the dilution factor of the test solution carried out during the measurement step. M is the mass, in g, of the test sample helped in the procedure.
2.5. Statistical Analysis
All physiological and biochemical parameters were recorded with replications. The data were analyzed with MSTATC software. Mean comparison were carried out by LSD method.
3. Results
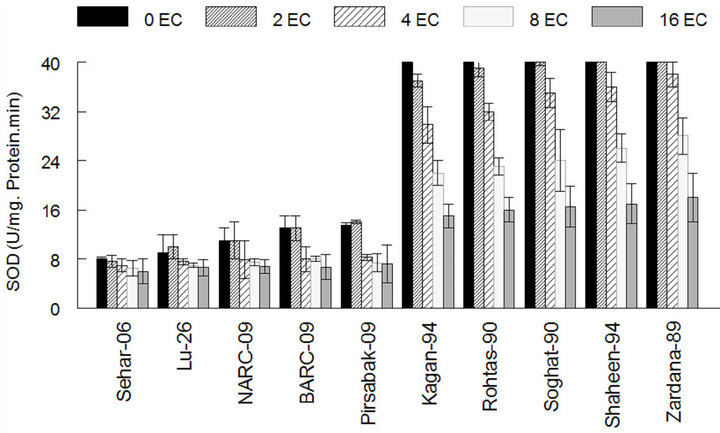
The results showed that the activity of antioxidant enzymes such as SOD, CAT and GPX in varieties Kaghan- 94, Rohtas-90, Soughat-90, Shaheen-94 and Zardana-89’ (salt-sensitive), were lower than control under salinity condition (Figures 1(a)-(c)). In the meantime, there was no significant difference (P < 0.05) between salinity situation and control ones regarding APX activity (Figure 1(d)). Meanwhile, inSehar-06, Lu-26, NARC- 09, BARC-09 and Pirsbak-09’ (salt-tolerant) the activity of SOD and CAT was unchanged or little bit escalation (Figures 1(a) and (b)). Obstinately, APX and GPX showed significantly amplified activities under salinity compared to control treatment (Figures 1(c) and (d)).
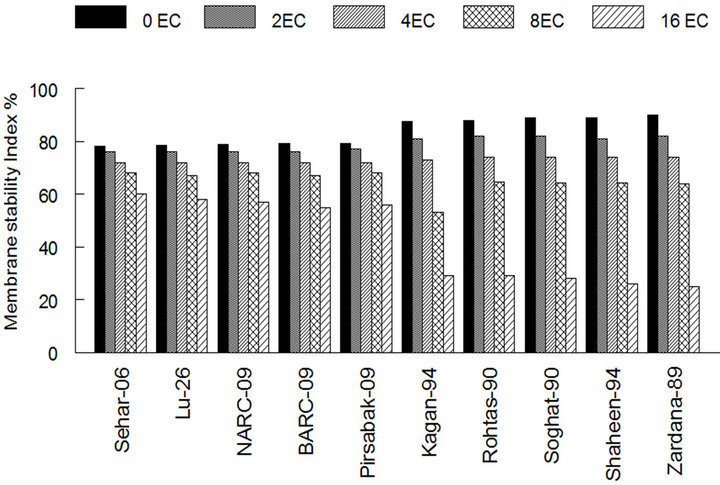
Under salinity stress membrane stability index (MSI) of Sehar-06 and Lu-26 were negatively influenced than the control condition, that was 60% and 58% in case of Sehar-06 and Lu-26 and less percentage in case of two last sensitive varieties as 26% and 25% in Shaheen-94 and Zardana-89’ respectively, this is a strong evidence for tolerance and sensitivity in bread wheat varieties (Figure 2(a)). This negative collision on salt sensitive varieties was highlighted than on salt tolerant varieties (Figure 2(a)). Under salinity stress MDA amount significantly (P < 0.05) increased in both studied varieties. Even though this increase in the case of salt-sensitive varieties was about three times higher than that of salttolerant varieties (Figure 2(b)). The wheat varieties i.e. Sehar-06 and Lu-26, showed minimum amount of MDA 16.2 and 16.9 nmol·g−1 fresh weight (FW) of leaves respectively.
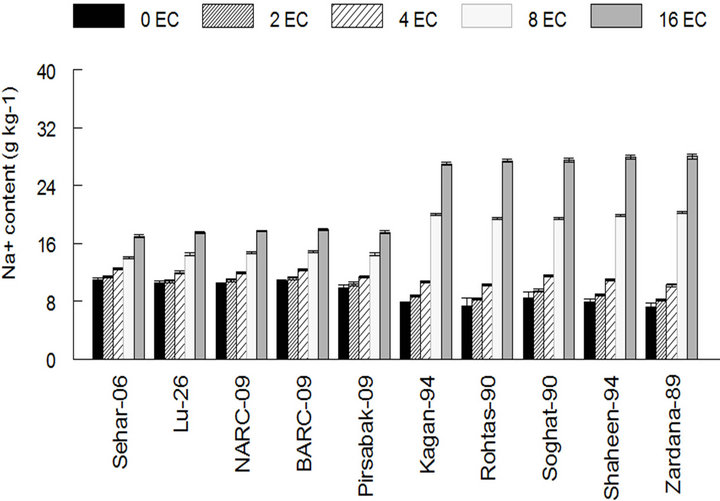
The hydrogen peroxide contents of stress faced saltsensitive varieties were higher than control as 0.82 and 0.85 mmol·g−1 FW in case of Shaheen-94 and Zardana-89. On the other hand, its content declined but very little change was observed in salt-tolerant varieties and considered as no change in case of Sehar-06 and Lu-26 respectively (Figure 3). Salinity treatment led to the increased Na+ content in both sets of varieties (Figure 4). This increase in the case of salt-sensitive varieties was almost four-times elevated than salt-tolerant varieties as it is 7.2 in control and 28 g·Kg−1 at maximum stress level in case of Zardana-89 (Figure 4(a)).What is more, salinity harmfully exaggerated K+ content in both cultivars
 (a)
(a)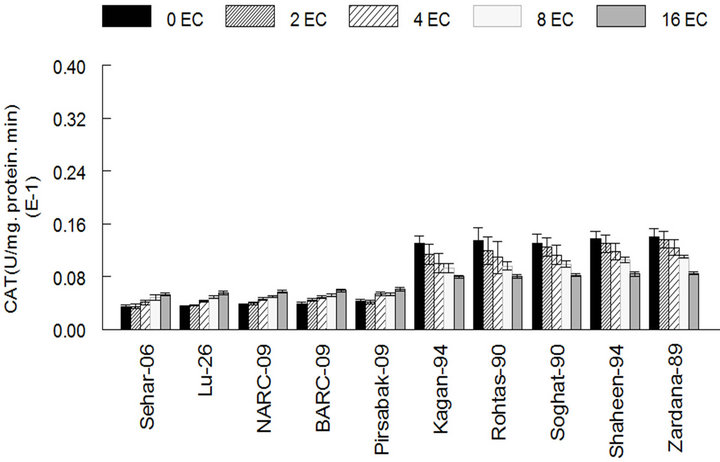 (b)
(b)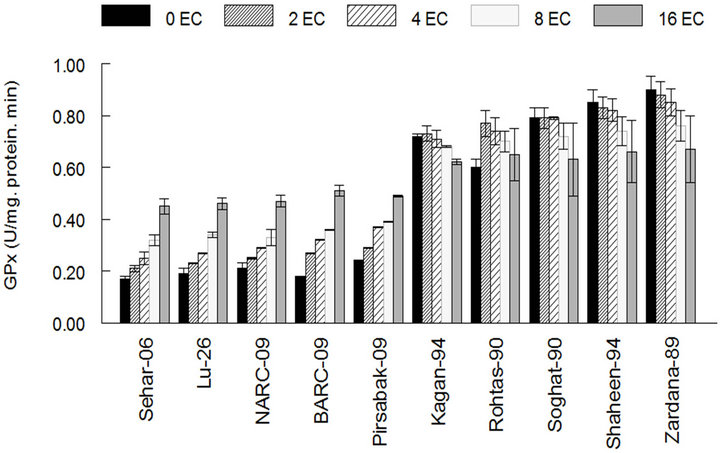 (c)
(c)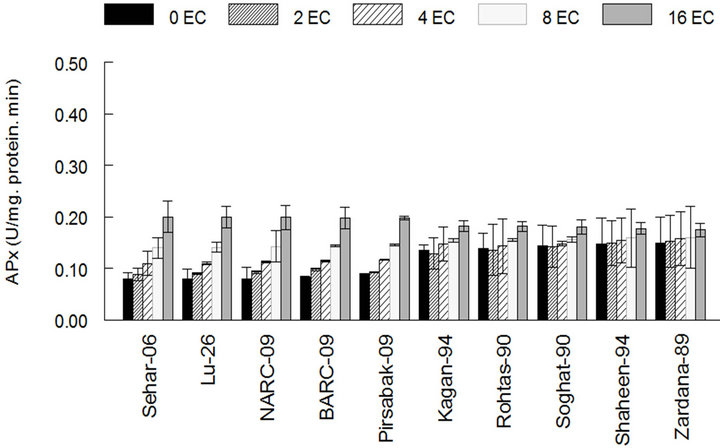 (d)
(d)
Figure 1. The activities of antioxidant enzymes among different cultivars of wheat in control and under salt stress. (a) Superoxide dismutase activity among different cultivars of wheat; (b) Catalase activity among different cultivars of wheat; (c) Guaiacol peroxidase activity among different cultivars of wheat; (d) Ascorbic acid peroxidase activity among different cultivars of wheat. The results are means ± SD (n = 3).
 (a)
(a) (b)
(b)
Figure 2. The lipid peroxidation among different cultivars of wheat under salt stress. (a) Membrane stability index among different cultivars of wheat; (b) Lipid peroxidation (MDA) content among different cultivars of wheat. The result are means ± SD (n = 3).
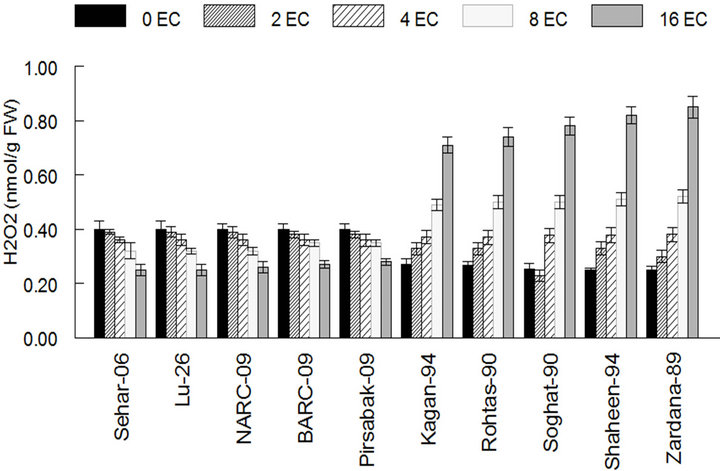
Figure 3. The content of hydrogen peroxide among different cultivars of wheat in control and under salt stress. The result are means ± SD (n = 3).
decreased about one fourth in case of salt tolerant and about half in the journey from control to the maximum stress level (Figure 4(b)). In case of Sehar-06 the most salt tolerant cultivars, its value is 88 at control level and decreased to 67.8 g·Kg−1 at salinity level of 16 dS·m−1 and in case of Zardana-89 at control the value is 66 and lowered to 35.6 g·Kg−1 at maximum salinity level. K+ and Na+ ratio of both cultivars reduced while, travelling
 (a)
(a)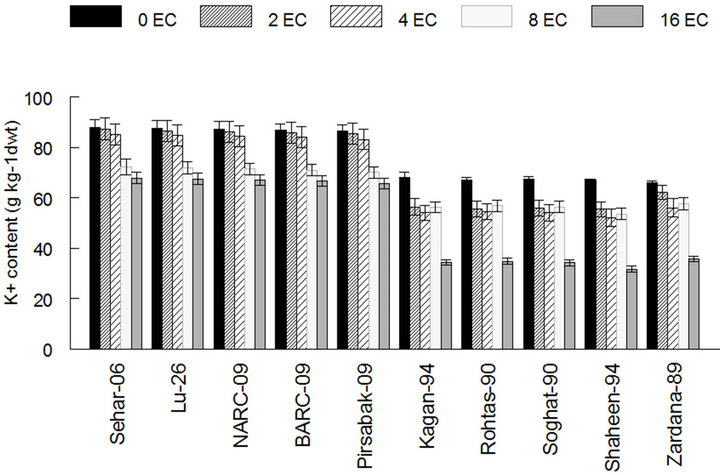 (b)
(b)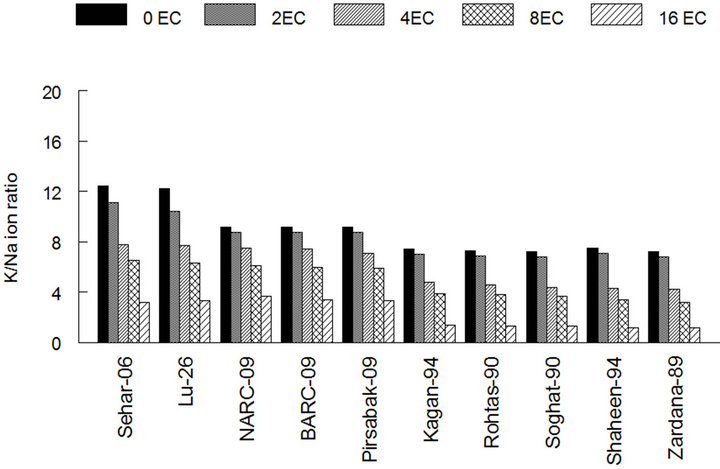 (c)
(c)
Figure 4. Effect of salinity on the amount of sodium and potassium among different cultivars of wheat. (a) Sodium content in wheat leaves; (b) Potassium content in wheat leaves; (c) The ratio of K and Na in wheat leaves. The result are means ± SD (n = 3).
from control towards maximum salinity, in case of tolerant varieties it devalued with ratio: from 12.4 to 4.2 in case of Sehar-06 and from 7.2 to 1.2 in case of zardana-89 (Figure 4(c)). However, there was no statistical difference between varieties for this ratio.
Relative water content in the leaves of plants grown under salinity stress decreased significantly (P < 0.05) in cultivars compared to those grown in non-saline soil (Figure 5). GenotypesSehar-06, Lu-26, NARC-09, BARC-09 and Pirsbak-09’ had higher relative water contents under saline conditions are thus are resistant to salt stress.
The chlorophyll contents were increased in all the cultivars with the addition of salt at tillering stage (Figure 6). However, this increase was more prominent in genotypesSehar-06, Lu-26, NARC-09, BARC-09 and Pirsbak-09 (Figure 6).Sensitive cultivars had higher and lower chlorophyll contents compared to tolerant cultivars at fist booting and flowering stages respectively. It was found that at tillering stage, the chlorophyll content of Shaheen-94 and Zardana-89cultivars increased from 20 - 23 mg·g−1 FW up to 16 dS·m−1 salinity level whereas, Sehar-06, Lu-26, cultivars had 10 - 33 mg·g−1 FW increased at mentioned salinity level. It was observed that chlorophyll content in Sensitive cultivars was not increased so much at last stage. The almost same results were observed by [18].
Grain yield of different wheat varieties was significantly subjective by the salinity (Table 1). The genotype Sehar-06 and Lu-26s showed minimum reduction, when compared with control, whereas maximum reduction over control was recorded in Shaheen-94 and Zardana-
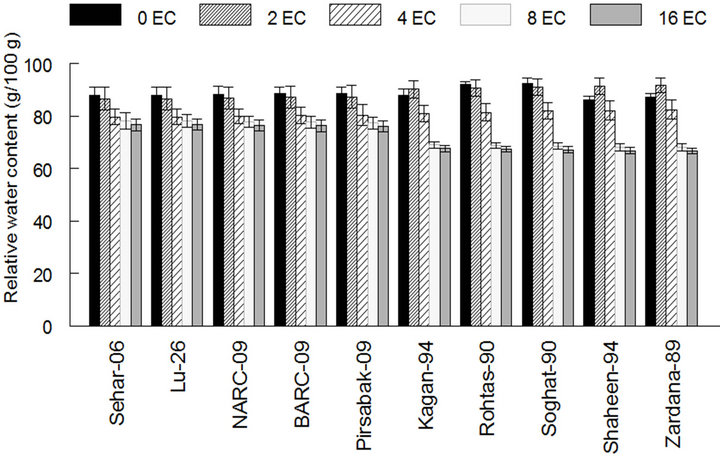
Figure 5. Effect of salinity on relative water contents in leaf of different cultivars of wheat. The result are means ± SD (n = 3).
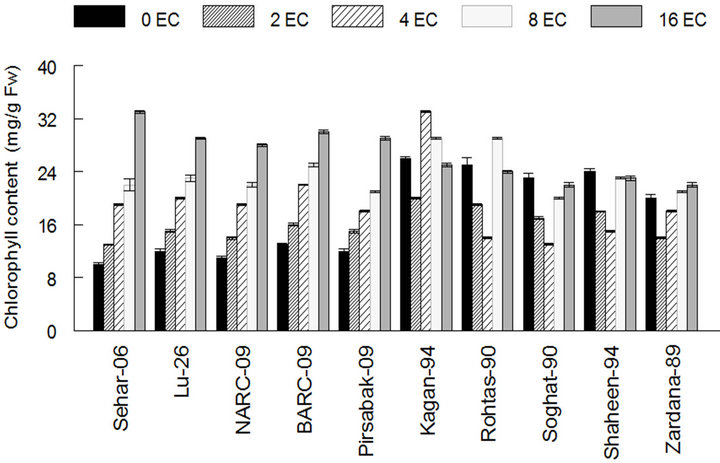
Figure 6. Effect of salinity on chlorophyll content in leaf of different cultivars of wheat. The resultare means ± SD (n = 3).
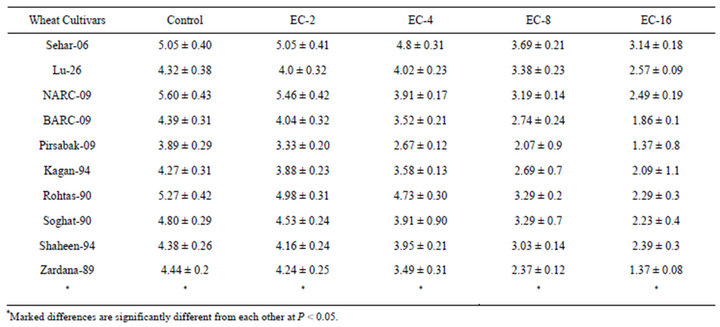
Table 1. Grain yield (g) among ten cultivars of wheat in control and under salt stress.
89. The genotypes Sehar-06 and Lu-26 were successful in maintaining grain yield more than 60% under salinity stress (16 dS·m−1).
4. Discussion
As plant hormones are concerned in regulating a range of physiological and biochemical processes, the analysis of the role of new plant growth regulators in crop abiotic stress tolerance is being a great deal of focus these days [26]. It has been commonly reported that salt stress is one of the major causes of oxidative damage to plant tissues [27]. Though, plants can run away the damaging effects of reactive oxygen species by developing a physiologically powerful defense system together with antioxidant enzymes like CAT, POD and SOD [21].
As already understood, salinity intensity leads to reduced water accessibility and/or absorption and therefore lowered leaf turgor and at last leads to stomata closure [1]. CO2 attainment influences by stomata closure and basis fluctuations and imbalances in ongoing light reactions and CO2 fixation stage. The final result of these nonstandard conditions would be reduced NADP+ or NADPH, H+ ratio and increased ROS production [14]. Mehler cycle is the most competent intrinsic mechanism for diminished production and coping with ROS molecules [24]. SOD activity showed declining pattern in salt sensitive varietiesasKaghan-94, Rohtas-90, Soughat-90, Shaheen- 94 and Zardana-89’ (salt-sensitive) respectively. It likely to be stated that the lowest SOD activity under salinity might be the key factor for influential membrane damage and increased MDA content and oxidative stress. the SOD activity reduced it follows by the accretion of  in leaf cells and as a result there isobstruction of CAT and peroxidases activities [28].
In salt sensitive varieties i.e. Kaghan-94, Rohtas-90, Soughat-90, Shaheen-94 and Zardana-89’ in spite of oxidative stress, SOD activity was not increased.
Evidences indicated that intracellular Na+ homeostasis and salt tolerance are modulated by calcium and high Na concentrations negatively affect K acquisition [29]. Sodium in competition with K+ for uptake via common transport system and does this efficiently since the Na+ concentration in saline environments is generally significantly greater than that of K+. Plants prevent the uptake of toxic ions or maintaining standard nutrient ion contents could show finer tolerance which was the case with the present study. Mechanism of up taking that discriminates similar ions such as Na+ and K+ could be obliging selection criteria for salt tolerance in wheat and breeding for efficient nutrient uptake. A significant negative correlation was experiential between grain yield and increase in sodium contents of the wheat genotypes grown under NaCl concentration.
In the present study due to salinity stress all wheat genotypes showed decreasing trend in K+ content. The reduction in K+ was due to the existence of excessive Na+ in the growth medium since high external Na content is recognized to have an aggressive effect on K uptake in plant [28]. Regulation of K+ uptake and avoidance of Na+ entrance, efflux of Na+ from cell are the strategies normally used by plants to uphold desirable K and Na ratio in the cytosol. In the present study, the tolerant genotypes are expressing the same trend for K and Na ratios. Genotypes Sehar-06, Lu-26, NARC-09, BARC-09 and Pirsbak-09’ (salt-tolerant) relatively higher in accumulating more K than sensitive ones. K and Na ratio is the criterion which is recognized by the scientist and the genetically accepted for salt tolerance. Consequently, the varieties maintaining higher K and Na ratio are the salt tolerant and showing positive correlation between grain yield and K and Na ratio. It was concluded that on the basis of less than 40% reduction in yield, five varieties Sehar-06, Lu-26, NARC-09, BARC-09 and Pirsbak-09 were better. One of the early symptoms of salinity stress in plant tissue is the decrease of relative water content (RWC). This reduction of RWC in stressed plants may be associated with a decrease in plant vigor and was observed in many plant species [5]. It was also observed that the tolerant genotypes have higher relative water content, high K and Na ratio, antioxidant enzyme activity and less chlorophyll degradation as compared to sensitive ones. The tolerant genotypes also maintained high grain yield at different salinity levels which is in agreement to the biochemical studies.
5. Conclusion
In conlusion, the data obtained from this experiment exposed that Kaghan-94, Rohtas-90, Soughat-90, Shaheen- 94 and Zardana-89’ (salt-sensitive) showed higher oxidative stress demonstrations as compared to Sehar-06, Lu- 26, NARC-09, BARC-09 and Pirsbak-09’ (salt-tolerant) principally due to the low activity of antioxidant enzymes and high Na+ accumulation. Besides, the results exposed that those plants were talented to run away the ionic toxicity in saline sodic conditions by means of scavenging of ROS molecules and concurrently prohibited Na+ absorption and translocation. These qualities potentiate the plants endurance and efficiency under tense circumstances.
REFERENCES
- K. Azizpour, M. R. Shakiba, K. N. SimaK, H. Alyari, M. Moghaddam, E. Esfandiari and M. Pessarakli, “Physiological Response of Spring Durum Wheat Genotypes to Salinity,” Journal of Plant Nutrition, Vol. 33, No. 6, 2010, pp. 859-873. doi:10.1080/01904161003654097
- H. Aebi, “Catalase in Vitro,” Methods in Enzymology, Vol. 105, 1984, pp. 121-126. doi:10.1016/S0076-6879(84)05016-3
- M. Aghaleh, V. Niknam and H. Ebrahimzadeh, “Salt Stress Effect on Growth, pigments, Proteins and Lipid Peroxidationin Salicornia persica and S. europaea,” Plant Biology, Vol. 53, No. 2, 2009, pp. 243-248. doi:10.1007/s10535-009-0046-7
- P. Ahmed, C. Jaleel, M. Azooz and N. Gowher, “Generation of ROS and Non-Enzymatic Antioxidants during Abiotic Stress in Plants,” Botany Research International, Vol. 2, No. 1, 2009, pp. 11-20.
- K. P. Halder and S. W. Burrage, “Drought Stress Effects on Water Relations of Rice Grown in Nutrient Film Technique,” Pakistan Journal of Biological Sciences, Vol. 6, No. 5, 2003, pp. 441-446. doi:10.3923/pjbs.2003.441.444
- K. Asada, “The Water-Water Cycle as Alternative Photon and Electron Sinks,” Philosophical Transactions of the Royal Society B, Vol. 355, No. 1402, 2000, pp. 1419- 1431. doi:10.1098/rstb.2000.0703
- M. Ashraf, “Biotechnological Approach of Improving Plant Salt Tolerance Using Antioxidants as Markers,” Biotechnology Advances, Vol. 27, No. 1, 2009, pp. 84-93. doi:10.1016/j.biotechadv.2008.09.003
- K. Azizpour, M. R. Shakiba, K. K. N. Sima, H. Alyari, M. Moghaddam, E. Esfandiari and M. Pessarakli, “Physiological Response of Spring Durum Wheat Genotypes to Salinity,” Journal of Plant Nutrition, Vol. 33, No. 6, 2010, pp. 859-873. doi:10.1080/01904161003654097
- M. M. Azooz, A. M. Ismail and M. F. Abou-Elhamd, “Growth, Lipid Peroxidation and Antioxidant Enzymeactivities as a Selection Criterion for the Salt Tolerance of Three Maize Cultivars Grown under Salinity Stress,” International Journal of Agriculture and Biology, Vol. 11, No. 1, 2009, pp. 21-26.
- A. Bandehhag, H. Kazemi, M. Valizadeh and A. Javanshir, “Salt Tolerance of Spring Wheat (Triticum aestivum L.) Cultivars during Vegetative and Reproductive Growth,” Iran—Journal of Agricultural Science and Technology, Vol. 35, No. 1, 2004, pp. 61-71.
- M. M. Bradford, “A Rapid and Sensitive Method for the Quantization of Microgram Quantities of Protein Utilizing the Principle of Protein-Dye Binding,” Analytical Biochemistry, Vol. 72, 1976, pp. 248-254. doi:10.1016/0003-2697(76)90527-3
- I. Carmak and J. H. Horst, “Effects of Aluminum on Lipidperoxidation, Superoxide Dismutase, Catalase, and Peroxidase Activities in Root Tips of Soya Bean (Glycine max),” Plant Physiology, Vol. 83, No. 3, 1991, pp. 463- 468. doi:10.1111/j.1399-3054.1991.tb00121.x
- V. Chinnusamy, A. Jagendorf and J. K. Zhu, “Understanding and Improving Salt Tolerance in Plants,” Crop Science, Vol. 45, No. 2, 2005, pp. 437-448. doi:10.2135/cropsci2005.0437
- E. Esfandiari, F. Shekari, F. Shekari and M. Esfandiari, “The Effect of Salt Stress on Antioxidant Enzymes Activity and Lipid Peroxidation on the Wheat Seedling,” Notulae Botanicae Horti Agrobotanici Cluj-Napoca, Vol. 35, No. 1, 2007, pp. 48-56.
- A. Rao, S. D. Ahmad, S. M. Sabir, A. Shahid, A. H. Shah, M. F. Khan, S. A. Khan, S. Shaima, A. Shazia, S. R. Abbas and G. Gohar, “Antioxidant Activity of Selected Wheat Cultivars Under Salt Stress,” Journal of Medicinal Plants Research, 2013.
- T. J. Flowers and M. A. Hajibagheri, “Salinity Tolerance in Hordeum vulgare: Ionconcentrations in Root Cells of Cultivars Differing in Salt Tolerance,” Plant and Soil, Vol. 23, No. 1, 2001, pp. 1-9. doi:10.1023/A:1010372213938
- I. Fridovich, “Superoxide Dismutase: An Adaptation to a Paramagnetic Gas,” The Journal of Biological Chemistry, Vol. 264, No. 14, 1989, pp. 7761-7764.
- E. A. Ghogdi, A. Izadi-Darbandi and A. Borzouei, “Effects of Salinity on Some Physiological Traits in Wheat (Triticum aestivum L.) Cultivars,” Indian Journal of Science and Technology, Vol. 5, No. 1, 2012, pp. 0974-6846.
- E. Esfandiar, M. R. Shakiba, S. Mahboob, H. Alyari and M. Toorchi, “Water Stress, Antioxidant Enzyme Activity and Lipid Peroxidation in Wheat Seedling,” Journal of Food Agriculture and Environment, Vol. 5, No. 1, 2007, pp. 148-153.
- J. Gorham, “Salt Tolerance in the Triticeae: K/Na Discrimination in Some Perennial Wheat Grasses and Their Amphiploids with Wheat,” Journal of Experimental Botany, Vol. 45, No. 4, 1994, pp. 441-447. doi:10.1093/jxb/45.4.441
- B. Joseph and D. Jini, “Development of Salt Stress-Tolerant Plants by Gene Manipulation of Antioxidant Enzymes,” Asian Journal of Agricultural Research, Vol. 5, No. 1, 2011, pp. 17-27. doi:10.3923/ajar.2011.17.27
- J. A. Hernández and M. S. Almansa, “Short-Term Effects of Salt Stress on Antioxidant Systems and Leaf Water Relations of Leaves,” Physiologia Plantarum, Vol. 115, No. 2, 2002, pp. 251-257. doi:10.1034/j.1399-3054.2002.1150211.x
- R. K. Sairam, K. V. Rao and G. C. Srivastava, “Differential Response of Wheat Genotypes to Long Term Salinity Stress in Relation to Oxidative Stress, Antioxidant Activity and Osmolyte Concentration,” Plant Science, Vol. 163, No. 5, 2002, pp. 1037-1046. doi:10.1016/S0168-9452(02)00278-9
- S. M. S. Jalali-e-Emam, B. Alizadeh, M. Zaefizadeh, R. A. Zakarya and M. Khayatnezhad, “Superoxidedismutase (SOD) Activity in NaCl Stress in Salt-Sensitiveand Salt-Tolerance Genotypes of Colza (Brassica napus L.),” Middle East Journal of Scientific Research, Vol. 7, No. 1, 2011, pp. 7-11.
- R. J. Porra, A. Thompson and P. E. Friedelman, “Determination of Accurate Extractionand Simultaneously Equation for Assaying Chlorophyll a and b Extracted with Different Solvents: Verification of the Concentration of Chlorophyll Standards by Atomic Absorption Spectroscopy,” Biochimica et Biophysica Acta, Vol. 975, 1989, pp. 384-394. doi:10.1016/S0005-2728(89)80347-0
- Z. Peleg and E. Blumwald, “Hormone Balance and Abiotic Stress Tolerance in Crop Plants,” Current Opinion in Plant Biology, Vol. 14, No. 3, 2011, pp. 1-6. doi:10.1016/j.pbi.2011.02.001
- S. Panda, L. Singha and M. Khan, “Does Aluminum Phytotoxicity Induce Oxidative Stress in Greengram (Vignaradiata)?” Bulgarian Journal of Plant Physiology, Vol. 29, No. 1-2, 2003, pp. 77-86.
- G. Sarwar and M. Y. Ashraf, “Genetic Variability of Some Primitive Bread Wheat Varieties to Salt Tolerance,” Pakistan Journal of Botany, Vol. 35, No. 5, 2003, pp. 771-777.
- R. Munns, “Comparative Physiology of Salt and Water Stress,” Plant, Cell & Environment, Vol. 25, No. 2, 2002, pp. 239-250. doi:10.1046/j.0016-8025.2001.00808.x
NOTES
*Corresponding authors.