American Journal of Plant Sciences
Vol.4 No.2(2013), Article ID:27869,12 pages DOI:10.4236/ajps.2013.42034
Genetic Diversity of Wild Soybeans from Some Regions of Southern China Based on SSR and SRAP Markers
![]()
1College of Agriculture, South China Agricultural University, Guangzhou, China; 2Rice Research Institute, Guangdong Academy of Agricultural Sciences, Guangzhou, China.
Email: #hnian@scau.edu.cn
Received January 7th, 2013; revised January 29th, 2013; accepted February 3rd, 2013
Keywords: Genetic Diversity; Glycine soja; SSR; SRAP; Southern China
ABSTRACT
There are rich annual wild soybean (Glycine soja) resources in Southern China, which are the progenitor of cultivated soybean. To evaluate the genetic diversity and differentiation of G. soja in Southern China, we analyzed allelic profiles of 141 annual wild soybean accessions from Southern China and 8 core wild soybean accessions from Northern China by using 41 simple sequence repeat (SSR) markers and 18 Sequence-related amplified polymorphism (SRAP) primer combinations. The 41 SSR markers produced a total of 421 alleles (10.27 per locus) with a mean of gene diversity of 0.825 (Simpson index) and 1.987 (Shannon-weaver index). The 18 SRAP primer combinations detected a total of 90 polymorphism bands (5 per primer combination) with a mean of gene diversity of 0.918 (Shannon-weaver index). SSR and SRAP markers detected 43 and 5 rare alleles in 149 wild soybeans, respectively. The wild soybeans from Fujian province showed the highest genetic diversity with Shannon-weaver index of 1.837 (by SSR) and 0.803 (by SRAP), and the highest allelic richness with an average of 8.8 alleles per locus and the most number of rare alleles of 0.68 per locus based on SSR data. An analysis of Molecular Variance (AMOVA) analysis showed that significant variance did exist among Hunan, Fujian, Guangxi and Northern China subpopulations based on SSR and SRAP data. The unweighted pair-group method of the arithmetic average (UPGMA) cluster analysis indicated that the wild soybeans from Fujian province occurred in different clusters based on both SSR and SRAP data. The above results indicated that Fujian province could be the major center of genetic diversity for annual wild soybean in Southern China. In addition, Mantle test showed there was a weak positive linear correlation (r = 0.25) between SSR and SRAP analysis in the study.
1. Introduction
Annual wild soybean (Glycine soja Sieb. et Zucc.), the progenitor of the cultivated soybean (G. max (L.) Merr.), is distributed in China, Korea, Japan and the far eastern regions of Russia. The horizontal distribution in China is from 53˚ to 24˚ north latitude and from 135˚ to 97˚ east longitude [1]. China has the most abundant germplasm resources of wild soybeans in the word, currently, about 7000 wild soybean accessions had been collected and preserved in National germplasm Bank of China, accounting for more than 90% of the world saving, and still considerable wild soybeans are being collected in various regions [2]. During the long term of evolution, wild soybeans accumulated a wide range of variation to adapt to the geographic, abiotic and biotic environmental conditions. G. soja and G. max are cross compatible and can produce fertile offspring. Therefore, the wild soybean germplasm is a rich gene pool for improvement of resistances and tolerances to biotic and abiotic stresses of cultivated soybean and can used in breeding research of high yield and high protein content.
The genetic diversity of annual wild soybeans has been studied using morphological traits [3-5], isozymes [6], RFLP [7,8], RAPD [9,10], SSR [11], ISSR [12] etc.. G. soja has a higher genetic diversity than G. max, and many rare variants have been lost throughout the domestication process of G. soja [13,14]. Through SSR markers and morph-biological methods, Wen et al. [11] found the genetic diversity of G. soja was much higher than that of its cultivated counterpart, and after domestication, the genetic diversity of the cultigens decreased, with its 65.5% alleles inherited from the wild soybean, while 34.5% alleles newly emerged by evaluating the genetic diversity and differentiation of 196 wild soybeans and 200 landrace soybeans in China. Hyten et al. [14] also indicated that the soybean has lost many rare sequence variants and has undergone numerous allele frequency changes throughout its history.
With regard to the origin of soybean in China, there were several hypotheses including Northeast China origin [15,16], Yellow River Valleys origin [17,18], Southern China origin [19,20] and multiple center origin [21], according to archaeological and historical investigation, the geographic distribution genetic diversity of annual wild soybean and cultivated soybean, ecological and biological comparison. Dong et al. [4] analyzed the genetic diversity of twelve morphological and biological traits of 6172 annual wild soybeans grown in China, and proposed there were three genetic diversity centers in China, namely, the Northeast, the Yellow River Valley and the Southeast Coasts, among which the Northeast center might be the primary center of annual wild soybean in China. Xu et al. [22] found the wild soybean subpopulation from southern China showed the highest genetic diversity, the medium in Huang-Huai-Hai region, and the lowest in northern China through analyzed morphological characters, isozymes and RFLPs of cytoplamic DNA of more than 200 annual wild soybeans from various ecological regions in China, and proposed that South China was the center genetic diversity and might be the center of origin of wild soybean in China. Gai et al. [20] suggested that the ancient southern China G. soja population might be the common ancestor of all cultivated soybeans, and evaluated progressively to the ancient cultivated soybean, then ancient cultivated soybean in various regions accordingly evaluated to all kinds of cultivated soybean types. Through analyzing genetic diversity and peculiarity of annual wild soybean from various ecoregions in China, Wen et al. [11] also found the Southern China subpopulation showed the highest allelic richness, diversity index and largest number of specific-present alleles, thence, proposed Southern China should be the major center of diversity for annual wild soybean.
Tandem simple sequence repeats (SSR) or microsatellites, iterations of 1 - 6 bp nucleotide motifs, are abundant across genomes and show high levels of polymerphism. SSRs are usually considered as evolutionarily neutral DNA markers [23], and constitute a rather large fraction of non-coding DNA and are relatively rare in protein-coding regions. More than 1000 SSR markers have been explored and mapped in G. soja involved mapping populations [24]. Sequence-related amplified polymorphism (SRAP) developed by Li and Quiros in 2001 [25] is a simple marker technique for the amplification of open reading frames (ORFs). It combines simplicity, reliability, moderate throughput ratio and facile sequencing of selected bands. SRAP targets coding sequences in the genome and results in a moderate number of co-dominant markers. It is based on two-primer amplification, and twenty percent of the SRAP markers were co-dominant. Li et al. successfully tagged the glucosinolate desaturation gene BoGLS-ALK with SRAP markers. SRAPs were earliest developed and utilized in Brassica [25] and currently also amplified in other crops such as rice, wheat, cotton, maize, soybean, rapeseed (Brassica napus L.), potato, orange, eggplant [26-30]. SRAP has been adapted for a variety of purposes, including map construction, gene tagging and genetic diversity studies [31]. In the study, we utilized both SSR and SRAP markers, for a more comprehensive explanation of the genetic diversity from the whole genome level including noncoding DNA and the open reading frames.
In this article, in order to comprehensively evaluate the genetic diversity, genetic relationship and differentiation of 149 annual wild soybeans mainly from 3 provinces of southern China, we made use of SSR mainly locating at the non-coding regions and SRAP markers lying in the coding regions to analyze them, which contributes to reveal the genetic relationship of wild soybean from southern China, and proposes new evidence for explanation of origin of soybean in China.
2. Materials and Methods
2.1. Plant Materials
One hundred and forty one wild soybean accessions (Table 1) used in this study including 58 wild soybeans from Hunan province distributed in twenty three counties and cities, 56 from Fujian province distributed in twenty six counties and cities, 27 from Gunagxi province distributed in fourteen counties, and 8 from Northern China (3 from Liaoning, 2 from Hebei, 1 from Gansu, 1 from Shandong and 1from Shanxi), in which 8 wild soybeans from Xintian of Hunan province are collected by our research group, and another 141 wild soybean germplasm were provided by Prof. Qiu from the Chinese Academy of Agricultural Sciences. For analyzing the genetic relationships between wild soybeans distributed in different ecological regions, we partitioned the 149 wild soybeans into four groups that were Hunan subpopulation, Fujian subpopulation, Guangxi subpopulation and Northern China subpopulation.
2.2. Methods
2.2.1. Molecular Marker Analysis
Genomic DNA samples were extracted from fresh leaves of a single seedling at about the three-leaf stage, using the modified CTAB method. 60 SSR primer pairs (average two loci in every linkage group) reference to Hua Xie [32] and 26 SRAP primer combinations [26] were chosen to show soybean germplasm polymorphism, and finally picked out 41 SSR primer pairs (located in 20 linkage groups) and 18 SRAP primer combinations exhibited high polymorphism and clear bands to be used in calculating allelic number, genetic diversity index, ge
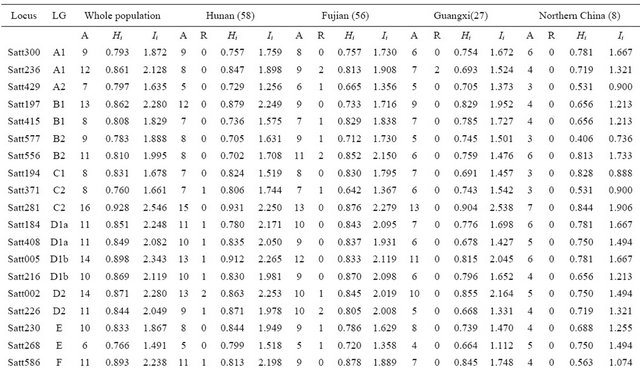
Table 1. Wild soybean accessions with their respective geographic origins and assigned clusters based on 41 SSR markers and 18 SRAP primer combinations by the UPGMA clustering.
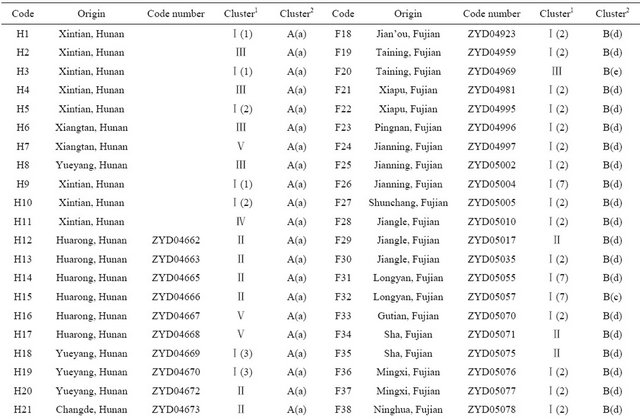

Continued
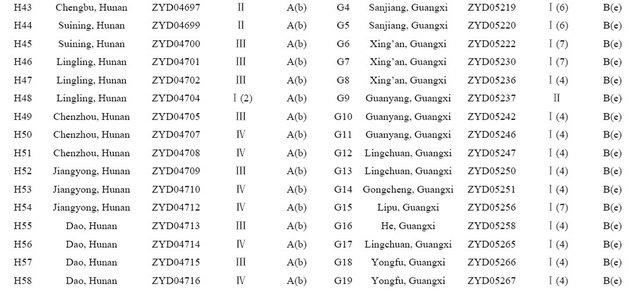
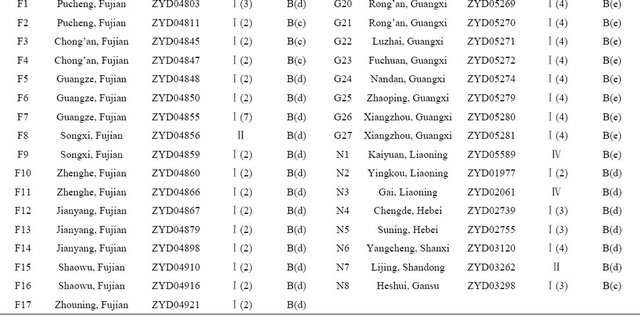
1: UPGMA Clustering by SSR data, 2: UPGMA Clustering by SRAP data.
netic distance and differentiation, and clustering analyzing.
SSR: The PCR reaction was performed in a 20-μl reaction mixture containing 2 μl of template DNA (50 ng), 2 μl of 1 × PCR buffer with MgCl2, 2 μl of 2.5 mM dNTPs, 2 μl of 1.25 μM forward and reverse primers, and 1U Taq DNA polymerase. The amplification was started with 5 min at 94˚C followed by 35 cycles of 30 s at 94˚C, 30 s at 52˚C, 30 s at 72˚C, and 10 min final extension at 72˚C. The actual annealing temperature was adjusted by the different primers.
SRAP: The PCR reaction was performed in a 20-μl reaction mixture containing 2 μl of template DNA (50 ng), 2 μl of 1 × PCR buffer with MgCl2, with MgCl2, 2 μl of 2.5 mM dNTPs, 2 μl of 3 μM forward and reverse primers, and 1U Taq DNA Polymerase. The amplification was started with 5 min at 94˚C followed by 5 cycles of 1min at 94˚C, 1min at 35˚C, 1min at 72˚C, and then 35 cycles of 1min at 94˚C, 1min at 50˚C, 1min at 72˚C, and 7 min final extension at 72˚C.
Amplified products were fractionated by electrophoresis in 6% denaturing polyacrylamide gels and stained with silver staining. The size of the stained band was analyzed based on its migration distance relative to the 50 bp ladder DNA Marker (Dongsheng biotechnology Ltd.).
2.2.2. Data Analysis
Banding profiles generated by SSR and SRAP markers were compiled into a data binary matrix based on the presence (1) or absence (0) of the selected band. Every primer pair or combination as a locus and every variant (band) as an allele were counted.
Genetic diversity was calculated using Simpson genetic diversity index (Hi) and Shannon-Weaver index (I). ;
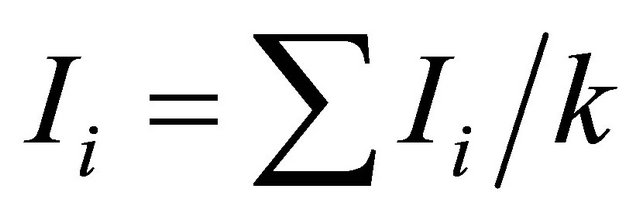
; , where pi is the frequency of the ith allele; pij is the frequency of jth allele at ith locus. Average diversity index
  was computed with
 ;
;  where k means the total number of loci in the study. For SSR, number of alleles (A) and rare alleles ® are counted for each locus, where A=ΣAi; Ai is the number of alleles of the i th locus in a population; A is the total number of alleles of all loci in a population. And for SRAP, number of polymerphism bands (P) and rare variation® for each primer combination are also counted.
The genetic similarity matrix was used in cluster analyses with the unweighted pair-group method of the arithmetic average (UPGMA) under NYSYS-pc 2.1 (Exeter Software, NY, USA) and the resulting clusters were expressed as dendrograms. To examine the genetic relationship among populations, Nei’s [33] genetic distance was generated by GenAlEx 6 [34] and a dendrogram was constructed with the unweghted pair-group method of averages (UPGMA). An analysis of Molecular Variance (AMOVA) was used to detect the population differentiation and was also calculated under the Gen AlEx6. F-statistic were tested by 1000 permutations and significant differences between populations declared if measured variance is lower than 95% of the variance in the null distribution [35]. A Mantel test [36] was performed to estimate a correlation between the matrices of Nei’s [33] genetic distances generated by SSR and SRAP data using GenAlEx 6 (1000 permutations).
3. Results
3.1. Genetic Diversity and Allelic Richness by SSR and SRAP Markers
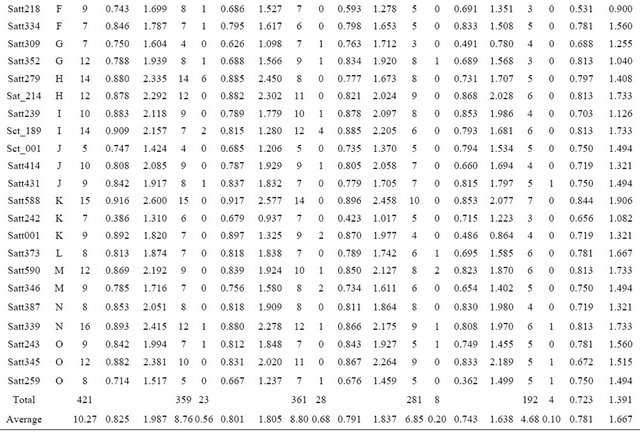
Forty one SSR loci produced a total of 421 alleles in 149 wild soybeans with a mean of 10.27 per locus and a range from 5 to 16. The wild soybeans from Fujian province had the highest allelic richness with an average of 8.8 alleles per locus, and that from Guangxi province had the lowest allelic richness with an average of 6.85 alleles per locus in the three Southern wild soybean populations (Table 2). 18 SRAP primer combinations detected a total of 90 polymorphic bands in whole wild soybean population with a mean of 5 per primer combinations. Hunan subpopulation was amplified the most polymorphic bands (P = 86) in 4 subpopulations (Table 3). The two mean genetic diversity index based on SSR data showed the different tendency that Hunan subpopulation had the highest genetic diversity in the Simpson index Hi = 0.801 (Fujian: Hi = 0.791); while Fujian subpopulation had the highest genetic diversity in Shannon-Weaver index Ii = 1.837 (Hunan: Ii = 1.805), however in comparison, the different degree of Ii values between Fujian and Hunan subpopulations (0.32) was much higher than that of Hi (0.01) (Table 2). The mean genetic diversity index based on 18 SRAP markers showed the same tendency as SSR, that was Fujian subpopulation was detected the highest genetic diversity (I = 0.803) in whole population (Table 3). In addition, the data of gene diversity index showed there was more genetic diversity detected by SSR markers (Ii = 1.987) than by SRAP markers (Ii = 0.918), but due to the number of SRAP primer combination was relatively fewer, this result further needed to be verified.
The number of rare alleles of Fujian subpopulation based on SSR data was the largest with an average of 0.68 per locus, and that of Guangxi subpopulation was the least (0.20) in three southern China populations. Although the number of wild soybean of Northern China in this article was only 8, there were still found a total of 4 rare alleles in the population. It was worth mentioning that there had 4 (of 6) rare alleles at Satt279 on LG H in wild soybean of Hunan were also detected in cultivated soybean of Hunan in our another research, and at this locus was not any rare allele detected in another 3 wild soybean populations, therefore we speculated some new variations should have arisen only in cultivated and wild soybean of Hunan province (Table 2). Different from SSR results, the number of rare variations detected in Hunan subpopulation was the most in 4 wild soybean populations (Table 3).
3.2. Genetic Relationships
3.2.1. UPGMA Clustering Analysis of 149 Wild Soybeans by SSR
The SSR profile was used to determine the genetic similarity matrices, which was then used to construct dendrogram by the UPGMA method. The UPGMA-derived dendrogram assigned the 149 wild soybeans into six major clusters designated as: “Ⅰ”, “Ⅱ”, “Ⅲ”, “Ⅳ”, “Ⅴ”, “Ⅵ” at the Similarity Coefficient of 0.8. Cluster “Ⅰ” consisted of 93 wild soybeans including nearly a quarter of wild soybeans from Hunan province (16) and the vast majority of wild soybeans from Fujian (46) and about all wild soybeans from Guangxi province (26) (Table 1). For further analyzing the relationships of wild soybeans
Table 2. Number of alleles and genetic diversity index for each SSR primer detected in 4 wild soybean subpopulations.
A: Number of alleles at each locus; R: Number of rare allele at each locus; Hi: Simpson diversity index for each locus; Ii: Shannon-weaver diversity index for each locus.
Table 3. Genetic diversity of wild soybean populations for 18 SRAP primer combinations.
Ii: Shannon-weaver index for each primer combination; P: Number of polymorphism band for each primer combination; R: Number of rare variation for each primer combination.
from different regions, Cluster ‘Ⅰ’was further classified into 8 subgroups. Subgroup 1 consisted of 3 wild soybeans from Xintian county of Southern Hunan; Subgroup 2 consisted of 41 wild soybeans including 37 from Fujian, 3 from Southern Hunan and 1 from Liaoning of Northern China; Subgroup 3 consisted of 12 wild soybeans in which 8 from Hunan, 2 and 1 respectively from Hebei and Gansu of Northern China, and 1 from Fujian; Subgroup 4 consisted of 21 wild soybeans in which 20 from Guangxi and 1 from Shanxi of Northern China; Subgroup 5 consisted of 3 wild soybeans from Fujian; Subgroup 6 consisted of 5 wild soybeans including 3 from Guangxi, 1 from Fujian and 1 from Hunan; Subgroup 7 consisted of 7 wild soybeans including 3 from Guangxi, 4 from Fujian; Subgroup 8 consisted of only 1 wild soybean from Hunan. From above analysis, the wild soybean from Southern Hunan gathered in subgroup 1 and 2, and another 8 from Hunan including the northern, western and central region were gathered in subgroup 3, besides having two from central region of Hunan was clustered in subgroup 6 and 8; all wild soybeans from Guangxi except for one from Guanyang were clustered in Cluster “Ⅰ” and most of them gathered in subgroup 4; while in this cluster, the wild soybean germplasm from Fujian gathered in subgroup 2, 3, 5, 6, 7, indicated the highest distribution.
Cluster “Ⅱ” consisted of 22 wild soybeans including 15 from Hunan, 5 from Fujian, 1 from Guangxi and 1 from Shandong of Northern China in which 5 from Southwestern, 1 from Sha county of Fujian and 1from Shandong of Northern clustered together; 3 from Western Hunan and 1 from Changsha of Eastern Hunan clustered together.
Cluster “Ⅲ” included 13 wild soybeans from Hunan and 5 from Fujian. In which, 6 from Southern Hunan, 2 from Northeastern Hunan and 1from Western Hunan clustered in a small group.
Cluster “Ⅳ” included 8 wild soybeans from Hunan and 2 from Liaoning of Northern China in which 7 from Southern Hunan and 1 from Liuyang of Eastern Hunan.
Cluster “Ⅴ” consisted of 5 wild soybeans all from Hunan including 3 from Northeast region, 1 from Western region and 1 from Easter region. Cluster “Ⅵ” included only 1 wild soybean from Western Hunan. Through analyzing the dendrogram based on SSR we found the wild soybean from Guangxi mainly gathered in Cluster “Ⅰ”; the wild soybean from Hunan mainly gathered in the lower part of the dendrogram including Cluster “Ⅱ” to “Ⅴ”; as for the wild soybean population of Fujian, in which 46 gathered in Cluster “Ⅰ”, 10 gathered in Cluster “Ⅱ” to “Ⅲ”, in spite of a few of wild soybeans gathered in the lower part of the dendrogram, their distribution was very widely. Therefore, we thought that Fujian could be a center of genetic diversity of wild soybean in Southern China. And the wild soybean from Fujian and Guangxi had closer genetic distance than that from Hunan, in spite of the geographic distance between Guangxi and Hunan was smaller than that between Guangxi and Fujian. Furthermore, the wild soybeans from Liaoning showed higher genetic distribution than others from Northern China in the study.
3.2.2. UPGMA Clustering Analysis of 149 Wild Soybeans by SRAP
The clustering results of UPGMA of 149 wild soybeans by SRAP were very different with that by SSR, in which the wild soybeans from Hunan all clustered together in a Cluster alone while they were distributed in all major Clusters based on SSR. The 149 wild soybeans were distinctly assigned into two major clusters designated as “A” and “B” by the UPGMA-derived dendrogram based on SRAP (Table 1). Cluster “A” consisted of 58 wild soybeans which all from Hunan, and was further classified into two subgroups named as “a” and “b”. Subgroup “a” consisted of 36 wild soybeans including 20 from Northern region of Hunan mainly located on between latitude 29˚ and 30˚, 8 from Xintian of Southern Hunan, 4 from Western Hunan, 4 from Eastern region of Hunan; Subgroup “b” consisted of 22 wild soybeans in which 13 from Southern Hunan, 6 from Southwestern Hunan and 3 from Eastern Hunan. The same with the results based on SSR, in spite of the number of materials was few, the wild soybeans from Eastern Hunan were assigned in two different groups, which suggested the wild soybean from eastern region of Hunan including Changsha and Xiangtan showed higher genetic distribution.
Cluster “B” consisted of wild soybeans respectively from Fujian, Guangxi and Northern China, and could be further classified into three subgroups designated as “c”, “d” and “e” in which 27 wild soybeans from Guangxi all gathered in subgroup “e”; among 8 the wild soybean germplasm from Northern China, 1 from Gansu gathered in subgroup “c”, 6 (2 from Liaoning, 2 from Hebei, 1 from Shanxi and 1from Shandong) gathered in subgroup “d”, and 1 from Liaoning was clustered in subgroup “e”; the wild soybeans from Fujian were cluster in three subgroups, in which 4 gathered in subgroup “c”, 35 in subgroup “d” and 17 in subgroup “e”.
Similarly, the wild soybeans from Fujian and Guangxi were clustered together in one Cluster, and the genetic distance of wild soybeans of Hunan was far from them.
3.3. Genetic Differentiation and Distance among the Four Wild Soybean Populations
The values of Nei Genetic Distance revealed that the genetic distance between Hunan and Fujian wild soybean populations was smallest (0.329), and that between the Northern China and 3 Southern wild soybean populations was farer based on SSR analysis in the study (Table 4).
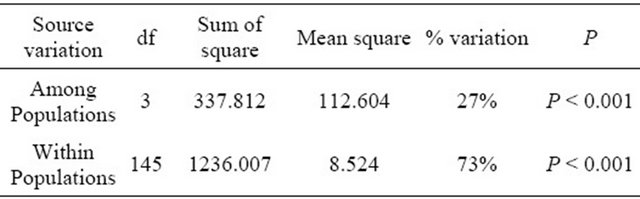
On the other hand, the analysis of molecular variance (AMOVA) was used to partition the SSR and SRAP variation among and within 4 wild soybean populations. Most of variation (SSR 94%, SRAP 73%) was detected within the four populations, while only a smaller but significant part of the variation (SSR 6%, SRAP 27% P < 0.001) was attributed to variation among subpopulations (Tables 5 and 6), which indicated that geographic differentiation played an important role in genetic variation. In addition, the AMOVA by SRAP showed much more variation among subpopulations (27%) than that by SSR in the study.
UPGMA Clustering Analysis Based on Genetic Distance of the Four Subpopulations
The dendrogram based on the genetic distance by SSR
Table 4. Genetic Distance (D) among four wild soybean populations.

D: Nei’s Genetic Distance among four subpopulations in the study.
Table 5. Analysis of molecular variance (AMOVA) based on SSR data.
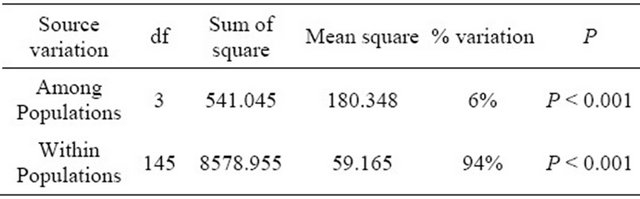
Table 6. Analysis of molecular variance (AMOVA) based on SRAP data.
and SRAP among the four wild soybean populations illustrated the genetic relationship between the Hunan and Fujian wild populations was nearest, and the wild soybean population from Northern China was finally clustered with another three wild populations from Southern China at the D = 0.56 based on SSR (Figure 1). The dendrogram by SRAP showed the very different results that the Fujian, Guangxi and Northern China subpopulations clustered together firstly, then clustered with Hunan wild soybean population at D = 0.93 (Figure 2).
3.4. Mantel Test between SSR and SRAP
Mantel test between distances matrices of SSR and SRAP indicated that there was a positive linear correlation between the two elements (r = 0.25), and which was a weak correlation.
4. Discussion
4.1. Genetic Diversity of Wild Soybean in China
The genetic diversity of wild soybean from some provinces of South China had been analyzed in many studies. Zeng et al. [37] analyzed the genetic diversity of 200 wild soybean accessions collected from Guangxi by 23 pairs SSR primers, with an average of Simpson index was 0.689 and Shannon-weaver was 0.683. Liu et al. [38]
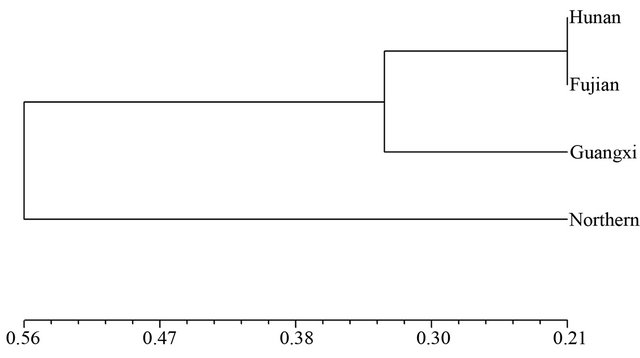
Figure 1. Dendrogram of Nei’s genetic distance among subpopulations based on SSR data.
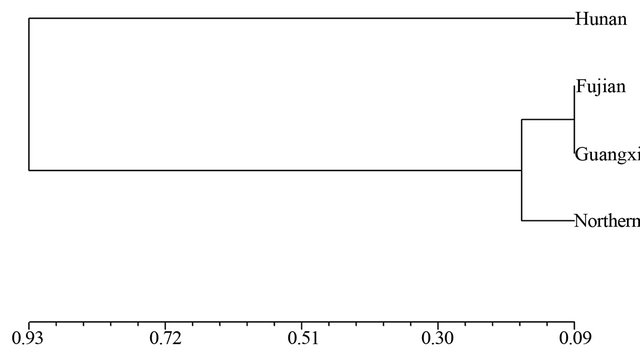
Figure 2. Dendrogram of Nei’s genetic distance among subpopulations based on SRAP data.
investigated that the distribution and characters of wild soybean in 41 counties of Hunan province and found the germplam resources were very rich with vast geographic distribution and many populations. In this study, we analyzed the genetic richness, genetic diversity, and rare variants of annual wild soybean populations mainly from southern China including Hunan, Fujian, Guangxi, and some provinces of Northern China by SSR and SRAP markers. We found that the wild soybean from Fujian province showed the highest genetic richness, the largest genetic diversity index and the most number of rare variants in the four populations based on SSR data in the study, and genetic diversity index by SRAP also showed Fujian subpopulation had the highest genetic diversity in whole population. In the dendrogram, the wild soybean accessions from Fujian showed the highest genetic distribution in different clusters by SSR clustering. In addition, we also found the wild soybeans from Guangxi clustered with those from Fujian in dendrograms based on SSR and SRAP data, although Guangxi is closer to Hunan than to Fujian. Cheng et al. [39] analyzed 192 wild soybean genotypes from Jiangxi province in Southern China using 48 SSR markers shared 73% SSR markers with our study, and the results showed the average polymorphism information content (PIC, or Simpson index) was 0.706, which was also lower than genetic diversity of Fujian subpopulation (Simpson index = 0.791) in this study.
Therefore, based on the above results, we thought that Fujian province especially 25˚ north latitude region could be one of centers of the genetic diversity of wild soybean in Southern China. Zhuang et al. [19] also proposed that the southern China, especially 25˚ north latitude region was worth noting in the study of origin of soybean because they found that the similarity between the DNA fingerprints of wild soybean and cultivated soybean in southern China was higher than that in northern China. It was also worth mentioning that SRAP markers produced the most polymorphic bands (86) and rare variation site (4) in Hunan subpopulation than another 3 subpopulations, which might be due to the types of phenotype of Hunan wild soybeans was more richer than that of Fujian wild soybeans in the study.
4.2. Geographic Differentiation and Distribution
In the long-term evolution of wild soybean, different wild soybean populations were formed to adapt to the special ecological environment. We detected some specific-present alleles in different wild soybean populations from Hunan, Fujian, Guangxi and some regions of Northern China. In population genetics, if an allele is detected in only one subpopulation in whole population, the allele is called rare allele [40]. The results showed the wild soybean population from Fujian was detected the most rare alleles (28) at 41 SSR loci, and even if Northern China population included only 8 core germplasm was detected four rare alleles. We also found there were 4 rare alleles detected at Satt279 on LG H in wild population from Hunan also detected in cultivated soybean population from Hunan in our other research, and not rare allele was found in Fujian, Guangxi and Northern China wild populations at the locus. There were also some rare variations detected in wild soybean populations using 18 SRAP primer combinations, in which Hunan subpopulation had the most number of rare variations with a total of 4 rare variations and Fujian subpopulation was also detected one rare variation. In the light of neutral theory, Kimura [41] thought that polymorphic alleles were predominantly neutral, rare variant alleles could included slightly deleterious and sometimes even definitely deleterious alleles in addition to selectively neutral ones, which indicated that rare variant allele reflect the total mutation rate much more faithfully than polymorphic alleles. In addition, for extremely large populations undergoing sudden environmental change, a rare allele of major effect contribute to adaptation to sustained intense directional selection, and restricted population size may be elimination of advantageous rare alleles [42], which suggests that for the certain population, the number of rare alleles reflects the richness of genetic diversity to some extent and the ability to adaptation in the local ecological environment. Therefore we suggested that some special variations at unique locus might be arisen in specific ecological populations including wild and cultivated soybean for adapting to local environment, and geographic differentiation should have its relevant genetic bases. The variation among different provinces accounted for 6% and 27% of the total variation respectively by SSR and SRAP, which were less than the intra-subpopulations variation. Wen et al. [11] found 2.7% variation obtained among subpopulations of annual wild soybean in China based on SSR data, and thought the number of mutant alleles due to geographic differentiation should be relatively small since all the alleles were formed and accumulated during the long systematic development of the species.
The relationships among subpopulations by UPGMA clustering showed difference results between SSR and SRAP, in the SSR clustering, the wild soybean population from Hunan was clustered with that from Fujian firstly, then with Guangxi subpopulation, and finally with Northern China subpopulation; while in the SRAP clustering, Fujian subpopulation was clustered with Guangxi subpopulation firstly, secondly with Northern China population, finally with Hunan subpopulation. But from UPGMA clustering dendrograms of all 149 wild soybean accessions in the study, we found whether in SSR or SRAP clustering results, the wild soybeans from Hunan showed farer genetic relationship with Fujian and Guangxi wild soybeans, and the wild soybeans from Guangxi all clustered with wild soybeans from Fujian. The present results of genetic relationship among different provinces in southern China showed the genetic distance between Fujian and other two provinces (Hunan and Guangxi) in southern China was closer. Many researchers thought South China was the center of origin of wild and cultivated soybean [20,22,11], while the soybean of various regions in South China had different genetic diversity, through our study the wild soybean from Fujian province showed highest genetic diversity and rare variations, at the same time, the wild soybeans from Fujian showed highest genetic distribution in clustering dendrograms, and had nearer genetic distance to Hunan and Guangxi, which suggested that Fujian province region could be one of center of diversity of annual wild soybean in southern China and could be a center of origin of wild soybeans, but because of the wild soybean materials in the study only from a few of region in southern China, so we should do further research about the origin of wild soybean of southern China. Liu et al. [43] also proposed that the photoperiod and temperature reaction of wild soybean in Fujian was as same as that of the autumn cultivated soybean, and speculated northwest of Fujian might be the origin of cultivated soybean.
4.3. Comparison between SSR and SRAP Markers
SSRs (Simple Sequence Repeats), are uniformly distributed on the eukaryotic genome, and are often found at frequencies much higher than would be predicted purely on the grounds of base composition. SSRs are inherited by codominant Mendelian pattern, and mainly located in non-coding region of genome. While SRAP (Sequencerelated amplified polymorphism) are explored for amplification of open reading frames (ORFs), which are a portion of a gene sequence and contain a base sequence can be encoded protein. SRAP targets coding sequences in the genome and results in a moderate number of codominant markers [44]. Due to SSRs and SRAPs amplified distinct region in the genome, we used the two molecular markers and analyzed the genetic diversity and relationship of wild soybean accessions in different provinces through more comprehensive point of view.
Mantle test indicated that there were weak correlation between SSR and SRAP (r = 0.25). Gai et al. [30] found, genetic distance estimated based on SSR and SRAP data were significantly correlated with each other, and similar clustering results were achieved through investigating 19 maize varieties, and SRAP markers displayed more genetic variation, diversity and higher discriminative power in varieties identification in Maize. In the study, we also found that there were some similarities between SSR and SRAP result, for instance, the genetic diversity index all showed the genetic diversity of Fujian subpopulation was highest in the four subpopulations in the study; and the clustering results of SSR and SRAP data all showed the gene relationship of wild soybeans from Hunan was far from the other two subpopulations in Southern China including Fujian and Guangxi; moreover the two semiwild soybeans from Hunan (H46 and H47) which 100- seed weight = 3 g clustered together whether in SSR clustering or in SRAP clustering. In addition there were some difference in the clustering results that Hunan subpopulation clustered alone in a group had farthest genetic distance from the other wild soybean subpopulation from Southern China, and the wild soybeans from Northern China were clustered with Fujian wild soybeans in a group in SRAP clustering; while in SSR clustering course, Hunan subpopulation was clustered with Fujian subpopulation, and Northern China subpopulation showed the farthest genetic relationship with the another three subpopulations from Southern China. And genetic diversity index (I = 0.918) by using SRAP was lower than that by using SSR (I = 1.995), which could be caused by the relatively small number of SRAP primer combinations Because of the amplification section was almost different between SSR and SRAP, the discrepancy of clustering should exist between SSR and SRAP. Gai et al. [30] proposed the hybrid purity identified by SRAP marker was more vicinal to field test than that by SSR marker. We should do further investigation to verify which marker was closer to the phenotypes using more SRAP primer combinations. At present, we suggested that using SSR and SRAP markers could reflect the whole genome variation more comprehensively, and the analysis results were more reliable.
REFERENCES
- F. S. Li, “Geographical Distribution and Ecological Diffusing of Wild Soybean Germplasm in China,” In: F. S. Li, Ed., Researching Progress on Wild Soybean of China, Chinese Agricultural Press, Beijing, 1994, pp. 40-48.
- Y. L. Ding, T. J. Zhao and J. Y. Gai, “Genetic Diversity and Ecological Differentiation of Chinese Annual Wild Soybean (Glycine soja),” Biodiversity Science, Vol. 16, No. 2, 2008, pp. 133-142.
- B. C. Zhuang, H. Xu and Y. M. Wang, “Polymorphism and Geographical Distribution of the Stem and Leaf Characters of Wild Soybean (Glycine soja) in China,” Acta Agronomica Sinica, Vol. 22, No. 5, 1996, pp. 583- 586.
- Y. S. Dong, B. C. Zhuang, L. M. Zhao, H. Sun and M. Y. He, “The Genetic Diversity of Annual Wild Soybeans Grown in China,” Theoretical and Applied Genetics, Vol. 103, No. 1, 2001, pp. 98-103. doi:10.1007/s001220000522
- K. J. Wang, X. H. Li and F. S. Li, “Phenotypic Diversity of the Big Seed Type Subcollection of Wild Soybean (Glycine soja Sieb.et Zucc.) in China,” Genetic Resources and Crop Evolution, Vol. 55, No. 8, 2008, pp. 1335-1346. doi:10.1007/s10722-008-9332-z
- J. Li, Y. Tao, S. Z. Zheng and J. L. Zhou, “Isozymatic Differentiation in Local Population of Glycine soja Sieb & Zucc,” Acta Botanica Sinica, Vol. 37, 1995, pp. 669- 676.
- Z. A. Hu, M. Zhong, W. Wei and H. X. Wang, “Detection of DNA Diversity of Wild Soybean (Glycine soja) in Natural Populations by New Procedure of RAPD and RFLP,” Soybean Genetics Newsletter, Vol. 24, 1997, pp. 37-38.
- J. Abe, A. Hasegawa, H. Fukushi, T. Mikami, M. Ohara and Y. Shimamoto, “Introgression between Wild and Cultivated Soybeans of Japan Revealed by RFLP Analysis of Chloroplast DNAs,” Economic Botany, Vol. 53, No. 3, 1999, pp. 285-291. doi:10.1007/BF02866640
- Z. L. Li and R. L. Nelson, “RAPD Marker Diversity among Cultivated and Wild Soybean Accessions from Four Chinese Provinces,” Crop Science, Vol. 42, No. 5, 2002, pp. 1737-1744. doi:10.2135/cropsci2002.1737
- Y. W. Chen and R. L. Nelson, “Genetic Variation and Relationships among Cultivated, Wild, and Semiwild Soybean,” Crop Sciences, Vol. 44, No. 1, 2004, pp. 316- 325. doi:10.2135/cropsci2004.0316
- Z. X. Wen, Y. L. Ding, T. J. Zhao and J. Y. Gai, “Genetic Diversity and Peculiarity of Annual Wild Soybean (G. soja Sieb. et Zucc.) from Various Eco-Regions in China,” Theoretical and Applied Genetics, Vol. 119, No. 2, 2009, pp. 371-381. doi:10.1007/s00122-009-1045-y
- J. Yan, T. H. He and B. R. Lu, “Genetic Spatial Clustering: Significant Implications for Conservation of Wild Soybean (Glycine soja: Fabaceae),” Genetica, Vol. 128, No. 1-3, 2006, pp. 41-49. doi:10.1007/s10709-005-4823-8
- D. H. Xu and J. Y. Gai, “Genetic Diversity of Wild and Cultivated Soybeans Growing in China Revealed by RAPD Analysis,” Plant Breeding, Vol. 122, No. 6, 2003, pp. 503-506. doi:10.1046/j.0179-9541.2003.00911.x
- D. L. Hyten, Q. J. Song, Y. L. Zhu , I. Y. Choi, R. L. Nelson, J. M. Costa, J. E. Specht, R. C. Shoemaker and P. B. Cregan, “Impacts of Genetic Bottlenecks on Soybean Genome Diversity,” Proceedings of the National Academy of Sciences of the United States of America, Vol. 103, No. 45, 2006, pp. 16666-16671. doi:10.1073/pnas.0604379103
- Y. Fukuda, “Cytogenetical Studies on the Wild and Cultivated Manchurian Soybeans (Glycine L.),” Japanese Journal of Botany, Vol. 6, 1933, pp. 489-506.
- F. S. Li, “Study on Origin and Evolution of Soybean,” Soybean Science, Vol. 13, No. 1, 1994, pp. 61-66.
- T. Hymowitz and C. A. Newell, “Taxonomy of Genus Glycine, Domestication and Uses of Soybeans,” Economic Botany, Vol. 35, No. 3, 1981, pp. 272-288. doi:10.1007/BF02859119
- B. Xu, H. Xu, B. C. Zhuang, Q. H. Lu, Y. M. Wang and F. S. Li, “The Genetic Diversity and Geographic Distribution of Kernel Traits of G. soja in China,” Acta Agronomica Sinica, Vol. 21, No. 6, 1995, pp.733-739.
- B. C. Zhuang, D. W. Hui, Y. M. Wang, J. Gu, B. Xu and S. Y. Chen, “RAPD Analysis of Different Evolutionary Types in Different Latitude in China,” Chinese Science Bulletin, Vol. 39, No. 23, 1994, pp. 2178-2180.
- J. Y. Gai, D. H. Xu and Z. Gao, “Studies on the Evolutionalry Relasionship among Eco-Types of G. max and G. soja in China,” Acta Agronomica Sinica, Vol. 26, No. 5, 2000, pp. 513-520.
- S. L. Lv, “Discussion on the Original Region of Cultivated Soybean in China,” Scientia Agricultura Sinica, No. 4, 1978, pp. 90-94.
- D. H. Xu, Z. Gao, Q. Z. Tian, J. Y. Gai, H. Fukushi, S. Kitajma, J. Abe and Y. Shimamoto, “Genetic Diversity of the Annual Wild Soybean (Glycine soja) in China,” Chinese Journal of Applied & Environmental Biology, Vol. 5, No. 5, 1999, pp. 439-443.
- P. Awadalla and K. Ritland, “Microsatellite Variation and Evolution in the Mimulus guttatus Species Complex with Contrasting Mating Systems,” Molecular Biology and Evolution,” Vol. 14, No. 10, 1997, pp. 1023-1034. doi:10.1093/oxfordjournals.molbev.a025708
- Q. J. Song, L. F. Marek, R. C. Shoemaker, K. G. Lark, V. C. Concibido, X. Delannay, J. E. Specht and P. B. Cregan, “A New Integrated Genetic Linkage Map of the Soybean,” Theoretical and Applied Genetics, Vol. 109, No. 1, 2004, pp. 122-128. doi:10.1007/s00122-004-1602-3
- G. Li and C. F. Quiros, “Sequence-Related Amplified Polymorphism (SRAP), a New Marker System Based on a Simple PCR Reaction: Its Application to Mapping and Gene Tagging in Brassica,” Theoretical and Applied Genetics, Vol. 103, No. 2-3, 2001, pp. 455-461. doi:10.1007/s001220100570
- Y. C. Wen, H. Z. Wang, J. X. Shen, G. H. Liu and S. F. Zhang, “Analysis of Genetic Diversity and Genetic Basis of Chinese Rapeseed Cultivars (Brassica napus L.) by Sequence-Related Amplified Polymorphism Markers,” Scientia Agricultura Sinica, Vol. 39, No. 2, 2006, pp. 246-256.
- C. Li, X. X. Lu, Z. E. Zhang, X. L. Chen, F. Lin, X. Y. Zhang and C. J. Liu, “Genetic Integrity Analysis of Cotton (Gossypium hirsutum Linn.) Accessions Using SRAP and SSR Markers,” Journal of Plant Genetic Resources, Vol. 8, No. 1, 2007, pp. 21-25.
- F. Zhao, Z. J. Cai, T. Z. Hu, H. G. Yao, L. Wang, N. Dong, B. Wang, Z. G. Ru and W. X. Zhai, “Genetic Analysis and Molecular Mapping of a Novel Gene Conferring Resistance to Rice Stripe Virus,” Plant Molecular Biology Reporter, Vol. 28, No. 3, 2010, pp. 512-518. doi:10.1007/s11105-009-0178-0
- N. Mutlu, F. H. Boyacı, M. Göçmen and K. Abak, “Development of SRAP, SRAP-RGA, RAPD and SCAR Markers Linked with a Fusarium Wilt Resistance Gene in Eggplant,” Theoretical and Applied Genetics, Vol. 117, No. 8, 2008, pp. 1303-1312. doi:10.1007/s00122-008-0864-6
- S. P. Gai, W. L. Gai and J. Y. Huang, “Comparison of SSR and SRAP Marker for Varieties Identification in Maize (Zea mays L.),” Journal of Plant Genetic Resources, Vol. 12, No. 3, 2011, pp. 468-472.
- O. Gulsen, S. Karagul and K. Abak, “Diversity and Relationships among Turkish Okra Germplasm by SRAP and Phenotypic Marker Polymorphism,” Biologia, Vol. 62, No. 1, 2006, pp. 41-45. doi:10.2478/s11756-007-0010-y
- H. Xie, “Genetic Diversity on Representative Samples from Primary Core Collection of Soybean (G. max) in China,” Ph.D. Thesis, Chinese Academy of Agricultural Sciences, Beijing, 2002.
- M. Nei, “Estimation of Average Heterozygosity and Genetic Distance from a Small Number of Individuals,” Genetics, Vol. 89, 1978, pp. 583-590.
- R. Peakall and P. E. Smouse, “GENALEX 6: Genetic Analysis in Excel. Population Genetic Software for Teaching and Research,” Molecular Ecology Notes, Vol. 6, No. 1, 2006, pp. 288-295. doi:10.1111/j.1471-8286.2005.01155.x
- L. Excoffier, P. Smouse and J. M. Quattro, “Analysis of Molecular Variance Inferred from Metric Distances among DNA Haplotypes: Application to Human Mitochondrial DNA Restriction Data,” Genetics, Vol. 131, No. 2, 1992, pp. 479-491.
- N. A. Mantel, “The Detection of Disease Clustering and a Generalized Regression Approach,” Cancer Research, Vol. 27, 1967, pp. 209-220.
- W. Y. Zeng, J. Liang, Y. Chen, Q. Y. Wei, F. Y. Tang, K. Z. Zhong and W. J. Chen, “Genetic Diversity Analysis of New Wild Soybean Collection in Guangxi,” Soybean Science, Vol. 30, No. 3, 2011, pp. 379-383.
- H. Y. Liu, H. Zhang, X. Zhou, K. J. Wang and X. H. Li, “Preliminary Report on Distribution Status and Character Identification of Wild Soybean in Hunan,” Hunan Agricultural Sciences, No. 5, 2008, pp. 20-21.
- C. M. Cheng, C. Y. Yang, Q. B. Ma and H. Nian, “Genetic Diversity Analysis of Wild Soybean Resources in Jiangxi,” Journal of Plant Genetic Resources, Vol. 12, No. 6, 2011, pp. 928-933.
- G. B. Xu, “Plant Population Genetics,” 2th Edition, Science Press, Beijing, 2009.
- M. Kimura, “Rare Variant Alleles in the Light of the Neutral Theory,” Molecular Biology and Evolution, Vol. 1, No. 1, 1984, pp. 84-93.
- R. Lande, “Adaptation to an Extraordinary Environment by Evolution of Phenotypic Plasticity and Genetic Assimilation,” Journal Evolutionary Biology, Vol. 22, No. 7, 2009, pp. 1435-1446. doi:10.1111/j.1420-9101.2009.01754.x
- D. J. Liu and S. C. Xu, “The Ecological Distribution and Classification on Wild Soybean in Fujian,” Journal of Fujian Academy of Agricultural Sciences, Vol. 6, No. 2, 1991, pp. 18-24.
- M. Agarwal, N. Shrivastava and H. Padh, “Advances in Molecular Marker Techniques and Their Applications in Plant Sciences,” Plant Cell Reports, Vol. 27, No. 4, 2008, pp. 617-631. doi:10.1007/s00299-008-0507-z
NOTES
*Authors contributed equally.
#Corresponding author.