Open Journal of Fluid Dynamics
Vol.2 No.4A(2012), Article ID:26349,6 pages DOI:10.4236/ojfd.2012.24A028
A Computational Study of the Gas-Solid Suspension Flow through a Supersonic Nozzle
1College of Mechanical Engineering & Automation, Zhejiang Sci-Tech University, Hangzhou, China
2School of Mechanical Engineering, Andong National University, Andong, South Korea
Email: *kimhd@andong.ac.kr
Received September 13, 2012; revised October 25, 2012; accepted November 4, 2012
Keywords: Gas-Solid Suspension Flow; Supersonic Nozzle; Flow Choking; Internal Flow; Shock Wave
ABSTRACT
The present study focuses on numerical simulation of the gas-solid suspension flow in a supersonic nozzle. The EulerLagrange approach using a Discrete Phase Model (DPM) has been used to solve the compressible Navier-Stokes equations. A fully implicit finite volume scheme has been employed to discretize the governing equations. Based upon the present CFD results, the particle loading effect on gas-solid suspension flow was investigated. The results show that the presence of particles has a big influence on the gas phase behavior. The structure of shock train, the separation point, and the vortex of the backflow are all related to particle loading. As the particle loading increases the flow characteristics behave differently such as 1) the strength of shock train decreases, 2) the separation point moves toward the nozzle exit, 3) the number and strength of vortex increase, 4) the strength of first shock also increases while the other pseudo shocks decreases. The change of gas flow behavior in turn affects the particle distribution. The particles are concentrated at the shear layers separated from the upper wall surface.
1. Introduction
High-velocity gas flows including very fine solid particles are often encountered in many diverse fields of engineering applications, such as solid rocket engines, pneumatic conveying systems, powdered drug delivery devices, thermal spray coating systems, etc. [1]. Such gas-solid suspension flows can be obtained in supersonic nozzles in which fine particles with several to several 10 μm in diameter are flowing suspended with the high velocity gas stream. The detailed flow physics in such two phase flows are extremely complex and difficult to understand [2]. The flow complexities mainly arise from particle-mean stream interactions, particle-flow turbulence interactions, inter-particle collisions, particle-wall interactions, particle-shock wave interactions, etc. [3].
A considerable deal of work has been made to get an insight into the gas-solid two phase flows and to specify the particle motion and its influence on the gas flow field. It has been comparatively well known that the suspendsion flow is governed by Reynolds number as well as Stokes number [4]. Many other parameters associated with the particle practically affect the two-phase flow characteristics. The flow of a gas-solid mixture can be categorized according to the significance of particle collisions on particle motion [5]. A flow in which particle motion is controlled by inter-particle collision is referred to as a “dense flow”. In this kind of flow, the particleparticle collision cannot be neglected. A flow in which particle motion is controlled by the aerodynamic forces on the particle is a “dilute flow” [6]. The researchers usually ignore the particle-particle collision when they study the dilute flow. In dilute flow, the phase interaction will be the one of the main characteristics. Since there is no fluid pressure appear in the dispersed particle phase, all the characteristics of particle are show by the fluid phase. The dispersed phase phenomena are related to turbulent fluctuations in the gas phase. Until now, the turbulent diffusion phenomena have not yet been satisfactorily explained [7].
Okuda and Choi [8] have done the analytical and experimental study gas-particle mixture flow in various types of convergent-divergent nozzle. They found the velocity of particle was influenced by particle size, particle density, nozzle geometry, and operating conditions, etc. Rumpf [9] used the formulation of particle velocity based on the experiment to predict the velocity of the particle. Kaushal [10] has used a CFD model to study the pipeline flow of fine particles at high concentration. However, very less people studied the micro-sized particle effect on supersonic two phase flow, mainly because of the extreme difficulty in experimentally measuring motion of micron-sized particle and the particle-turbulent interaction. The cost of the experiment also is very high. However, the numerical simulation can offer a convenient way to solve those problems, and it also can give the further details about the suspension internal flow.
The present study is the mainly to investigate the gassolid suspension flow through a convergent-divergent supersonic nozzle. According to the previous analytical work carried out by the authors, the two-phase flow is significantly different from the single-phase gas flow. The flow behavior depends on the particle loading as well as its diameter. Present study will investigate particle loading effect on supersonic suspension flow through a convergent-divergent nozzle. Four kinds of particle loading are used in simulation: 0.01, 0.03, 0.05, and 0.1, respectively. The discrete particle phase (DPM) from FLUNT was employed to calculate the particle motions, and the two way turbulence coupling method was used to monitor the particle-turbulent interactions.
2. Numerical Analysis
Computational Flow Model
For the CFD software, ANSYS Fluent 14.0 was chosen to simulate internal nozzle flows. Ideal gas was used as the primary fluid phase in all cases. A finite volume scheme and density-based solver with coupled scheme were applied in the computational process. Standard k-ω turbulent model, implicit formulations were used considering the accuracy and stability. Second-order upwind scheme was used for turbulent kinetic energy as well as spatial discretization.
The computational domain is shown in Figure 1. The nozzle part is highlighted using a red box. The axialsymmetric CFD model has been used for the present study. In order to get stable solution, the computational domain was extended up to the region of 5D (D is diameter of nozzle exit.) upstream of the nozzle inlet and up to the region of 20D downstream of nozzle exit. The diameter of nozzle throat, inlet, and outlet is 5.8 mm, 22 mm, 20 mm. respectively. The geometry was discretized into structured quadrilateral cells using commercial

Figure 1. Flow geometry and calculation domain.
software GAMBIT. Boundary layer effects were considered by making finer grid clustered towards the walls.
Four different grid systems were simulated using the same boundary conditions. The mesh independence study is shown in Figure 2, which shows the velocity distribution along the axis for four different mesh systems. The simulation with a grid system of 260,000 was chosen for all further studies as it shows lesser deviation in results when compared to it preceding cases with different meshes. For the present simulation, the inlet total pressure is 493,591 pa and back pressure is 101,325 pa, respectively. The inlet total temperature is 300 K.
Currently there are two approaches for the numerical calculation of multiphase flows: the Euler-Lagrange approach and the Euler-Euler approach. The Lagrangian discrete phase model in ANSYS FLUENT follows the Euler-Lagrange approach. The fluid phase is treated as a continuum by solving the N-S equations, while the dispersed phase is solved by tracking a large number of particles through the calculated flow field. The dispersed phase can exchange momentum, mass, and energy with the fluid phase. This approach is made considerably simpler when particle-particle interactions can be neglected, and this requires that the dispersed second phase occupies a low volume fraction, even though high mass loading is acceptable. The particle trajectory is computed individually at specified intervals during the fluid phase calculation.
Particle Force Balance equation is shown below:
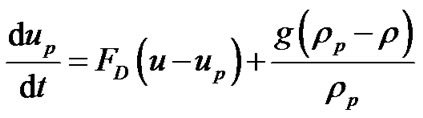 (1)
(1)
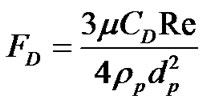
FD is gas drag force which is calculated by:
 (2)
(2)
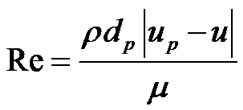
Re is particle Reynolds number which is calculated by:

Figure 2. Grid independence study.
 (3)
(3)
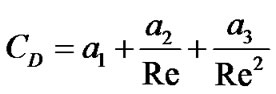
CD is drag coefficient which is fellows spherical drag law:
 (4)
(4)
where: a1, a2, a3 are constants.
The trajectory equations, and any auxiliary equations describing heat or mass transfer to/from the particle, are solved by stepwise integration over discrete time steps. Integration of time in Equation (1) yields the velocity of the particle at each point along the trajectory, with the trajectory itself predicted by
 (5)
(5)
For the particle velocity at the new location  we get
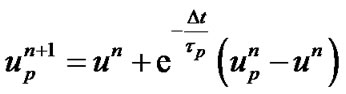 (6)
(6)
The new location  can be computed from a similar relationship:
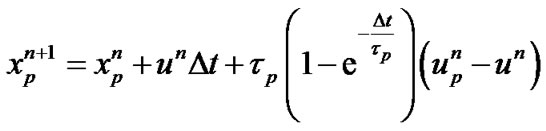 (7)
(7)
At the beginning of the study, in order to test the accuracy of DPM method, 3 cases from Ref. [8] have been chosen to simulate in Fluent. The results were compared with experimental data. The Figure 3 shows the particle mean velocity along the axis. It can be seen that the numerical results are in good agreement with the experimental data.
Table 1 shows the different cases used for the present
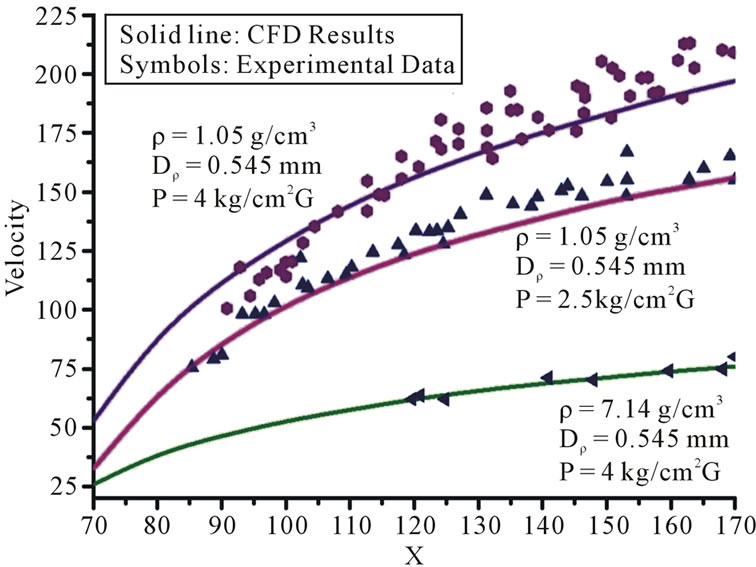
Figure 3. Validation with experimental data (Solid lines are the present CFD results).
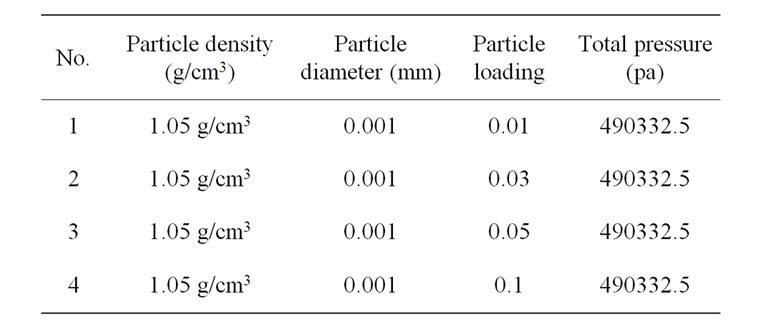
Table 1. Simulation conditions for different particle loading.
study. All the parameters are same except the particle loading.
3. Results and Discussion
Figure 4 shows the particle propagation through the C-D nozzle at different time intervals. At the initial stage the particle flow is uniform and is aligned perpendicular to the axis of the nozzle. When the flow reaches near to the convergent part which shown in Figure 4(d), the particle head trajectory will no longer obeys planar structure, but behaves in a parabolic structure. As the particle flow past the convergent section the particle inertia increases and some particles collides with the wall, but most of particles follow the gas flow trajectories. From the previous study, the flow chocking was observed at the throat section. The flow will change to supersonic speed after it passes the throat section. The shock cell formation in the divergent section leads to flow separation and a shear layer will be formed due to the high velocity gradient exiting between the core flow and the reverse flow in the boundary layer region. The shear layer formation after the oblique shock front causes the concentration of particles near to the shear layer, which can be observed from Figure 4(e). As the flow reaches the end plane of the nozzle, the particles becomes more evenly dispersed in the main gas flow.
Figure 5 shows the computed static pressure distributions along the nozzle wall for the five cases, including only gas phase case. From the figure, it can be seen that for all the five cases, the static pressure along the nozzle wall decreases monotonically with the distance and it continues to decrease up to flow separation point. The flow becomes supersonic downstream of the nozzle throat, and shock trains are formed, which are well documented in many post nozzle flow studies. The shock formation leads to a sudden increase in the static pressure, and the flow decelerates to subsonic speed. The static pressure rise due to the shock wave appears rather gradual. This is associated with the shock wave boundary layer interaction. The pressure distribution for the case with only gas phase shows a smoother variation when compared to two phase suspension flow. Higher the particle loading is, the
 (a)
(a) (b)
(b) (c)
(c) (d)
(d) (e)
(e) (f)
(f)
Figure 4. Particle distributions with time. (a) t = 1.0 × 10⁻⁴ s; (b) t = 2.0 × 10⁻³ s; (c) t = 3.0 × 10⁻³ s; (d) t = 3.2 × 10⁻³ s; (e) t = 3.6 × 10⁻³ s; (f) t = 4.0 × 10⁻³ s.
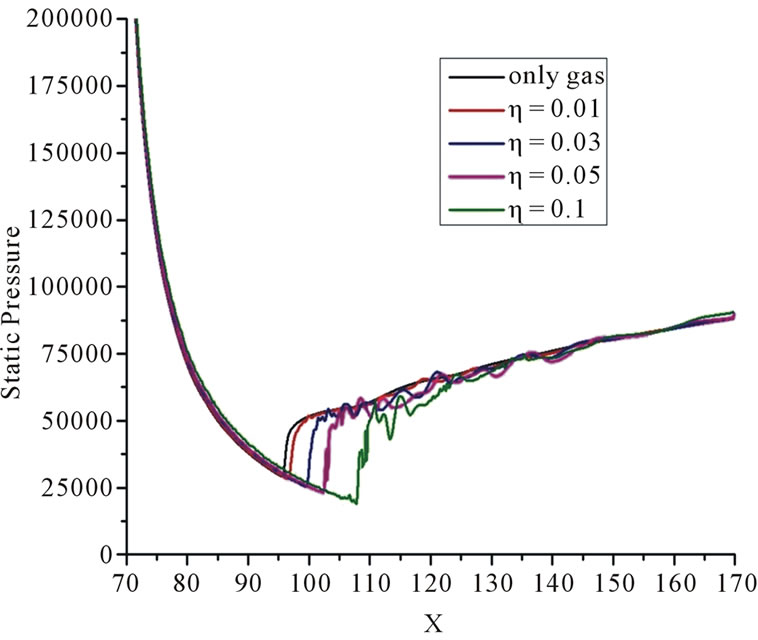
Figure 5. Static pressure variations along the nozzle wall for different particle loading cases at t = 5 × 10⁻³ s.
more the pressure fluctuations. This phenomenon is because as the particle loading increase the particle-turbulence interaction also becomes strong.
Figure 6 shows the static pressure contours of the gas phase in the divergent section at time equals to 0.005 s. The contours show that after the flow pass through the nozzle throat, the static pressure keeps on decreasing. When the shock is strong enough to separate the boundary layer, the shock is bifurcated and more shocks appear downstream of the bifurcated shock. The shock train is always followed by an adverse pressure gradient region. In present study, the particle loading leads to the change in static pressure structure as shown in Figure 6. It can be seen that as the particle loading increase, the numbers and strength of shock decreases.
Figure 7 shows the stream line and Mach number contours of the gas flow. It can be noticed that the separation point moves downstream of the nozzle as the particle loading increase. The location of the separation point is related to many factors, like the nozzle shape, the pressure ratio, etc. In present work, the main reason for the separation point movement is because of the turbulence intensity changes. As the particle loading increases, the more numbers of particles are involved in the flow. So the particle-turbulence interaction will be enlarged. The increase in turbulence strength leads the boundary layer to adhere more to nozzle wall. The movement of the separation point also causes the first shock cell to move
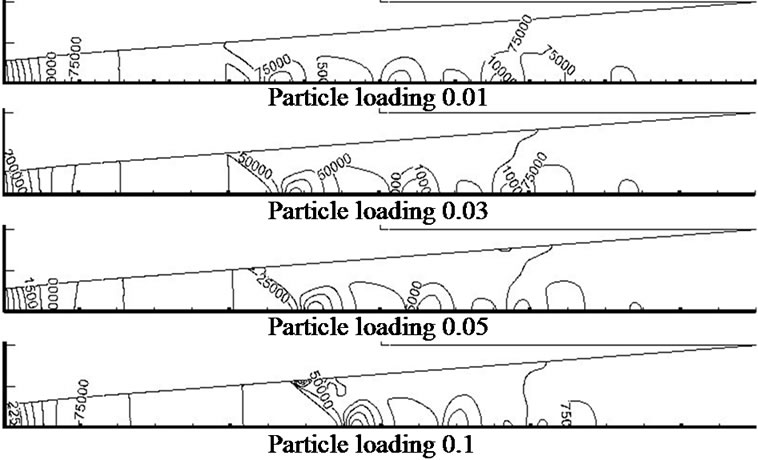
Figure 6. Static pressure contours of the four cases for different particle loading at t = 5 × 10⁻³ s.
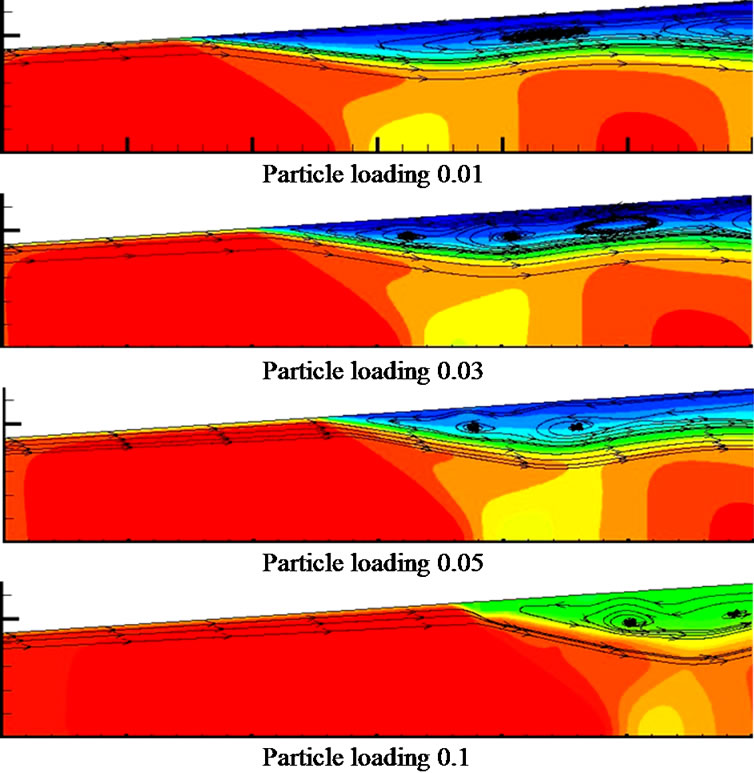
Figure 7. The stream line patterns with particle loading at t = 5 × 10⁻³ s.
downstream and the vortex structure changes. From Figure 7, it can be seen that the vortex location and intensity are different.
The movement in separation point affects the particle distribution also. This can be clearly observed from Figure 8. Most of particles are concentrated at the shear layer. The shear flow layer was created mainly because of the interaction between the high speed and low speed flow regimes.
Figure 9 shows the Mach number distribution along the axis. It can be seen that although the first shock position moves downstream, but the maximum Mach numbers for the all cases are almost constant. As the particle
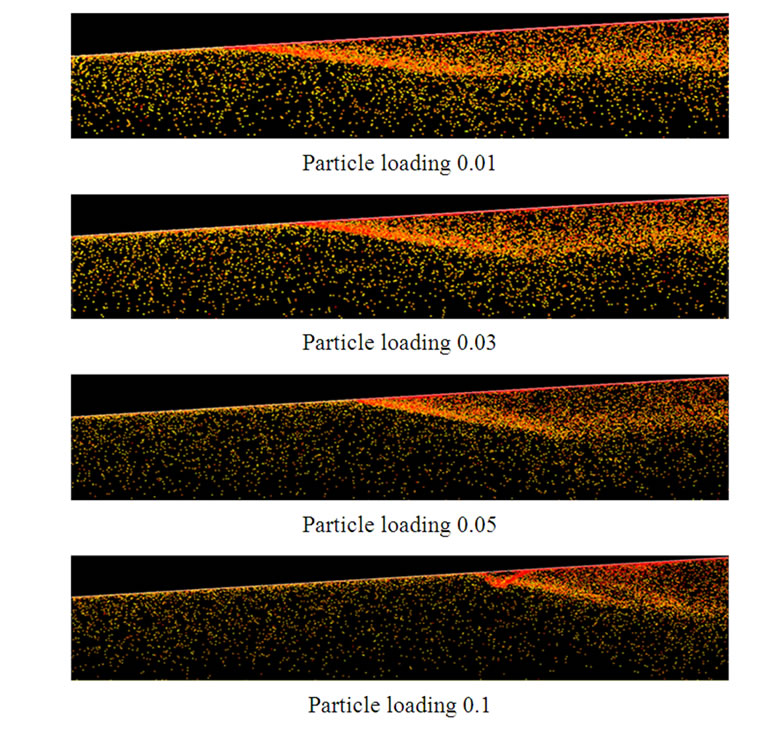
Figure 8. Spatial distributions of particles with different particle loading at t = 5 × 10⁻³ s.
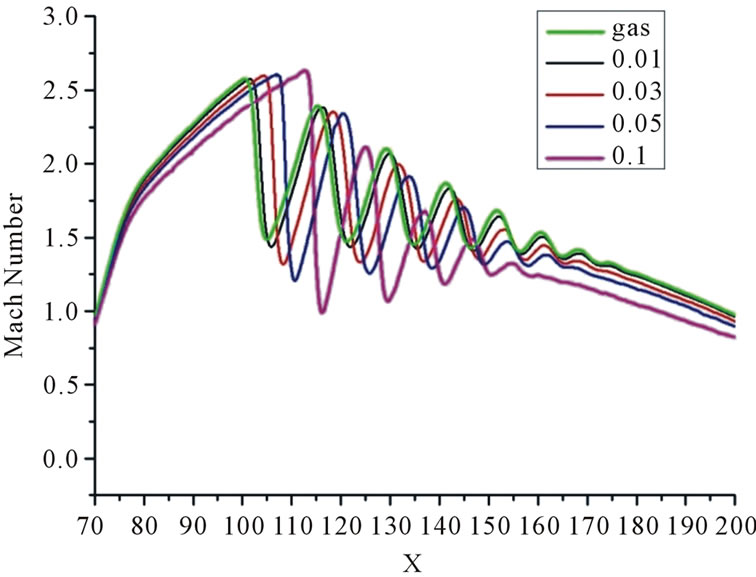
Figure 9. Mach number distributions along nozzle centerline for different particle loading at t = 5 × 10⁻³ s.
loading increases, the Mach number at the exit decreases.
Figure 10 shows the static pressure alone the axis for the five cases (included only gas phase flow). From the figure it is clearly observable that the particle loading significantly influences the gas flow. The strength of the first shock is stronger in suspension flow compared to single phase gas flow. The more the particle loading, the higher will be the first shock cell strength. But for the rest pseudo shocks, the situation is opposite, and it can be visualized from Figure 10 that the case with higher particle loading has less pseudo shocks. The static pressure is almost same at the nozzle outlet.
Figure 11 shows the particle velocity at the nozzle exit. It can be seen that the particle velocity have minor differences even though the particle loading changes.
4. Conclusions
The presence of particles has a big influence on the gas

Figure 10. Static pressure distributions along nozzle centerline for different particle loading at t = 5 × 10⁻³ s.
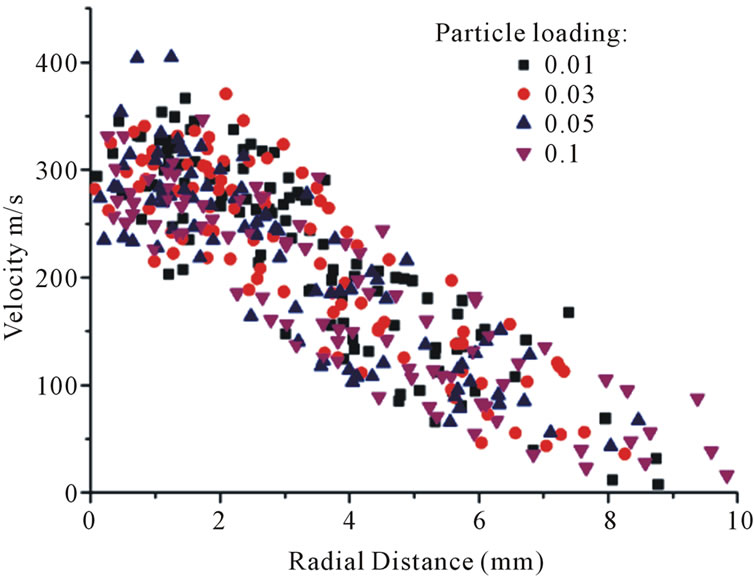
Figure 11. Velocity distributions of particles at the nozzle exit at t = 5 × 10⁻³ s.
phase behavior. Particle loading is an important parameter for the suspension flow. The structure of shock train, the separation point, and the vortex of the backflow are all related to particle loading.
As the particle loading increases:
1) The strength of shock train decreases;
2) The separation point moves toward the nozzle exit;
3) The number and strength of vortex increase;
4) The strength of first shock also increases while the other pseudo shocks decreases;
5) The gas mass flow rate decreases, but total mass flow rate is increases.
The change of gas flow behavior in turn to affects the particle distribution. The particles are concentrated at the shear layers separated from the upper wall surface.
5. Acknowledgements
This work was supported by the National Research Foundation of Korea (NRF) grant funded by the Korea government (MEST) (2011-0017506).
REFERENCES
- J. H. Geng and H. Groenig, “Dust Suspensions Accelerated by Shock Waves,” Experiments in Fluids, Vol. 28, No. 4, 2000, pp. 360-367. doi:10.1007/s003480050395
- L.-S. Fan and C. Zhu, “Principles of Gas-Solid Flows,” Cambridge University Press, Cambridge, 1998.
- C. T. Crowe, D. F. Elger and J. A. Roberson, “Engineering Fluid Mechanics,” Wiley, Hoboken, 2000.
- M. A. F. Kendall, “The Delivery of Particulate Vaccines and Drugs to Human Skin with A Practical Hand-Held Shock Tube-based System,” Shock Waves, Vol. 12, No. 1, 2002, pp. 23-30. doi:10.1007/s001930200126
- M. V. Protasov, A. Yu. Varaksin, T. F. Ivanov and A. F. Polyakov, “Experimental Study of Downward Turbulent Gas-solid Flow in Narrow Pipe,” 4th International symposium on Turbulence, Heat and Mass Transfer, Antalya, 12-17 October 2003, 13 pp.
- Y.-M. Lee and R. A. Berry, “Analysis of the Two-Phase Flow in a De Laval Spray Nozzle and Exit Plume,” Journal of Thermal Spray Technology, Vol. 3, No. 2, 1994, pp. 179-183. doi:10.1007/BF02648275
- M. B. Stakić, G. S. Živković and M. A. Sijerčić, “Numerical Analysis of Discrete Phase Induced Effects on a Gas Flow in a Turbulent Two-Phase Free Jet,” International Journal of Heat and Mass Transfer, Vol. 54, No. 11-12, 2011, pp. 2262-2269. doi:10.1016/j.ijheatmasstransfer.2011.02.039
- S. Okuda and W. S. Choi, “Gas-Particle Mixture Flow in Various Types of Convergent-Divergent Nozzle,” Journal of Chemical Engineering of Japan, Vol. 11, No. 6, 1978, pp. 432-438. doi:10.1252/jcej.11.432
- R. Gr. Maev and V. Leshchynsky, “Introduction to Low Pressure Gas Dynamic Spray,” John Wiley & Sons, Hoboken, 2009.
- D. R. Kaushal, T. Thinglas, Y. Tomita, S. Kuchii and H. Tsukamoto, “CFD Modeling for Pipeline Flow of Fine Particles at High Concentration,” International Journal of Multiphase Flow, Vol. 43, 2012, pp. 85-100. doi:10.1016/j.ijmultiphaseflow.2012.03.005
Nomenclature
 The constants
 Drag coefficient
 Particle diameter (mm)
 Drag force (N)
 Gravity (m/s2)
 Gas velocity (m/s)
 Particle velocity (m/s)
 The particle velocity at new location (m/s)
 The particle velocity at old location (m/s)
 Gas viscosity
 The gas velocity at old location (m/s)
 Density of gas
 Density of particle
 Particle relaxation time
 Time step
 Time
Time
 Distance (m)
 The new location of particle (m)
 The old location of particle (m)
 Particle Reynolds number
NOTES
*Corresponding author.