American Journal of Analytical Chemistry
Vol. 3 No. 12A (2012) , Article ID: 26165 , 8 pages DOI:10.4236/ajac.2012.312A123
Separation of Sesamin and Sesamolin by a Supercritical Fluid-Simulated Moving Bed
1Department of Chemical Engineering, I-Shou University, Kaohsiung, Chinese Taipei
2JOPE Technology Company, Kaohsiung, Chinese Taipei
3Jojia Bio-Tech Company, Kaohsiung, Chinese Taipei
Email: mtliang@isu.edu.tw
Received October 15, 2012; revised November 15, 2012; accepted November 27, 2012
Keywords: Supercritical Fluid Simulated-Moving Bed; Sesamin; Sesamolin; Supercritical Fluid Extraction; Supercritical Fluid Fractionation
ABSTRACT
This work shows how the sesamin and sesamolin in sesame seed can be extracted, enriched and purified by the related technologies of supercritical carbon dioxide. Sesame oil is first obtained from the sesame seeds by supercritical carbon dioxide extraction (SFE); lignans in the oil are enriched and precipitated as the top product by supercritical fluid fractionation technology (SFF); the crude lignans are then separated by supercritical fluid-simulated moving bed chromatography (SF-SMB) to obtain pure sesamin and sesamolin. The simulated moving bed is a continuous chromatography; the use of supercritical carbon dioxide as the desorbent simplifies the downstream treatment. By experimental validation, this work also shows that replacing liquid by SF as the desorbent for the SMB automatically creates a gradient operation for the SMB and enlarges the separable range of the operating conditions. Both the design and operation of the SF-SMB are introduced in this paper. The application of SF-SMB to the separation of sesamin and sesamolin provides a novel example for demonstrating the diversity of SF and the potential applications for the production of natural products and the development of botanical drugs.
1. Introduction
Sesamin and sesamolin are the major lignans found in sesame seed, weighted at about 0.5% - 1.0% of the seed. The lignans are normally dissolved in the sesame oil and are considered functional compounds for anticancer treatment [1], protecting the liver from damage caused by chemicals [2,3], anti-inflammation [4] and antihypertension [5]. Because of their similarity in chemical structure, as illustrated in Figure 1, the separation of sesamin and sesamolin can usually be achieved by chromatography. The authors successfully used methanol as the desorbent to separate the sesamin and sesamolin by a simulated moving bed (SMB) [6]. In this work, a much safer desorbent for human consumption, supercritical carbon dioxide with ethyl acetate, was applied for the simulated moving bed (SF-SMB) to separate the mixture of sesamin and sesamolin.
It has been reported that sesamin epimerizes as episesamin at an elevated temperature and that the bioactivity of episesamin is much lower than that of sesamin [7]. To preserve the bioactivity, the best process for sesamin production is to start at a low temperature for the extraction from the sesame seeds. In this work, the feedstock for the SF-SMB was prepared by supercritical fluid extraction (SFE) to extract the lignans from the seeds, followed by supercritical fluid fractionation (SFF) to obtain the solid mixture of sesamin and sesamolin. Because the processing of the natural product from SFE and SFF to the SFF-SMB is absolutely conducted at low temperature, it was presumed that bioactivity could be totally preserved. In this work the design of the SF-SMB has been illustrated and the separable conditions for operating the SF-SMB have been explored using triangle theory. Fundamentals of SMB and the triangle theory were explicitly reviewed in literatures and published books [8-10] Also, the effects of the operation conditions on SFE and the operating conditions for SFF have been detailed.
In the last decade, several crude extracts from natural products have been successfully concentrated or purified by SMB chromatography [6,11,12]. In addition to the classical SMB eluted by liquid desorbent, Clavier et al. first applied supercritical carbon dioxide as the desorbent to SMB for the separation of GAL (g-linolenic ethyl ester) and DHA (docosahexaenoic ethyl ester), and called it SF-SMB [13]. Later, researchers from TUHH (Hamburg University of Technology, Germany) and ETH (Swiss Federal Institute of Technology, Zurich, Switzerland) applied SF-SMB to the separation of steroisomers, enantiomers and fatty acid ethyl esters [14-19]. The advantages of using supercritical fluid as the desorbent include: the instant evaporation of carbon dioxide to obtain concentrated products, the adjustment of solvent power by pressure and the gradient operation of SMB by setting different pressures in different sections of the SMB. However, pure carbon dioxide is seldom solely used as the eluent because of the injection of the feedstocks by HPLC pump and the requirement of cosolvents to create higher solubility and selectivity for the SF-SMB [14-19].
To date, SF-SMB experiments as reported in the literature have been conducted in pilot plants with 3.0 cm or larger columns. In this work, the authors carefully and accurately controlled the flow rate of carbon dioxide so that a small column with a 1.0 cm diameter could also be applied. In this study, silica gel was used as the adsorbent and ethyl acetate was used as the cosolvent for the supercritical carbon dioxide. A three-section SMB configured as 2/2/2/0 with an open-loop design was employed to conduct the SF-SMB experiments.
2. Supercritical Fluid-Simulated Moving Bed
In a four-section SMB, the fourth section is designed to regenerate the desorbent for recycling. Since carbon dioxide can be easily and instantly recycled by vaporization, the fourth section can be eliminated to enhance the SMB efficiency. Therefore, a three-section SMB was designed for the SF-SMB in this study. The three-section SF-SMB had two inputs: the streams of feed and desorbent, and two outputs: the extract and raffinate. To apply supercritical carbon dioxide as the desorbent, a more complicated piping design was required for all input and output streams. Figure 2 illustrates the piping design of the inlet and outlet streams. In Figure 2, the SMB unit is represented by a large circle marked SMB for simplicity. The two inputs from the left of the SMB unit represent the streams of desorbent and feed, and the two outputs to the right represent the streams of extract and raffinate.
As illustrated in Figure 2, high-pressure carbon dioxide is created by a diaphragm pump and stored in a buffer tank which provides a stable resource of high-pressure
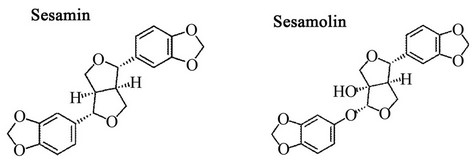
Figure 1. Chemical structure of sesamin and sesamolin.
carbon dioxide for the SF-SMB. Once the buffer tank is full, a needle valve is opened to supply carbon dioxide for the SMB unit, and its pressure is regulated by a pressure reducing valve (PRV). The carbon dioxide with regulated pressure is split into two streams. The first stream is mixed with the cosolvent and fed into the SMB as the desorbent, and the second stream is mixed with the feed solution and fed into the SMB as the feed. When a much lower flow rate of carbon dioxide is required, an additional pressure-reducing valve for the feed stream is sometimes needed to reduce the pressure difference between the upstream and downstream of the flow rate controller. The carbon dioxide flow rate for the feed stream is controlled by a mass flow rate controller, yet only the mass flow rate of carbon dioxide is recorded for the desorbent stream. The flow rates of the cosolvent and the liquid feed solution are independently controlled by two HPLC pumps. After being discharged from the SMB unit, both extract and raffinate are depressurized to vaporize the carbon dioxide and precipitate liquid cosolvents in the separators. The vaporized carbon dioxide is primarily cooled by chilling water to dry the carbon dioxide gas, and its flow rate is controlled through another mass flow rate controller installed before venting to the atmosphere.
In this SF-SMB, three mass flow rate controllers and one mass flow rate meter were installed to control and record the flow rates of carbon dioxide for each stream. Two Coriolis flow meters were used to measure the mass flow rate of the high-pressure carbon dioxide, for the streams of feed and desorbent, and two capillary flow meters were used to control the flow rates of gaseous carbon dioxide from the extract and raffinate. All flow meters were primarily calibrated by a wet gas flow meter at their operating condition.
The start-up procedure of the SF-SMB was designed as follows:
• Start the CO2 diaphragm pump and pressurize the buffer tank;
• Set the operating pressure of the SMB and the separators through pressure reducing valves;
• Set the temperature of the oven on which the SMB sits;
• Set the carbon dioxide flow rate for the raffinate;
• Set the carbon dioxide flow rate for the extract and the feed stream simultaneously;
• Wait for the pressure and flow rates of the four streams to reach steady state;
• Start the cosolvent pump and wait for steady state;
• Evacuate the separators and start the HPLC pump for the feed solution;
• Use sampling tanks to take samples from the separators.
If the concentrations of cosolvent for the feed and desorbent are equal, the operation is in isocratic mode. In order to create the gradient of the elution power of the supercritical fluid along the six columns in the SMB, the design of the flow rates of the cosolvent and the feed solution is crucial. Single column chromatography is used to determine the effect of the cosolvent concentration on the retention of the solutes. If the retention time is reduced by increasing the concentration of cosolvent in supercritical fluid chromatography (SFC), the ratio of the cosolvent flow rate to the carbon dioxide flow rate for the desorbent stream must be higher than that of the feed stream, as illustrated in Figure 3. If the retention time increases after increasing the cosolvent concentration, the arrangement of the ratio of the flow rate is reversed.
The concentration of the cosolvent of the extract and the raffinate were evaluated by mass conservation of the cosolvent. As illustrated in Figure 3, the cosolvent concentration of the extract should be equal to the desorbent, and the mass conservation of the cosolvent can then be used to evaluate the cosolvent concentration for the raffinate. Because the content of solutes in the fluid phase is usually low, it can be neglected when calculating the cosolvent concentration of the raffinate and extract by mass conservation.
Triangle theory is the most commonly used theory in setting the operating conditions for SMB. A right triangle on the (m2, m3) plane is usually drawn to define the SMB setting, and the coordinates of the plane are the relative volumetric flow rate of the liquid desorbent to that of the solid phase in Sections 2 and 3 of the SMB, respectively. Using the mass flow rate to replace the volumetric flow rate when applying triangle theory to the SF-SMB has been proposed [17,19]. Although the expression by mass flow rate is much clearer and easier to understand, an estimate of the density of the supercritical fluid must still be calculated. In this study, traditional triangle theory was used to determine the operating conditions and explain the experimental results. In order to calculate the volumetric flow rate, the density of the supercritical fluid was calculated by Peng-Robinson EOS (equation of state) without considering the contribution from the solutes.
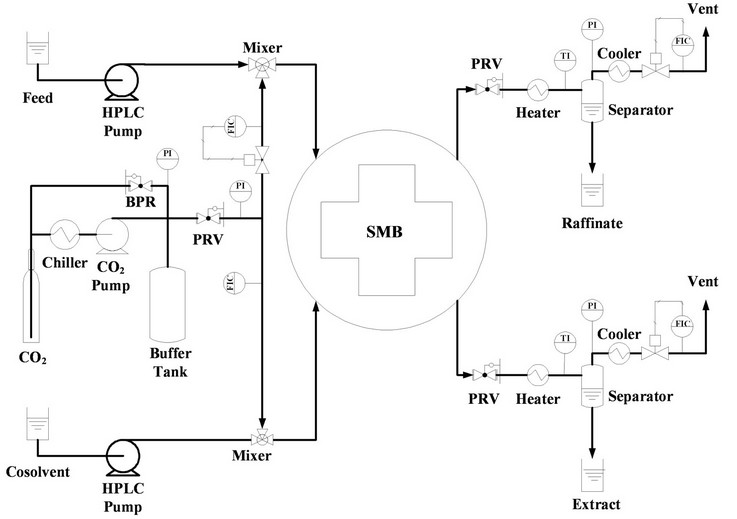
Figure 2. Illustration of the SF-SMB system.
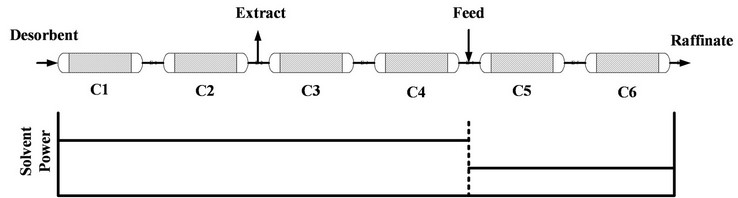
Figure 3. Three-section SMB with gradient of elution power.
The mixing rule and interaction parameters between carbon dioxide and ethyl acetate have been directly cited from the literature [20].
3. Materials from SFE and SFFP
3.1. Supercritical Fluid Extraction
Figure 4 schematically illustrates the SC-CO2 extraction plant, which was built by NATEX with 12 L of extractant. The maximum pressure and temperature were 100 MPa and 120˚C. Ground sesame seeds were initially loaded into the extractor. Pre-cooled CO2 was pressurized by the diaphragm pump and heated to the designed pressure and temperature. The sesame seed oil was then extracted by carbon dioxide under the setup conditions. After passing through the extractor, the carbon dioxide flowed into the first and second separators. In this study, both were set at the same temperature and pressure so that the oil was mainly collected in the first separator. The sesame oil was periodically collected from the separator and weighed to calculate the recovery.
Figure 4 schematically illustrates the SC-CO2 extraction plant, which was built by NATEX with 12 L of extractant. The maximum pressure and temperature were 100 MPa and 120˚C. Ground sesame seeds were initially loaded into the extractor. Pre-cooled CO2 was pressurized by the diaphragm pump and heated to the designed pressure and temperature. The sesame seed oil was then extracted by carbon dioxide under the setup conditions. After passing through the extractor, the carbon dioxide flowed into the first and second separators. In this study, both were set at the same temperature and pressure so that the oil was mainly collected in the first separator. The sesame oil was periodically collected from the separator and weighed to calculate the recovery.
The effects of the extraction pressure and temperature on the oil recovery are illustrated in Figures 5 and 6. Other factors, including the size of the ground seeds, flow rate of carbon dioxide and load amount of the

Figure 4. Schematic illustration of the supercritical carbon dioxide extraction.
ground seed, had a minor effect on the oil recovery. GC, GC/MS and HPLC analysis revealed the existence of sesamin and sesamolin in the oil. The concentration of sesamin in the oil was about 3000 - 5000 ppm, depending on the extraction condition and the seeds.
In Figures 5 and 6, the abscissa is the weight ratio of the accumulated weight of carbon dioxide to that of the loaded sample, and the coordinate is the yield of sesame oil. As shown in Figure 5, the yield of sesame oil increased with pressure. The maximum yield was about 45%, after q was about 28. Increasing the pressure to 45 MPa slightly decreased the maximum yield, likely the result of channeling inside the extractor at high pressure. Figure 6 shows that steadily increasing the temperature increased the yield at 45 MPa. It was presumed that the solubility of the oil in carbon dioxide was mainly dominated by the vapor pressure of the oil rather than by the density of carbon dioxide at 45 MPa. It was also observed that the concentration of lignans in the oil was about the same for extraction at different temperatures and pressures.
3.2. Supercritical Fluid Fractionation
Sesame oil extracted by supercritical carbon dioxide was
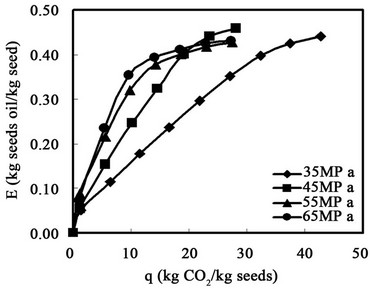
Figure 5. Effect of extraction pressure on the oil recovery at 55˚C.
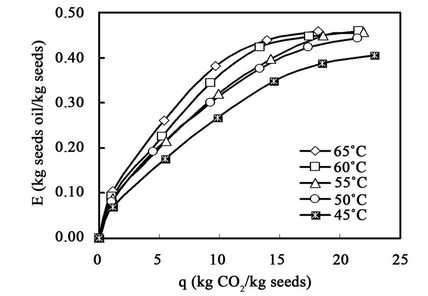
Figure 6. Effect of extraction temperature on oil recovery at 45 MPa.
further enriched and precipitated by supercritical fluid fractionation technology. The experimental setup is illustrated in Figure 7. After the system was pressurized and the temperature profile of the column reached steady state at a constant flow rate of carbon dioxide, sesame oil was fed into the fractionation column. The fractionation column was made of SS 316 and 25.4 mm in diameter and 2.4 m in length. Inside the column, 4 mm glass beads were packed and 12 redistributed plates were installed inside the column at equal intervals. The feed was located in the center of the column. To control the temperature, four thermocouples and 12 electrical annular heaters were installed between the top half of the column, the fractionation section, and the bottom half of the column, the stripping section. Effluent from both the distillate and raffinate were periodically collected and weighed. In this work, the reflux pump remained shut off. After several trials, it was found that solid lignans suspended in the oil could be obtained in distillate for operating at 15.7 - 18.2 MPa, 21˚C - 32˚C, 15.8 - 18.1 NL-CO2/min and fed at 1.62 - 2.70 g-oil/min. The distillate oil from the top of the fractionation column was filtered and washed by ethanol several times to obtain the crude lignans of sesamin and sesamolin, which were then dissolved in ethyl acetate for further separation by SF-SMB. HPLC and GC/MS analysis showed that the crude lignans were mainly the sesamin and sesamolin.
3.3. HPLC Analysis and Adsorption Isotherm by SFC
The crude lignans were submitted to HPLC and SFC. The spectrums of the mixture of sesamin and sesamolin from HPLC and SFC are illustrated in Figure 8. For the HPLC analysis, a Sycronis C18, 150 × 4.6 mm, and 5 μm from Thermo were used and the mobile phase was 70/30 of methanol/water. HPLC was used for the analysis of all experimental results from the SF-SMB. To conduct the separation by SF-SMB, a single column study by SFC was primarily conducted. Merck silica gel 60, 40 - 63 μm, was packed into a 150 × 10 mm column by the dry method. Of the cosolvents: isopropanol, methanol, ethanol and ethyl acetate, it was found that ethyl acetate was the only one that could separate the sesamin and sesamolin. After determining the cosolvent, the temperature, pressure and flow rate effect on the separation were examined. The spectrum illustrated in Figure 8 shows the operation conditions set as 13.8 MPa, 35˚C and the flow rate of carbon dioxide and ethyl acetate as 5.075 g/min and 1.886 mL/min, respectively. As shown in Figure 8, the retention behavior of the sesamin and sesamolin was reversed for HPLC and SFC; the ratio of sesamin and sesamolin was about 88.5/11.5, calculated by the area ratio of the HPLC spectrum. The porosity of the silica-packed column was 0.7448. Applying triangle theory for setting the operating conditions of the SF-SMB, the Henry’s constants were 9.00 and 15.70 for sesamin and sesamolin, respectively. If the operating pressure was reduced to 11.4 MPa, the Henry’s constants became 11.3 and 19.2. The decrease in pressure did not change the selectivity, but shifted the right triangle up to the right as defined by triangle theory in the phase plane of (m2, m3).
4. Separation of Sesamin and Sesamolin by SF-SMB
4.1. SF-SMB Setting
An additional six columns were packed for the SMB and installed according to the column porosity in the order of
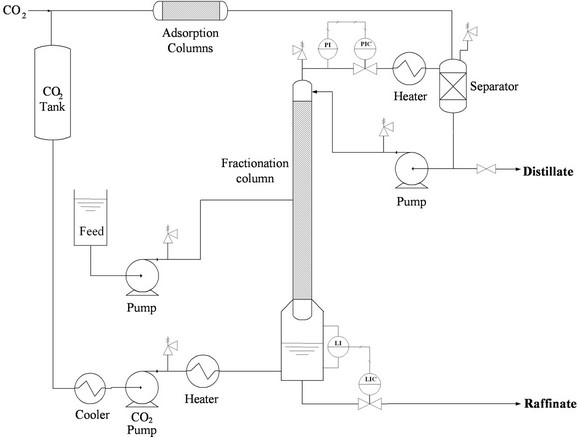
Figure 7. Process flow diagram of supercritical CO2 fractionation.
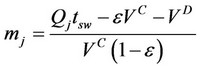
0.653, 0.771, 0.748, 0.770, 0.763 and 0.765. Triangle theory, without considering the dead volume of the SF-SMB, was preliminarily applied to set the operating conditions and define the triangle. The experimental results from the series of experiments were then used to identify the separable operating conditions. Comparing the separable operating conditions with that from triangle theory on the phase plane of (m2, m3), a dead volume of the SF-SMB was proposed to match both results. The dead volume of the SF-SMB was then estimated as 5.5 mL, and the related volume flow rates in each section were defined as [8]:
 . (1)
. (1)
where VD is the estimated dead volume of the SF-SMB; VC is the empty column volume, 7.854 mL; ε is the average porosity of six columns, 0.7448; tsw is the switching time of the valve; and Qj is the volumetric flow rate of supercritical fluid in section j. The volumetric flow rate in each section was estimated by the Peng-Robinson equation of state, without considering the contribution from the sesamin and sesamolin because the mole fraction of lignans in the supercritical fluid was relatively low.
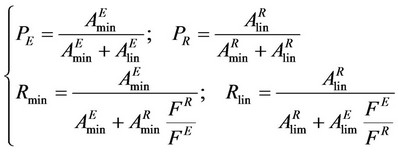
To examine the performance of the SF-SMB, purities and recoveries were calculated based on the area of the HPLC/UV spectrums at 280 nm. Purity and recovery are defined as:
 (2)
(2)
where FE and FR are the cosolvent flow rates of the extract and raffinate and calculated by the mass conservation; P and R are the purity and recovery; A is the area from the UV spectrums; and the subscript of min and lin represents sesamin and sesamolin, respectively.
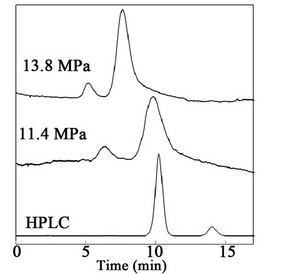
Figure 8. HPLC and SFC spectrums.
4.2. Experimental Results
Two sets of experiments were conducted in this work. Each set was designed at constant liquid flow rates with various switching times of the valve. Table 1 lists the fluid flow rates for each set. The content of ethyl acetate in supercritical carbon dioxide for both sets was designed as 25 wt%. Therefore, there was no concentration gradient along the six columns. According to the flow rate design, the experiments for each set were marked as different symbols on the phase plane of (m2, m3), as illustrated in Figure 9. The squares and circles represent the first set and the second set, respectively. If pure extract and raffinate were obtained, the squares and circles were replaced by solid symbols.
The experimental results from all experiments are listed in Tables 2 and 3. Several experiments yielded pure extract and raffinate, as represented by solid symbols in Figure 9. The purity and recovery of the experimental results were calculated according to Equation (2), as determined from the HPLC spectrum illustrated in Figure 10. Figure 10 shows the HPLC spectrums of the extract and raffinate for the first series of experiments, and that the experiments with a switching time ranging from 5.5 to 6.5 min could obtain pure extract and raffinate. The m2 and m3 in Tables 2 and 3 were calculated by Equation (1). Although this work had already considered the dead volume for the determination of m2 and m3, the separable region on the (m2, m3) plane, as determined

Table 1. Operating conditions for SMB experiments.
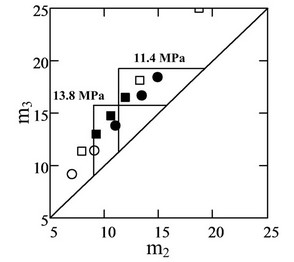
Figure 9. Triangle theory and operating conditions on the (m2, m3) plane.
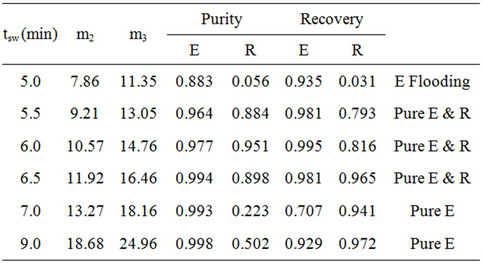
Table 2. Experimental results for operating condition (1).
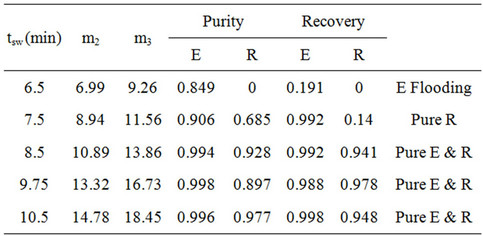
Table 3. Experimental results for operating condition (2).

Figure 10. HPLC spectrums of extracts and raffinates from the first series of experiments. HPLC analysis was performed using LC-2010C Shimadzu Japan system equipped with a CAPCELL PAK C18 column. Ten ml of the sample solution was injected and analyzed at 40ºC at a flow rate of 1.0 ml min-1 with acetonitrile water (50/50).
by the experiments, was obviously larger than that predicted by triangle theory. It was presumed that the pressure drop along the six columns might create a pressure gradient and significantly extend the triangle up to the right. During the SF-SMB experiment, it was observed that the pressure difference between the two HPLC pumps was about 2.4 MPa, which was the pressure drop for the first four columns as illustrated in Figure 3. Accordingly, the pressure drop for each column was estimated as about 0.6 MPa. Figure 8 also shows the decrease of elution power by decreasing the pressure, and Figure 9 indicates both triangles for operating at 13.8 and 11.4 MPa on the (m2, m3) plane. A pressure gradient was automatically created along the six columns of the SF-SMB, and it was concluded that although the cosolvent concentration was fixed, the gradient of elution power could also be created due to the inevitable pressure drop if the elution power changed as a result of the pressure. Because the elution power of supercritical fluid normally decreases with pressure, the SF-SMB could automatically create a gradient operation and provide additional advantages for replacing liquid desorbent by supercritical fluid.
5. Conclusion
In this work, supercritical fluid-related technologies were solely used to extract, concentrate and purify sesamin and sesamolin from sesame seeds. With the supercritical carbon dioxide at a relatively low temperature, it was presumed that bioactivity could be totally preserved. This work demonstrated that SF-SMB automatically created a gradient operation and enhanced efficiency. It also provided a cleaner alternative for separating mixtures or purifying bioactive compounds from natural crude extract. For supercritical fluid, SF-SMB was key to the development of a molecular drug from a natural source.
6. Acknowledgements
Financial support from the National Science Committee of Chinese Taipei and INER is gratefully acknowledged.
REFERENCES
- N. Hirose, F. Doi, T. Ueki, K. Akazawa, K. Chijiiwa, M. Sugano, K. Akimoto, S. Shimizu and H. Yamada, “Suppressive Effect of Sesamin against 7,12-Dimethylbenz[a]- Anthracene Induced Rat Mammary Carcinogenesis,” Anticancer Research, Vol. 12, No. 4, 1992, pp. 1259-1265.
- K. Akimoto, Y. Kitagawa, T. Akamatsu, N. Hirose, M. Sugano, S. Shimizu and H. Yamada, “Protective Effects of Sesamin against Liver Damage Caused by Alcohol or Carbon Tetrachloride in Rodents,” Annals of Nutrition and Metabolism, Vol. 37, No. 4, 1993, pp. 218-224. doi:10.1159/000177771
- Y. U. Yu, S. Y. Kang, H. Y. Park, S. H. Sung, E. J. Lee, S. Y. Kim and Y. C. Kim, “Antioxidant Lignans from Machilus thunbergii Protect CCI4-Injured Primary Cultures of Rat Hepatocytes,” Journal of Pharmacy and Pharmacology, Vol. 52, No. 9, 2000, pp. 1163-1169. doi:10.1211/0022357001774949
- S. R. Chavali and R. A. Forse, “Decreased Production of Interleukin-6 and Prostaglandin E2 associated with Inhibition of Xelta-5 Xesaturation of Omega6 Catty acids in Mice Fed Safflower Oil Diets Supplemented with Sesamol,” Prostaglandins Leukot Essent Fatty Acids, Vol. 61, No. 6, 1999, pp. 347-352. doi:10.1054/plef.1999.0112
- D. Nakano, M. Takaoka, Y. Kiso and Y. Matsumura, “Antihypertensive Effect of Sesamin,” Vascular Disease Prevention, Vol. 1, No. 3, 2004, pp. 233-241. doi:10.2174/1567270043404836
- M. T. Liang, R. C. Liang, L. Y. Wang, H. E. Yen and K. T. Lee, “Effect of Temperature Variation on the Separation of Sesamin and Sesamolin by Simulated Moving Bed,” Journal of Chemistry and Chemical Engineering, Vol. 5, 2011, pp. 479-786.
- M. Nakai, N. Kageyama, K. Nakahara and W. Miki, “Decomposition Reaction of Sesamin in Supercritical Water,” Bioscience, Biotechnology, and Biochemistry, Vol. 70, No. 5, 2006, pp. 1273-1276. doi:10.1271/bbb.70.1273
- A. Rajendran, G. Paredes and M. Mazzotti, “Simulated Moving Bed Chromatography for the Separation of Enantiomers,” Journal of Chromatography A, Vol. 1216, No. 4, 2009, pp. 709-738. doi:10.1016/j.chroma.2008.10.075
- H. Schmidt-Traub, “Preparative Chromatography of Fine Chemicals and Pharmaceutical Agents,” Wiley-VCH Verlag GmbH & Co., Weinheim, 2005. doi:10.1002/3527603484
- G. Subramanian, “Chiral Separation Techniques—A Practical Approach,” 2nd Edition, Wiley-VCH, Verlag GmbH & Co., Weinheim, 2001.
- J. Cong and B. Lin, “Separation of Liquiritin by Simulated Moving Bed Chromatography,” Journal of Chromatography A, Vol. 1145, No. 1-2, 2007, pp. 190-194. doi:10.1016/j.chroma.2007.01.088
- F. Wei and Y. Zhao, “Separation of Capsaicin from Capsaicinoids by Simulated Moving Bed Chromatography,” Journal of Chromatography A, Vol. 1187, No. 1-2, 2008, pp. 281-284. doi:10.1016/j.chroma.2007.12.081
- J. Y. Clavier, R. M. Nicoud and M. Perrut, “High Pressure Chemical Engineering,” In: Ph. R. von Rohr and Ch. Trepp, Eds., A New Efficient Fractionation Process: The Simulated Moving Bed with Supercritical Eluent, Elsevier Science, London, 1996, pp. 429-434.
- A. Depta, T. Giese, M. Johannse and G. Brunner, “Separation of Stereoisomers in a Simulated Moving Bed-Supercritical Fluid Chromatography Plant,” Journal of Chromatography A, Vol. 865, No. 1, 1999, pp. 175-186. doi:10.1016/S0021-9673(99)00833-X
- F. Denet, W. Hauck, R. G. Nicoud, O. D. Giovanni, M. Mazzotti, J. N. Jaubert and M. Morbidelli, “Enantioseparation through Supercritical Fluid Simulated Moving Bed (SF-SMB) Chromatography,” Industrial & Engineering Chemistry Research, Vol. 40, No. 21, 2001, pp. 4603- 4609. doi:10.1021/ie000959v
- S. Peper, M. Lubbert, M. Johannsen and G. Brunner, “Separation of Ibuprofen Enantiomers by Supercritical Fluid Simulated Moving Bed Chromatography,” Separation Science and Technology, Vol. 37, No. 11, 2002, pp. 2545-2566. doi:10.1081/SS-120004452
- A. Rajendran, S. Peper, M. Johannsen, M. Mazzotti, M. Morbidelli and G. Brunner, “Enantioseparation of 1-Phenyl-1propanol by Supercritical Fluid-Simulated Moving Bed Chromatography,” Journal of Chromatography A, Vol. 1092, No. 1, 2005, pp. 55-64. doi:10.1016/j.chroma.2005.02.040
- S. Peper, M. Johannsen and G. Brunner, “Preparative Chromatography with Supercritical Fluids Comparison of Simulated Moving Bed and Batch Process,” Journal of Chromatography A, Vol. 1176, No. 1-2, 2007, pp. 246- 253. doi:10.1016/j.chroma.2007.09.090
- C. A. M. Cristancho, S. Peper and M. Johannsen, “Supercritical Fluid Simulated Moving Bed Chromatography for the Separation of Ethyl Linoleate and Ethyl Oleate,” The Journal of Supercritical Fluids, Vol. 66, 2012, pp. 129-136. doi:10.1016/j.supflu.2012.02.015
- M. V. da Silva, D. Barbosa, P. O. Ferreira and J. Mendonca, “High Pressure Phase Equilibrium Data for the Systems Carbon Dioxide/Ethyl Acetate and Carbon Dioxide/Isoamyl Acetate at 295.2, 303.2 and 313.2 K,” Fluid Phase Equilibria, Vol. 175, No. 1, 2000, pp. 19-33. doi:10.1016/S0378-3812(00)00439-8