American Journal of Analytical Chemistry
Vol. 3 No. 2 (2012) , Article ID: 17291 , 8 pages DOI:10.4236/ajac.2012.32022
Development and Validation of Stability Indicating LC Method for Olmesartan Medoxomil
1Centre for Chemical Sciences, Institute of Science and Technology, Jawaharlal Nehru Technological University, Hyderabad, India
2Analytical Development Laboratory, Inogent Laboratories Private Limited, Hyderabad, India
Email: *Kameswararao_scientist@yahoo.co.in
Received December 5, 2011; revised January 8, 2012; accepted January 16, 2012
Keywords: Olmesartan; Validation; Degradation Products and Related Substances
ABSTRACT
The present method provides the detailed description of development and validation of a simple stability indicating reverse phase column liquid chromatographic method for Olmesartan in the presence of its impurities namely Imp-A, Imp-B, Imp-C, Imp-D, Imp-E, Imp-F and Imp-G and degradation products generated from forced degradation studies. The drug substance was subjected to stress conditions of aqueous hydrolysis, Oxidative, photolytic and thermal stress degradation. The degradation of Olmesartan was observed under acid hydrolysis, base hydrolysis and peroxide. The drug was found to be stable to other stress conditions attempted. Successful separation of the drug from synthetic impurities and degradation products formed under stress conditions was achieved on symmetry C18, 150 mm × 4.6 mm, 5 μ column using a phosphate buffer, Acetonitrile and Milli Q water. The developed LC method was validated with respect to specificity, linearity, accuracy, precision, raggedness and robustness. The assay method was found to be linear in the range of 250 μg·mL–1 to with 1000 μg·mL–1 correlation coefficient of 0.9999 and the linearity of the impurities was established from LOQ to 0.4%. Recoveries of assay and impurities were found between 98.5% and 101.2%. The developed LC method to determine the related substances and assay determinations of Olmesartan can be used to evaluate the quality of regular production samples and stability samples. To best of our knowledge, the validated stability indicating LC method which separates all the impurities disclosed in this investigation was not published elsewhere.
1. Introduction
Olmesartan (5-methyl-2-oxo-2H-1,3-dioxol-4-yl)methyl4 -(2-hydroxypropan-2-yl)-2-propyl-1-({4-[2-(2H-1,2,3,4-tetrazol-5-yl)phenyl]phenyl}methyl)-1H-imidazole-5-carboxylate (Figure 1) is a potent and selective angiotensin AT1 receptor blocker [1] which has been approved for the treatment of hypertension in the united states, Japan and European countries. The drug contains a medoxomil ester moiety and is cleaved rapidly by an endogenous esterase to release the active metabolite Olmesartan [2]. Due to the fact that hydrolysis of Olmesartan in human plasma is extremely rapid [3]. The drug works by inhibiting the effects of angiotensin II, a potent vasoconstrictor and one of the key contributors to cardiovascular and renal disease [4]. The presence of impurities also called as related substances in an active pharmaceutical (API) can have a significant impact on the quality and safety of the drug products. Therefore it is necessary to study the impurity profile of any API and controlled it during the manufacturing of the drug product. As per the ICH guidelines any impurities, which are forming at a level of ≥0.10% with respect to API should be identified, synthesized and characterized thoroughly [5]. Few HPLC methods were reported in the literature for the analysis of Olmesartan in Pharmaceutical formulation [6]. RP-HPLCDAD method for determination of Olmesartan medoxomil in bulk drug and tablets exposed to forced conditions [11], Stability-indicating RP-HPLC method for simultaneous determination of Olmesartan Medoxamil and Pioglitazone in fixed dose combination tablet dosage form [12]. No HPLC methods were reported in major pharmacopies USP, EP, JP and BP. Extensive literature survey reveals there is no stability indicating HPLC method for determination of related substances and for quantitative estimation of Olmesartan in bulk drubs. An ideal stability indicating chromatographic method should estimate the drug to be able to resolve from its potential impurities and degradation products. The present drug stability test guidelines Q1A(R2) issued by international conference on Harmonization (ICH) suggested that stress study should be carried on a drug to
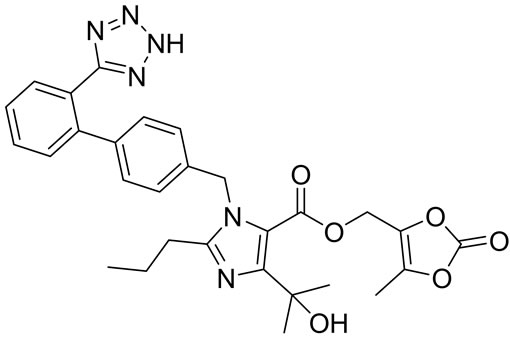
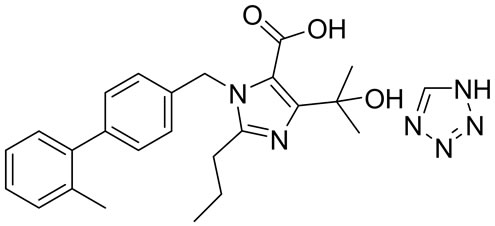
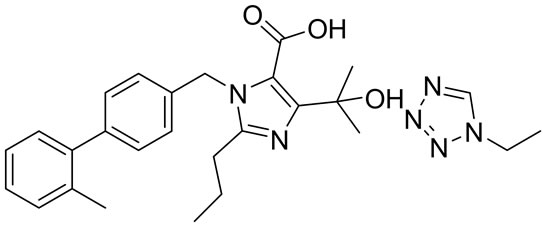
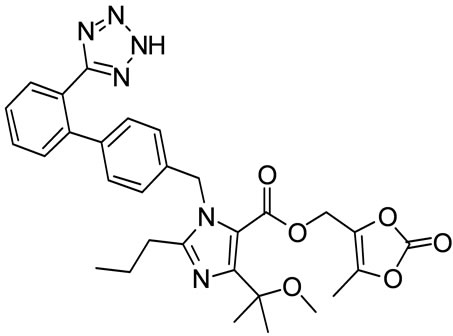
Olmesartan Imp-A Imp-B Imp-C
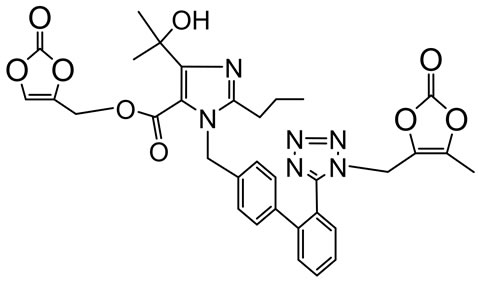
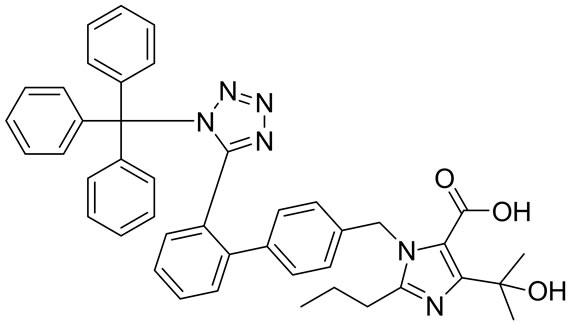

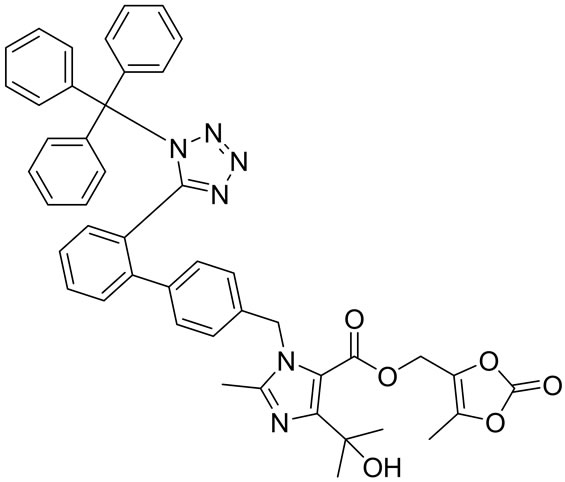
Imp-D Imp-E Imp-F Imp-G
Figure 1. Chemical structures and labels of Olmesartan and its impurities.
establish its inherent stability characteristics, leading to separation of degradation products and hence supporting the stability of the proposed analytical procedures. It also required that analytical test procedures for stability samples should be stability indicating and they should be fully validated (7 - 10). Hence, an attempt has been made to develop and accurate, rapid, specific and reproducible method for the determination of Olmesartan and all seven impurities in bulk drug samples along with method validation as per ICH norms. The stability tests were also performed on both drug substances and drug product as per ICH norms.
2. Experimental
2.1. Chemicals
Active pharmaceutical ingredient samples of Olmesartan and its impurities were received from bulk manufactures of Inogent laboratories (Hyderabad, India). The HPLC grade Acetonitrile (ACN) was purchased from Merck (Darmstadt, Germany). Analytical grade Potassium dihydrogen phosphate was obtained from Merck (Mumbai, India). High purity water was prepared by using Millipore Milli-Q plus purification system (Millipore, Bedford, USA). All samples and impurities used in the study were greater than 99.0% purity.
2.2. Equipment
A Waters HPLC system with a diode array detector was used for method development and forced degradation studies. The out put signal was monitored and processed using Empower software. The HPLC system used for method validation was waters Breeze HPLC, Consists of 2695 separation module and 2998 photo diode array detector. The out put signal was monitored and processed using Empower software on Pentium computer (Digital Equipment Co). Photo stability studies were carried out in a photo stability chamber (Sayno, Leicestershire, UK). Thermal stability studies were performed in a dry air oven (Mack Pharmatech, Hyderabad).
2.3. Chromatographic Conditions
The Chromatographic column used was an symmetry C18 column (150 × 4.6 mm 5 µm) using Mobile phase consists of Mobile phase-A and Mobile phase-B, Mobile phase-A was prepared by dissolving 2.7 g of potassium di hydrogen phosphate in 1000 mL of Milli-Q water, adjusted pH of solution to 2.5 with ortho phosphoric acid and filter through 0.45 µm filter and Mobile phaseB consists of Acetonitrile and water in 9:1 ratio. The flow rate of the mobile phase was 1.0 mL·min–1. The gradient programme applied is presented in the Table 1. The column temperature was maintained at 40˚C. A wave length of 215 nm was employed for the detection. The injection volume was 10 µL. Acetonitrile was used as diluent.
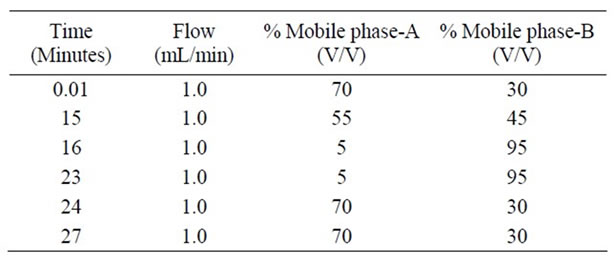
Table 1. Gradient program.
2.4. Preparation of Solutions
2.4.1. Preparation of Standard Solutions
A stock solution of Olmesartan (2.0 mg·mL–1) was prepared by dissolving an appropriate amount in diluent. A stock solution of impurities (2.0 mg·mL–1) (mixture of Imp-A to Imp-G) at a concentration of (2.0 mg·mL–1) was also prepared in diluent. Working solutions were prepared from above stock solution for related substances determination and assay determination, respectively.
2.4.2. Preparation of Sample Solution
Olmesartan tablets containing 40 mg of Olmesartan. The active ingredients present in Olmesartan were lactose mono hydrate, sodium lauryl sulphate, microcrystalline cellulose, silicon dioxide and magnesium stearate. Twenty Olmesartan tablets (40 mg) were weighed and the average weight was calculated. The tablets were powdered in a mortar and sample of the powder equivalent to 40 mg of the active pharmaceutical ingredient (Olmesartan) was transferred in to 100 mL volumetric flask. Approximately 75 mL of diluent were added and the flask was placed on rotary shaker for 10 min and sonicated for 10 min to dissolve the material completely. The solution was then diluted to 100mL and centrifuged at 3000 rpm for 10 min. The supernatant was collected and filtered through a 0.45 µm pore size Nylon 66-membrane filter. The filtrate was used as sample.
2.5. Analytical Method Validation
The developed chromatographic method was validated for Specificity, Linearity, Precision, Accuracy, Sensitivity, Robustness and System suitability.
2.5.1. Specificity
Specificity is the ability of the method to measure the analyte response in the presence of its potential impurities. Stress testing of the drug substance can help to identify the likely degradation products, which can in turn help to establish the degradation pathways and intrinsic stability of the molecule and validated the stability indicating power of the analytical procedures used.
The specificity of Olmesartan in the presence of its impurities namely imp-A, imp-B, imp-C, imp-D, imp-E, imp-F and imp-G and degradation products was determined by the developed LC method. Forced degradation studies were also performed on Olmesartan to provide an indication of the stability indicating property and specificity of the proposed method. The stress conditions employed for degradation study includes light (carried out as per ICH Q1B), heat (60˚C), acid hydrolysis (1 N HCl), base hydrolysis (1 N NaOH), water hydrolysis (room temperature at 48 h) and oxidation (3% H2O2). For heat and light studies, the study period was 10 days where as acid, base, peroxide and water hydrolysis the test period was 4h. Peak purity of stressed samples of Olmesartan was checked by using a 2996 photo diode array detector of waters Corporation, MA, USA.
Assay studies were carried out for stress samples against qualified reference standard and the mass balance (% assay +% of impurities +% of degradation products) was calculated.
2.5.2. Precision
The precision of the related substance method was checked by injecting six individual preparations (1000 µg·mL–1) of Olmesartan each spike with 0.2% impurity. The %RSD for percentage of each impurity was calculated. Precision study was also determined by performing the same procedures on a different day (Inter-day precision). The intermediate precision (rugged-ness) of the method was also evaluated by different analyst, different column and different instrument in the same laboratory.
Assay method precision was evaluated by carrying out six independent assays of test sample of Olmesartan against qualified reference standard. The %RSD of six assay values obtained was calculated. The intermediate precision of related substance method and assay method was evaluated by different analyst and by using a different instrument from the same laboratory.
2.5.3. Sensitivity
Sensitivity was determined by establishing the limit of detection (LOD) and Limit of quantification (LOQ) for impurity-A to impurity-G estimated at a signal-to-noise ratio of 3:1 and 10:1 respectively, by injecting dilute solutions with known concentration. The precision study was carried out at the LOQ level by injecting six individual preparations of impurity-A to impurity-G and the % RSD for the areas of each analyte was calculated.
2.5.4. Linearity and Range
Linearity test solutions for the assay method have prepared from stock solution at five concentrations levels from 50% to 200% of assay analyte concentrations (250, 375, 500, 750 and 1000 µg·mL–1).
A Linearity test solution for related substance method was prepared by diluting the impurity stock solution to the required concentrations. The solutions were prepared at six concentration levels. From LOQ to 200% of the permitted maximum level of the impurity (i.e. LOQ, 0.10%, 0.15%, 0.20%, 0.30%, and 0.40%) was subjected to linear regression analysis with the least squares method. Calibration equation obtained from regression analysis was used to calculate the corresponding predicted responses. The residual and sum of the residual squares were calculated from the corresponding predicted responses. Linearity was checked for three consecutive days in the same concentration range for both assay and related substances method and the % RSD value of the slope and Y-Intercept of the calibration curve ware calculated. Upper and lower level of range was also established.
2.5.5. Accuracy
The accuracy of the assay method was evaluated in triplicate at five concentration levels i.e. 250, 375, 500, 750 and 1000 µg·mL–1 in bulk drugs and pharmaceutical dosage forms. At each concentration, three sets were prepared and injected in triplicate. The percentage of recovery was calculated at each level.
The bulk sample shows the presence of impurity-C and impurity-D at a level of 0.12% and 0.06% of total impurities (Limit: Not more than 0.20% of known and 0.15% for unknown impurities and 0.50% for total impurities). The study was carried out in triplicate at 0.10%, 0.15%, 0.20%, 0.30%, and 0.40% of analyte concentration (1000 µg·mL–1).
2.5.6. Robustness
By deliberate change in experimental conditions the resolution between Olmesartan, imp-A, imp-B, imp-C, imp-D, imp-E, imp-F and imp-G was evaluated. To study the effect of flow rate on the resolution, 0.2 units changed i.e. 0.8 and 1.2 mL·min–1. The effect of pH on resolution of impurities was studied by varying ±0.1 pH units (i.e. buffer pH altered from 2.5 to 2.4 and 2.6). The effect of column temperature on resolution was studied at 35˚C and 45˚C instead of 40˚C. In all the above varied conditions, the components of the mobile phase were held constant.
2.5.7. Solution Stability and Mobile Phase Stability
The solution stability of Olmesartan in the assay method was carried out by leaving the test solutions of sample in tightly capped volumetric flasks at room temperature for 48 h. The same sample solutions were assayed in 6 h intervals up to the study period against freshly prepared standard solution. The mobile phase stability was also carried out by assaying the freshly prepared sample solutions against freshly prepared reference standard solutions at six hours intervals up to 48 hour. Mobile phase prepared was kept constant during the study period. The %RSD of assay of Olmesartan was calculated for the study period during mobile phase and solution stability experiments.
The solution stability of Olmesartan and its impurities in the related substance method was carried out by leaving both spiked and unspiked sample solution in tightly capped volumetric flasks at room temperature for 48 hours. Content of imp-A, imp-B, imp-C, imp-D, imp-E, imp-F and imp-G were determined for every 6 hour interval up to the study period.
Mobile Phase stability was also carried out for 48 h by injecting the freshly prepared sample solutions for every 6 hour interval. Contents of imp-A, imp-B, imp-C, imp-D, imp-E, imp-F and imp-G were checked in the test solutions. Mobile phase prepared was kept constant during the study period.
3. Results and Discussion
3.1. Method Development and Optimization
The main target of the HPLC method was to achieve the separation of imp-F and imp-G and both are long retained impurities with respect early retained imp-A peak. Potassium dihydrogen orthophosphate buffer (20 mM) with pH 2.5 as Mobile phase-A and Methanol as Mobile phase-B for initial trail on a C18 stationary phase with a 25 cm length, 4.6 mm ID and 5 μm particle size. Flow rate was 1.0 mL·min–1 when Olmesartan sample spiked with all impurities was injected the resolution (Rs) between all impurities was >2.0 and retention time (Rt) was very high (about 30 mins). In this trail I got less resolution between impurity-F and Impurity-G and both impurities retention times are very high. Another trail I made changes on mobile phase-B. Acetonitrile is used in place of methanol and injected sample spiked and gradient changed to reduce longer run time of Olmesartan and other impurities. With this trail achieved less retention time of Olmesartan and peak shapes of impurities are also improved. Based on 2nd trail another trail was carried out by using C18 stationary phase with a 15 cm length, 4.6 mm ID and 5 μm particle size, with column temperature 45˚C. The retention time of Olmesartan observed about 12 mins but resolution between impurities and Olmesartan is <2.0. To further improvements of resolution between impurities and Olmesartan, 10% Water is added with Acetonitrile in mobile phase-B. Observed all impurities well resolved and observed resolution between more than 3.0.Satisfactory resolution between impurities and symmetry of the Olmesartan peak was observed in final optimised method.
Forced degradation studies: Olmesartan drug was exposed to 1N HCl, 3% H2O2, 1N NaOH at 60˚C with continuous constant stirring. Olmesartan has shown signifycant sensitivity towards treatment of 1 N HCl, 3% H2O2 and 1 N NaOH. The drug gradually undergone degradation with time in 1 N HCl, 3% H2O2 and 1 N NaOH. No major degradation products were observed when Olmesartan is stressed in photolytic and thermal conditions after 48 hours. From the degradation studies peak purity test results derived from the PDA detector, confirmed that the Olmesartan peak was homogeneous and pure in all the analyzed stress samples. The mass balance of stressed sample was close to 99.2%. No degradants were observed after 45 min in the extended runtime of 60 min of all the Olmesartan samples. The developed HPLC method was found to be specific in the presence of impurity-A to impurity-G and their degradation products confirm the stability indicating power of the developed method.
3.2. Method Validation
Olmesartan and all impurities were prepared in the diluent at a concentration of 100 ppm and scanned in a UVVisible spectrometer; all the seven impurities and Olmesartan have UV maxima at about 215 nm, Hence detection at 215 nm was selected for quantification of Olmesartan and related impurities.
In the optimized condition of Olmesartan of imp-A, imp-B, imp-C, imp-D, imp-E, imp-F and imp-G were well separated with a resolution grater than 3 and typical retention times of imp-A, imp-B, imp-C, imp-D, imp-E, imp-F and imp-G were about 10.4, 3.7, 9.2, 13.1, 17.3, 19.2, 21.5 and 22.0 respectively (Figure 2). The system suitability results are given in Table 2. The resolution
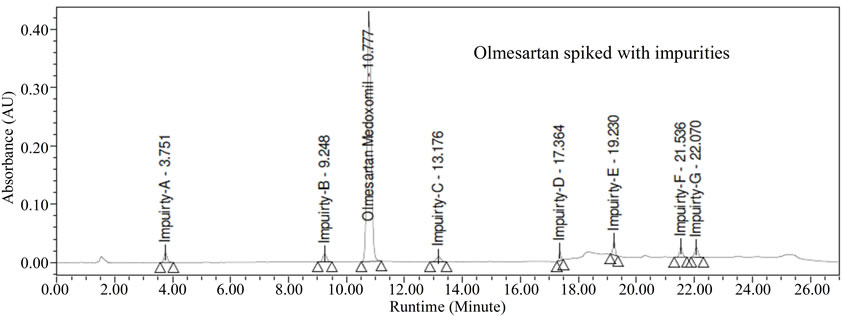
Figure 2. Typical chromatogram of Olmesartan spiked with impurities 0.2% specification level.
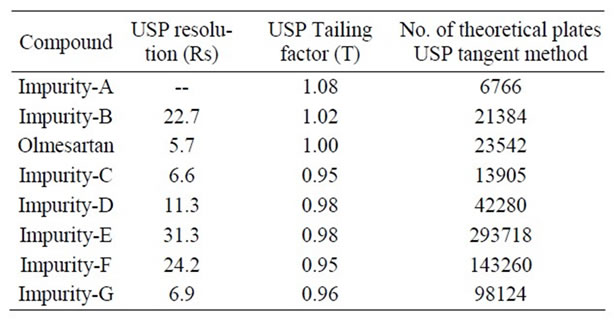
Table 2. System suitability report.
greater than 3.0 between any two peaks. The tailing factor for all the peaks was about 1.0; theoretical plates were grater than 6000.
The interference of excipients (cellulose microcrystalline, Silica colloidal anhydrous and magnesium sterate) was also checked by injecting sample solutions of excipients. There was no interference of excipients. There was no interference of excipients with impurities (imp-A, imp-B, imp-C, imp-D, imp-E, imp-F and imp-G) and Olmesartan.
3.2.1. Precision
The %RSD of Olmesartan during the assay method precision study was within 0.4 and in intermediate precision study was within 0.3%. The %RSD of area of imp-A, imp-B, imp-C, imp-D, imp-E, imp-F and imp-G in the related substance method precision study was within 0.8%, conforming the good precision of the developed analytical method.
3.2.2. Sensitivity
The limit of detection of imp-A, imp-B, imp-C, imp-D, imp-E, imp-F and imp-G were 0.010%, 0.011%, 0.010%, 0.012%, 0.011%, 0.010% and 0.011% and limit of quantification was 0.032%, 0.032%, 0.03%, 0.035%, 0.032%, 0.032% and 0.034% (of analyte concentration, i.e.1000 µg·ml–1) respectively with 10 µL injection volume. The precision at LOQ concentration for imp-A, imp-B, imp-C, imp-D, imp-E, imp-F and imp-G was below 2%.
3.2.3. Linearity
Linear calibration plot for assay method was obtained over the calibration range tested, i.e. 250 - 1000 µg·mL–1 and the correlation coefficient obtained was grater than 0.999. The results showed an excellent correlation between the peak area and concentration of the analyte.
Linear calibration plot for the related substance method was obtained over the calibration range tested i.e. LOQ to 0.4% for imp-A, imp-B, imp-C, imp-D, imp-E, imp-F and imp-G. The correlation coefficient obtained was grater than 0.999 for all seven impurities. The results showed an excellent correlation between the peak area and concentration of imp-A, imp-B, imp-C, imp-D, imp-E, imp-F and imp-G.
The best fit linear equation obtained was y = 799168x – 461. At all concentration levels, standard deviation of peak is was significantly low and RSD was below 1.0%. Analysis of residuals indicated that they were scattered within ±1% with respect to 100% concentration response. Linearity was checked for related substances over the same concentration ranges on three consecutive days the %RSD of the slope and y-intercept of the calibration plots were within 1.2 and 1.5 respectively. The range of the method had on LOQ to 0.4% of analyte concentration (1000 µg·mL–1).
3.2.4. Accuracy
The percentage recovery of Olmesartan in bulk drug sample ranged from 98.5% to 101.2% and in pharmaceutical dosage forms from 100.5% to 101.7% (Table 3). The percentage recovery of imp-A, imp-B, imp-C, imp-D, imp-E, imp-F and imp-G in bulk drug samples range from 98.6% to102.5% (Table 4). HPLC chromatograms of spiked sample with all seven impurities in Olmesartan bulk drug sampled are shown in Figure 3.
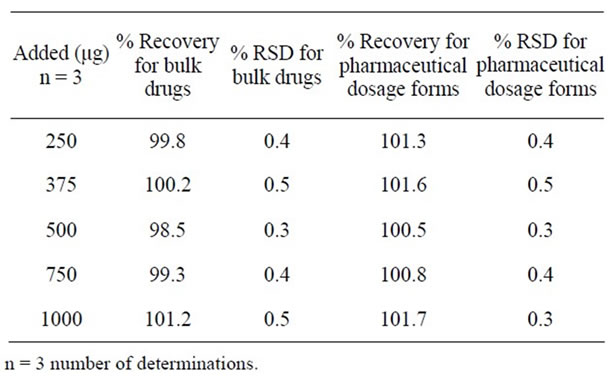
Table 3. Results of accuracy study for bulk drugs and pharmaceutical dosage forms.
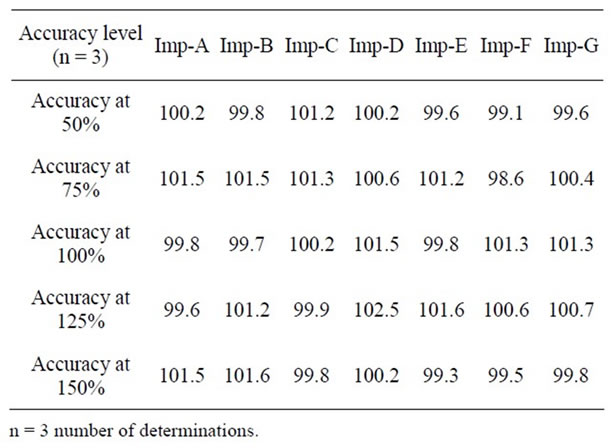
Table 4. Results accuracy study for impurities.
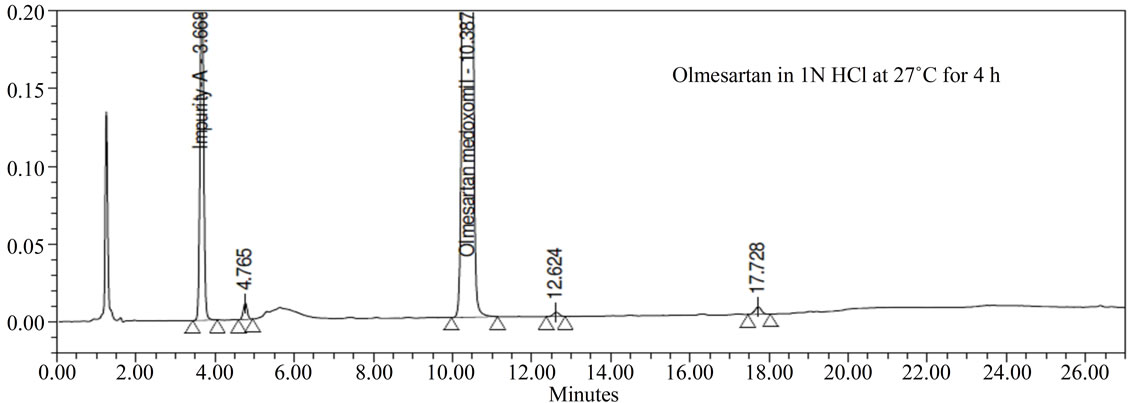
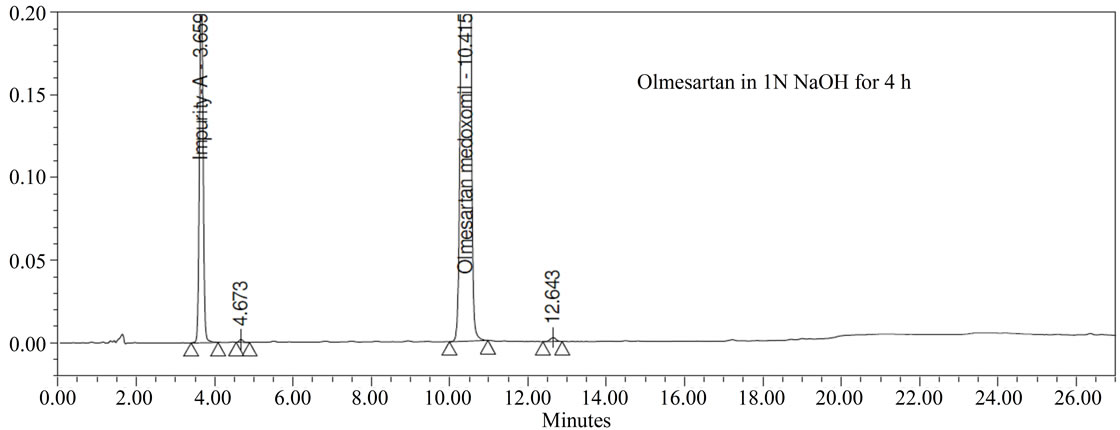
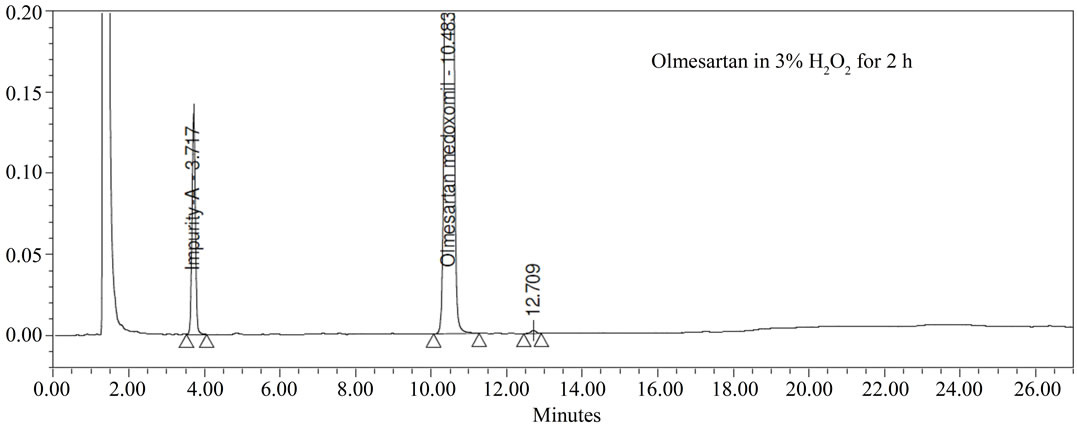
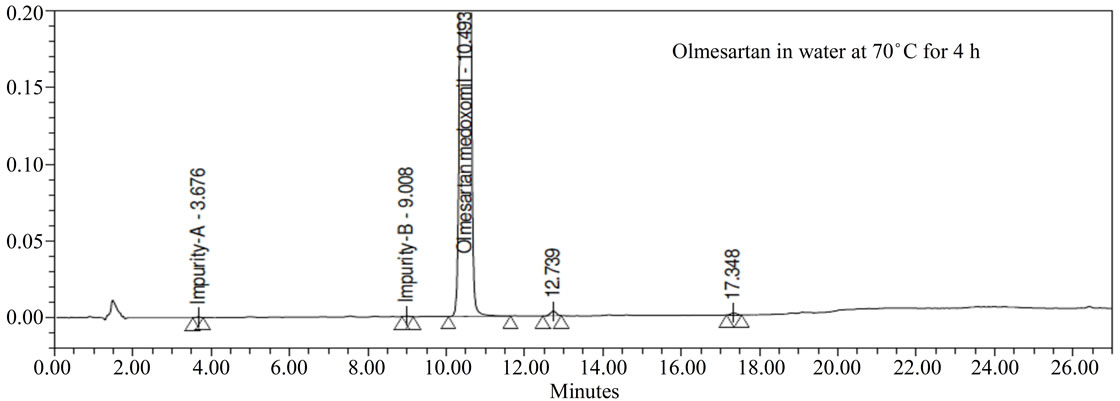
Figure 3. Typical Chromatogram of stressed Olmesartan sample.
3.2.5. Robustness
Close observation of analysis results deliberately changed chromatographic conditions (flow rate, pH and column temperature) revealing that the resolution between closely eluting impurities namely imp-A, imp-B, imp-C, imp-D, imp-E, imp-F and imp-G were always grater than 2.0, illustrating the robustness of the method.
3.2.6. Solution Stability and Mobile Phase Stability
The %RSD of assay of Olmesartan during the solution stability and mobile phase stability experiments was within 0.5. No significant changes were observed in the content of imp-A, imp-B, imp-C, imp-D, imp-E, imp-F and imp-G during solution stability and mobile phase stability experimental. The solution stability and mobile phase stability experiments data confirmed that sample solution and mobile phase used during assay and related substance determination were stable up to the study period was 48 hours.
3.2.7. Assay Analysis
Analysis was performed for different batches of Olmesartan in both bulk drug samples (n = 3) ranged from 99.5% to 99.92% and dosage forms (n = 3) ranged from 100.1% to 101.2%.
4. Conclusion
The HPLC method developed for quantitative and related substance determinations of Olmesartan in both bulk drugs and pharmaceutical dosage forms were precise, accurate and specific. The method was completely validated showing satisfactory data for all the method validation parameters tested. The developed method is stability indicating and can be used for the routine analysis of production samples and also to check the stability of Olmesartan samples.
5. Acknowledgements
The authors wish to thank the management of Inogent laboratories, Hyderabad, India. For supporting of this work.
REFERENCES
- K. koga, S. Yamagishi, M. Takeuchi, Y. Inagaki, S. Amano, T. Okamoto, T. Saga, Z. Makita and M. Yoshizuka, “Serum Levels of Glucose-Derived Advanced Glycation End Products Are Associated with the Severity of Diabetic Retinopathy in Type 2 Diabetic Patients without Renal Dysfunction,” International Journal of Clinical Pharmacology Research, Vol. 22, No. 1, 2002, pp. 7-13.
- L. R. Schwocho and H. N. Masonson, “Pharmacokinetics of CS-866, a New Angiotensin I Receptor Blocker, in Healthy Subjects,” Journal of Clinical Pharmacology, Vol. 41, No. 5, 2001, pp. 515-527. doi:10.1177/00912700122010393
- B. S. Lee, M. J. Kang, W. S. Choi, Y. B. Choi, H. S. Kim, S. K. Lee and Y. W. Choi, “Solubilized Formulation of Olmesartan Medoxomil for Enhancing Oral Bioavailability,” Archives of Pharmacal Research, Vol. 32, No. 11, 2009, pp. 1629-1635. doi:10.1007/s12272-009-2117-x
- O. Sagirli, A. Onal, S. E. Toker and D. Şensoy, “Simultaneous HPLC Analysis of Olmesartan and Hydrochlorothiazide in Combined Tablets and in Vitro Dissolution Studies,” Chromatographia, Vol. 66, No. 3-4, 2007, pp. 213-218. doi:10.1365/s10337-007-0304-9
- International Conference on Harmonization (ICH GuideLines, Q3A(R) Impurities in New Drug Substances, October 2006.
- R. B. Gandurib, R. A. Lankaa, et al., “New RP-HPLC Method for The Determination of Olmesartan Medoxomil in Tablet Dosage Form,” Eurasian Journal of Analytical Chemistry, Vol. 5, No. 2, 2010, pp. 145-151.
- A. R. Rote and P. D. Bari, “Spectrophotometric Estimation of Olmesartan Medoxomil and Hydrochlorothiazide in Tablet,” Indian Journal of Pharmaceutical Sciences, Vol. 72, No. 1, 2010, pp. 111-113. doi:10.4103/0250-474X.62245
- Stability Testing of New Drug Substances and Drug Products Q1A(R2), International Conference on Harmonization, IFPMA, Geneva, 2003.
- USP 2011 United States of Pharmacopoeia, 34th Edition, “United States Pharmacopial Drug Stability Principles and Practices (2000),” In: J. T. Carstensen and C. T. Rhodes, Eds., 3rd Edition, Marcel Dekker, New York.
- M. Bakshi and S. Singh, “Development of Validated Stability Indicating Assay Methods Critical Review,” Journal of Pharmaceutical and Biomedical Analysis, Vol. 28, No. 6, 2002, pp. 1011-1040. doi:10.1016/S0731-7085(02)00047-X
- R. N. Sharma and S. S. Pnacholi, “RP-HPLC-DAD Method for Determination of Olmesartan Medoxomil in Bulk Drug and Tablets Exposed to Forced Conditions,” Acta Pharmaceutica, Vol. 61, No. 1, 2010, pp. 13-24. doi:10.2478/v10007-010-0010-2
- P. Sengupta, A. Das and T. K. Pal, “Stability Indicating RP-HPLC Method for Simultaneous Determination of Olmesartan Medoxamil and Pioglitazone in Fixed Dose Combination Tablet Dosage Form,” Asian Journal of Chemistry, Vol. 22, No. 8, 2010, pp. 6471-6479.
NOTES
*Corresponding author.