International Journal of Clinical Medicine
Vol.4 No.1(2013), Article ID:27302,7 pages DOI:10.4236/ijcm.2013.41010
Sleep Duration and Its Links to Psychological Distress, Health Status, Physical Activity and Body Mass Index among a Large Representative General Population Sample
![]()
National Drug Research Institute, Curtin University, Perth, Australia.
Email: *w.liang@curtin.edu.au
Received November 24th, 2012; revised December 28th, 2012; accepted January 13th, 2013
Keywords: Psychological Distress; General Health; Sleep
ABSTRACT
This study aimed to investigate associations between: (a) psychological distress, self-perceived health status and sleep duration among a large representative general population sample; and (b) patterns of sleep duration, physical activity and Body Mass Index among a subgroup of participants who self-reported as being in good health with low psychological distress. Data collected from six waves of the Nation Health Interview Surveys (NHISs) was employed. The results indicated that both psychological distress and self-perceived health status were strong predictors of sleep duration. Participants with high serious psychological distress scores reported sleeping 7 - 8 hours less often than those in low or moderate psychological distress and were also most likely to sleep for less than 6 hours or 9 or more hours. Similar patterns were observed for sleep duration by self-reported health status. Subgroup analysis including only participants in self-reported excellent or very good physical health with low mental distress scores showed that participants who engaged in higher frequencies of vigorous and strengthening exercises were more likely to sleep less than six hours, and participants with a BMI of 25 or higher were also more likely to sleep less than six hours.
1. Introduction
Sleep is essential for humans [1], but the functions of sleep are unclear. Past hypotheses have suggested that an important function of sleep is to reduce metabolic rate and conserve energy (Berger and Phillips, 1995). During sleep, however, metabolic rate in the brain varies by sleep stages; it has been observed that most regions of the brain are less active during slow-wave sleep but some regions are more active during rapid-eye movement sleep [2,3]. Rather than simply being a time of rest for the body and brain, it is widely accepted that, during sleep, essential neuronal activities take place such as memory consolidation [1,4]. Sleep is associated with increased secretion of growth hormone [5] and sleep deprivation impairs normal immune activity [6] as well as carbohydrate metabolism and endocrine function [7]. Although maintaining adequate sleep is considered crucial for health, the required amount of essential sleep or “core” sleep is not clear and scientific debate is ongoing. Core (or basal) sleep is generally believed to be about eight hours, but this may vary greatly between individuals [8,9]. Observational studies have indicated that maintaining 7 - 8 hours of sleep is associated with the best health outcomes, while sleeping less or more is associated with poorer health status and increased risk of morbidity and mortality [10-17]. Sleep duration is also associated with a large number of social, economic and lifestyle factors that influence health and risk of morbidity and mortality [4], while stress, depression and poor physical health status impair sleep quality and sleep duration [18-22]. Given that the brain is to perform certain tasks (i.e. memory consolidation) during sleep, then variations in processing efficiency may affect the quantity of sleep required for different individuals (i.e. individuals with higher efficiency of neuronal sleep tasks may require less sleep). Efficiency itself may be influenced by metabolic rate in the brain, and even possibly related to global metabolic rate and energy expenditure. Moreover, sleep duration, energy intake, metabolic rate and energy expenditure interact with psychological distress, health status, physical activity levels and body mass [23].
This study aimed to investigate the associations between: (a) psychological distress level, self-perceived health status and sleep duration; and (b) patterns of sleep duration, physical activity level and Body Mass Index (BMI) among a subgroup of participants who self-reported as being in excellent or very good health with low psychological distress. Data collected from six waves of the Nation Health Interview Surveys (NHISs) was employed.
2. Method
This study used combined data from seven waves (2004- 2010) of National Health Interview Survey (NHIS) obtained from the official website of Integrated Health Interview Series of U.S. National Health Interview Survey: Minnesota Population Centre and State Health Access Data Assistance Center, Integrated Health Interview Series: Version 5.0. Minneapolis: University of Minnesota, 2012 (http://www.ihis.us). Details of the survey sampling strategy and data collection methods have been described elsewhere [24-28]. Briefly, the NHISs were nationally focused and conducted by the National Center for Health Statistics (NCHS), Centers for Disease Control and Prevention (CDC). NHISs were conducted to provide comprehensive estimations of health indictors at a national level, and state stratified samples were draw from all 50 states and the District of Columbia to ensure the samples were representative at state level [24-28]. Households were the basic unit of the NHIS. For each selected household, if there was more than one family residing in a household, all families in the household were selected. One randomly selected adult (>18 yrs) was selected per family to provide detailed information regarding their health and health-related behaviors. In this study we used the following information collected from the sample adults: usual hours of sleep, self-reported health status, health status compared to one year ago, level of psychological distress measured by the Kessler 6 (K6) scale, demographics (age, gender, race, highest education attained, income, occupation, marital status, region and year of interview), Body Mass Index (BMI) and frequency of physical activity (moderate/vigorous/strengthening). Distributions of demographics, Body Mass Index and frequency of physical activity in the sample have been described on the National Health Interview Survey website (http://www.cdc.gov/nchs/products/hestats.htm).
Sleep quantity was measured in hours in NHISs. Sleep was categorized according to length based on current understandings on normal sleep pattern [4,8]: 1) less than 6 hours, 2) 6 hours 3) 7 - 8 hours, 4) 9 hours or more. Self-reported health status was used as the indicator of health. Psychological distress levels were indicated by Kessler 6 scores. The Kessler 6 scale is a measure of non-specific psychological distress experienced in the last 30 days, and is a reliable and valid indicator of current mental health status [29]. Adult health status was divided into: 1) excellent and very good; 2) good; and, 3) fair and poor. Psychological distress scores measured by the Kessler 6 questionnaire were grouped as follows: 1) minimal (K6 score: 0 - 6); 2) moderate (K6 score: 7 - 12); and, 3) serious (K6 score: 13 - 24) [30,31]. In the stratified analysis, proportion of sleep by duration was estimated and compared across age groups, health status and psychological distress. In the multivariate analysis, multinomial logistic regression was applied to investigate associations between sleep duration and age, health status and psychological distress while adjusting for demographics (age, gender, race, highest education attained, income, marital status and region), Body Mass Index (BMI), and frequency of 10 minutes or more leisure-time physical activity (separately for moderate, vigorous, strengthening. Moderate leisure-time physical activities were defined as “only light sweating or a slight to moderate increase in breathing or heart rate”, vigorous leisuretime physical activities were defined as “heavy sweating or large increases in breathing or heart rate”, and strengthen leisure-time physical activities were defined as physical activities specifically designed to strengthen your muscles [26]. BMI was categorized into four groups: 1) less than 18.5; 2) 18.5 - 24.9; 3) 25 - 29.9; and, 4) 30 and higher. Frequency of leisure-time physical activities for each of moderate, vigorous and strengthening levels were categorised into eight groups: 1) never; 2) less than once per week; 3) 1 - 2 times per week; 4) 3 - 6 times per week; 5) 7 times or more per week; 6) unable to perform physical activity and, 7) frequency not reported.
Further subgroup analysis aimed to investigate the association between sleep, physical activity and BMI in order to minimize the potential confounding effects of physical and mental health status. The sub-group sample was limited to participants who: self-reported excellent or very good health status; indicated minimum psychological distress (K6 score: 0 - 6); answered “about the same” to the question: “Compared with 12 MONTHS AGO, would you say your health is better, worse, or about the same?”; and, were able to perform any of the three levels of physical activity. Multinomial logistic regression was employed and weighting was used in all analysis (weights were calculated by the data providers to ensure a representative sample).
3. Results
There were a total 187,091 adult records from the seven waves of NHIS. Information on sleep duration, health status or Kessler 6 score was not available for about 3% of participants and they were therefore excluded, leaving a total of 181, 261 participant records for analysis. Distribution of sleep duration by health status and age group is shown in Figure 1. For all health status groups, the most commonly reported sleep duration was 7 - 8 hours, there was however, substantial variation. Across all age groups, participants with fair or poor health were less likely than those reporting excellent, very good or good health to sleep 7 - 8 hours. In addition, participants in fair or poor health were more commonly represented among those sleeping less than 6 hours and those sleeping 9 hours or more. Conversely, those in excellent or very good health more commonly slept 7 - 8 hours than those in good, fair or poor health. Similar patterns were observed for sleep duration by psychological distress. Participants with high serious psychological distress scores reported sleeping 7 - 8 hours less often than those in low or moderate psychological distress and were also most likely to sleep for less than 6 hours or 9 or more hours (Figure 2).
Multivariate analysis confirmed the significant associations observed in the stratified analysis among sleep duration, health status and psychological distress. Participants with less desirable health status or higher psychological distress were significantly more likely to sleep
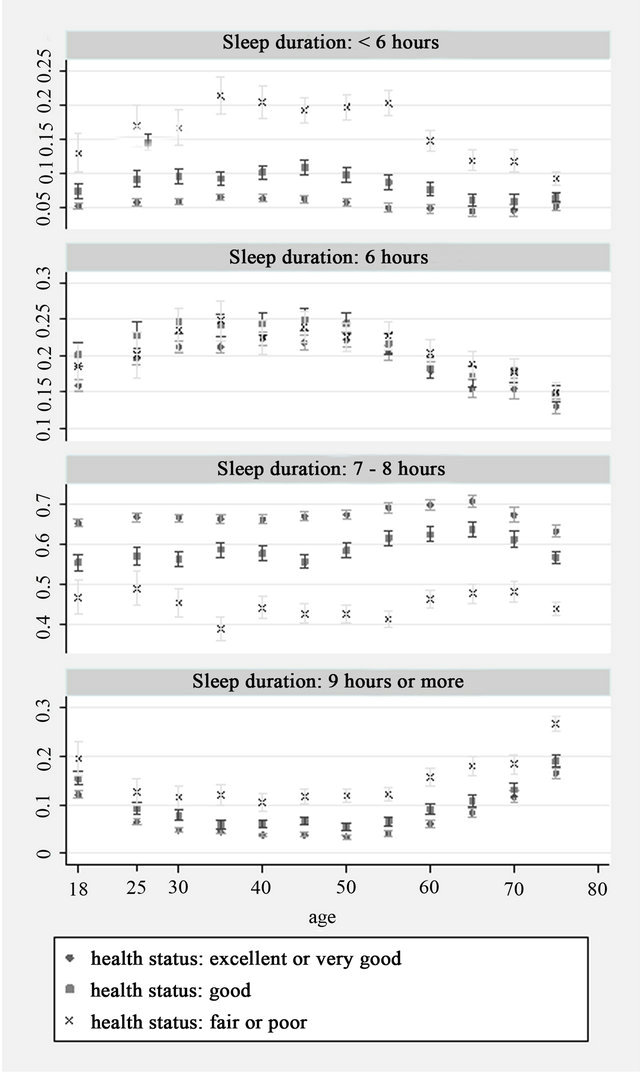
Figure 1. Sleep duration by age and health status (Y axis: Proportion).
more or less than 7 - 8 hours (Table 1). Among participants with excellent or very good self-perceived health status and low psychological distress only about 5% slept less than 6 hours and a further 20% slept between 6 and 7 hours. Comparing to males, females are significantly less likely to sleep six hours.
Table 2 shows results from the subgroup analysis of participants with excellent or very good self-perceived health status and lowest level of psychological distress. After controlling for potential confounders, undertaking vigorous leisure exercise 7 or more times per week or strengthening exercises 3 or more times per week were both associated with a significantly higher likelihood of sleep duration lasting less than 6 hours. However, undertaking moderate physical activity 3 - 6 times per week was associated with significantly lower likelihood of sleep lasting less than 6 hours. It was also observed that taking vigorous exercise once or more per week was associated with significantly lower prevalence of sleeping 9 or more hours, but moderate physical activity performed
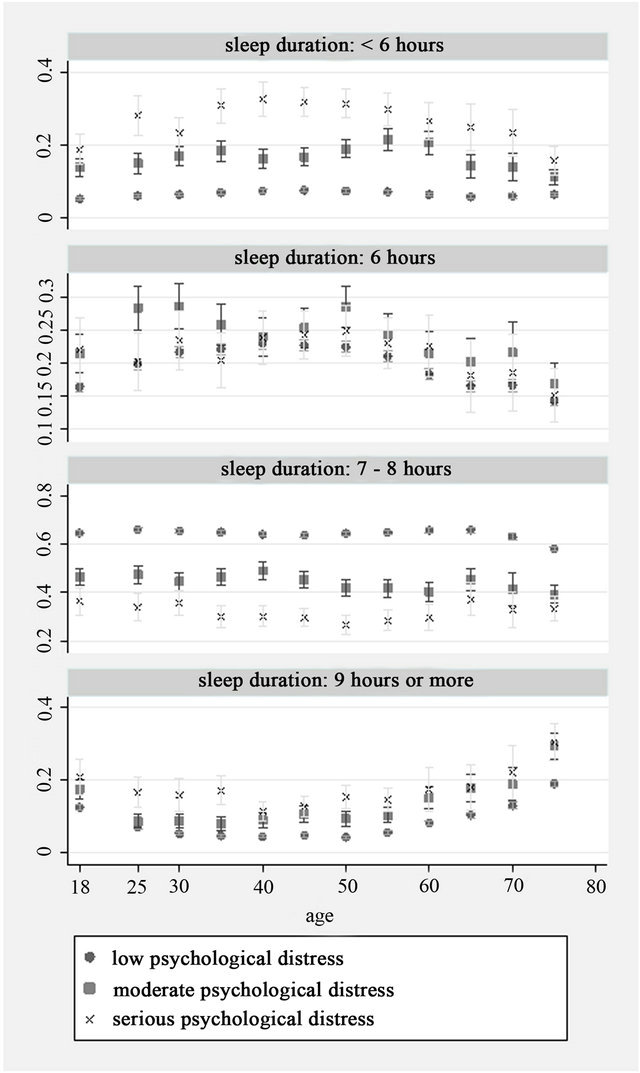
Figure 2. Sleep duration by age and psychological distress level (Y axis: Proportion).
Table 1. Association between health status, psychological distress and sleep duration.
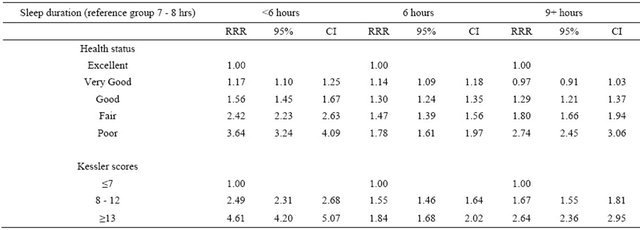
RRR: relative-risk ratios Model adjusted for health status, Kessler scores, age, gender, race, highest education attained, income, marital status, region of residence, Body Mass Index (BMI), and frequency of 10 minutes+ leisure-time physical activity.
Table 2. Association between physical activity, BMI and sleep duration among participants with excellent or very good selfperceived health status and lowest level of psychological distress.
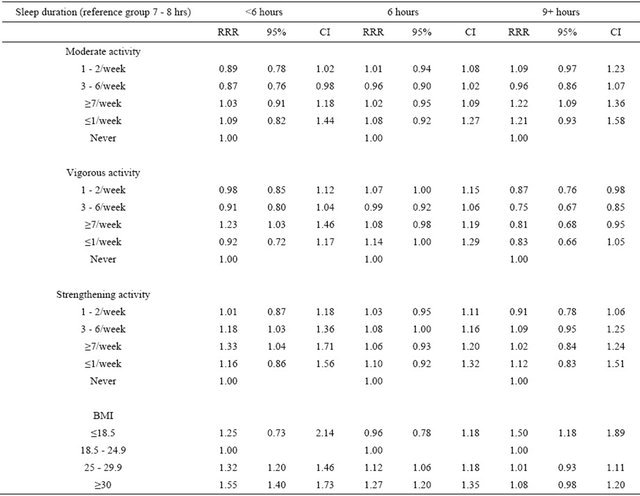
RRR: relative-risk ratios Model adjusted for age, gender, race, highest education attained, income, marital status, region of residence, Body Mass Index (BMI), and frequency of 10 minutes+ leisure-time physical activity.
7 or more times per week was associated with significantly higher prevalence of sleeping 9 or more hours. Compared to participants with normal body weight, overweight and obese participants were more likely to sleep 6 hours or less, while underweight participants were significantly more likely to sleep 9 hours or more.
4. Discussion
This population-based study showed that both psychological distress and self-perceived health status were strong predictors of sleep duration. This observation is consistent with the general consensus in the literature that poor physical and mental health impairs sleep quality and increases the risk of sleep disturbance. Mental disorders and physical morbidities increase the risk of insomnia leading to reduced sleep duration, in addition, they may reduce the quality of sleep, which can lead to an increase in total sleep hours [10-16]. Conversely, insomnia and poor sleep quality may produce negative impacts on both physical and mental health [1,4,10,11, 19]. It should be noted, however, that bed rest is a treatment for many physical health problems (and many health problems may increase fatigue), and this may mediate part of the apparent association between poor health and long sleep hours.
The subgroup analysis only included participants in excellent or very good self-reported physical health with low mental distress scores, therefore minimizing the likelihood that variation in sleep duration among this group was due to serious underlying physical or mental health conditions. Only about 5% of the subgroup indicated less than six hours of sleep per night. Nevertheless, results indicated that participants who engaged in higher frequencies of vigorous and strengthening exercises were more likely to sleep less than six hours, as were participants with a BMI of 25 or higher. Participants with a BMI less than 18.5 were more likely to sleep 9 hours or more. Being physically active [32,33] or being overweight or obese (Ravussin et al., 1982; Leibel et al., 1995; Javed et al., 2010) is known to increase metabolic rate. Experimental studies of sleep restriction and energy expenditure have shown that in both animals and humans, partial sleep deprivation increases energy expenditure [34-36]. In addition, experimental studies indicate that sleep restriction increases sensations of hunger and appetite which increase energy intake, and facilitate increased body weight and energy expenditure [37-39]. It has been observed in animal studies [40,41] that increased energy intake and energy expenditure engenders physiological compensation for sleep deficits and a similar mechanism has been suggested for healthy people [23]. Taken together, the current findings and results from past studies reasonably lead to the postulation that the brain’s efficiency in conducting neurophysiological tasks during sleep may be higher among healthy people who require less sleep and this may be related to increased metabolic rate among this sub population, whereas increases in energy expenditure which in turn increase energy intake (associated with high BMI) may provide some physiological compensation for sleep deficit when sleep duration is restricted due to external factors [23].
5. Conclusion
Both psychological distress and self-perceived health status were strongly association with sleep duration. Among participants with low psychological distress and good self-perceived health status, higher levels of physiccal activity and higher BMIs were both associated with shorter sleep duration.
REFERENCES
- M. P. Walker, “The Role of Sleep in Cognition and Emotion,” Annals of the New York Academy of Sciences, Vol. 1156, No. 1, 2009, pp. 168-197. doi:10.1111/j.1749-6632.2009.04416.x
- M. S. Buchsbaum, J. C. Gillin, J. Wu, E. Hazlett, N. Sicotte, R. M. Dupont, et al., “Regional Cerebral Glucose Metabolic Rate in Human Sleep Assessed by Positron Emission Tomography,” Life Sciences, Vol. 45, No. 15, 1989, pp. 1349-1356. doi:10.1016/0024-3205(89)90021-0
- P. Maquet, “Functional Neuroimaging of Normal Human Sleep by Positron Emission Tomography,” Journal of Sleep Research, Vol. 9, No. 3, 2000, pp. 207-231.
- E. Bixler, “Sleep and Society: An Epidemiological Perspective,” Sleep Medicine, Vol. 10, No. Supplement 1, 2009, pp. S3-S6. doi:10.1016/j.sleep.2009.07.005
- Y. Takahashi, D. M. Kipnis and W. H. Daughaday, “Growth Hormone Secretion during Sleep,” The Journal of Clinical Investigation, Vol. 47, No. 9, 1968, pp. 2079- 2090. doi:10.1172/JCI105893
- P. A. Bryant, J. Trinder and N. Curtis, “Sick and Tired: Does Sleep Have a Vital Role in the Immune System?” Nature Reviews Immunology, Vol. 4, No. 6, 2004, pp. 457-467. doi:10.1038/nri1369
- K. Spiegel R. Leproult and E. Van Cauter, “Impact of Sleep Debt on Metabolic and Endocrine Function,” Lancet, Vol. 354, No. 9188, 1999, pp. 1435-1439. doi:10.1016/S0140-6736(99)01376-8
- M. Ferrara and L. De Gennaro, “How Much Sleep Do We Need?” Sleep Medicine Reviews, Vol. 5, No. 2, 2001, pp. 155-179. doi:10.1053/smrv.2000.0138
- H. P. A. Van Dongen, N. L. Rogers and D. F. Dinges, “Sleep Debt: Theoretical and Empirical Issues,” Sleep and Biological Rhythms, Vol. 1, No. 1, 2003, pp. 5-13. doi:10.1046/j.1446-9235.2003.00006.x
- J. Fernandez-Mendoza, S. Calhoun, E. O. Bixler, S. Pejovic, M. Karataraki, D. Liao, et al., “Insomnia with Objective Short Sleep Duration Is Associated with Deficits in Neuropsychological Performance: A General Population Study,” Sleep, Vol. 33, No. 4, 2010, pp. 459-465.
- J. E. Gangwisch, S. B. Heymsfield, B. Boden-Albala, R. M. Buijs, F. Kreier, T. G. Pickering, et al., “Short Sleep Duration as a Risk Factor for Hypertension: Analyses of the First National Health and Nutrition Examination Survey,” Hypertension, Vol. 47, No. 5, 2006, pp. 833-839. doi:10.1161/01.HYP.0000217362.34748.e0
- C. Hublin, M. Partinen, M. Koskenvuo and J. Kaprio, “Sleep and Mortality: A Population-Based 22-Year Follow-Up Study,” Sleep, Vol. 30, No. 10), 2007, pp. 1245-53.
- J. R. Jennings, M. F. Muldoon, M. Hall, D. J. Buysse and S. B. Manuck, “Self-Reported Sleep Quality Is Associated with the Metabolic Syndrome,” Sleep, Vol. 30, No. 2, 2007, pp. 219-223.
- D. F. Kripke, L. Garfinkel, D. L. Wingard, M. R. Klauber and M. R. Marler, “Mortality Associated with Sleep Duration and Insomnia,” Archives of General Psychiatry, Vol. 59, No. 2, 2002, pp. 131-136. doi:10.1001/archpsyc.59.2.131
- S. R. Patel, “Social and Demographic Factors Related to Sleep Duration,” Sleep, Vol. 30, No. 9, 2007, pp. 1077- 1078.
- S. R. Patel, A. Malhotra, D. J. Gottlieb, D. P. White and F. B. Hu, “Correlates of Long Sleep Duration,” Sleep, Vol. 29, No. 7, 2006, pp. 881-889.
- C. Sabanayagam and A. Shankar, “Sleep Duration and Hypercholesterolaemia: Results from the National Health Interview Survey 2008,” Sleep Medicine, Vol. 13, No. 2, 2012, pp. 145-150. doi:10.1016/j.sleep.2011.07.017
- C. M. Morin, S. Rodrigue and H. Ivers, “Role of Stress, Arousal, and Coping Skills in Primary Insomnia,” Psychosomatic Medicine, Vol. 65, No. 2, 2003, pp. 259-267. doi:10.1097/01.PSY.0000030391.09558.A3
- S. J. Linton, “Does Work Stress Predict Insomnia? A Prospective Study,” British Journal of Health Psychology, Vol. 9, No. 2, 2004, pp. 127-136. doi:10.1348/135910704773891005
- E. S. Healey, A. Kales, L. J. Monroe, E. O. Bixler, K. Chamberlin and C. R. Soldatos, “Onset of Insomnia: Role of Life-Stress Events,” Psychosomatic Medicine, Vol. 43, No. 5, 1981, pp. 439-451.
- D. Foley, S. Ancoli-Israel, P. Britz and J. Walsh, “Sleep Disturbances and Chronic Disease in Older Adults: Results of the 2003 National Sleep Foundation Sleep in America Survey,” Journal of Psychosomatic Research, Vol. 56, No. 5, 2004, pp. 497-502. doi:10.1016/j.jpsychores.2004.02.010
- M. Manocchia, S. Keller and J. Ware, “Sleep Problems, Health-Related Quality of Life, Work Functioning and Health Care Utilization among the Chronically ILL,” Quality of Life Research, Vol. 10, No. 4, 2001, pp. 331- 345. doi:10.1023/A:1012299519637
- P. D. Penev, “Update on Energy Homeostasis and Insufficient Sleep,” Journal of Clinical Endocrinology & Metabolism, Vol. 97, No. 6, 2012, pp. 1792-1801. doi:10.1210/jc.2012-1067
- CDC, “2008 NHIS Survey Description,” Centers for Disease Control and Prevention, U.S. Department of Health and Human Services, Hyattsville, 2009.
- CDC, “2009 NHIS Survey Description,” Centers for Disease Control and Prevention, U.S. Department of Health and Human Services, Hyattsville, 2010.
- CDC, “2010 NHIS Survey Description,” Centers for Disease Control and Prevention, U.S. Department of Health and Human Services, Hyattsville, 2011.
- CDC, “1997 NHIS Survey Description,” Centers for Disease Control and Prevention, U.S. Department of Health and Human Services, Hyattsville, 2000.
- CDC, “1998 NHIS Survey Description,” Centers for Disease Control and Prevention, U.S. Department of Health and Human Services, Hyattsville, 2000.
- R. C. Kessler, G. Andrews, L. J. Colpe, E. Hiripi, D. K. Mroczek, S. L. Normand, et al., “Short Screening Scales to Monitor Population Prevalences and Trends in NonPecific Psychological Distress,” Psychological Medicine, Vol. 32, No. 6, 2002, pp. 959-976. doi:10.1017/S0033291702006074
- T. A. Furukawa, R. C. Kessler, T. Slade and G. Andrews, “The Performance of the K6 and K10 Screening Scales for Psychological Distress in the Australian National Survey of Mental Health and Well-Being,” Psychological Medicine, Vol. 33, No. 2, 2003, pp. 357-362. doi:10.1017/S0033291702006700
- R. C. Kessler P. R. Barker L. J. Colpe J. F. Epstein, J. C. Gfroerer, E. Hiripi, et al., “Screening for Serious Mental Illness in the General Population,” Archives of General Psychiatry, Vol. 60, No. 2, 2003, pp. 184-189. doi:10.1001/archpsyc.60.2.184
- L. D. Wilkin, A. Cheryl and B. L. Haddock, “Energy Expenditure Comparison between Walking and Running in Average Fitness Individuals,” The Journal of Strength & Conditioning Research, Vol. 26, No. 4, 2012, pp. 1039- 1044. doi:10.1519/JSC.0b013e31822e592c
- D. E. R. Warburton, C. W. Nicol and S. S. D. Bredin, “Health Benefits of Physical Activity: The Evidence,” Canadian Medical Association Journal, Vol. 174, No. 6, 2006, pp. 801-809. doi:10.1503/cmaj.051351
- L. Klingenberg, A. Sjödin, U. Holmbäck, A. Astrup and J. P. Chaput, “Short Sleep Duration and Its Association with Energy Metabolism,” Obesity Reviews, Vol. 13, No. 7, 2012, pp. 565-577.
- C. M. Jung, E. L. Melanson, E. J. Frydendall, L. Perreault, R. H. Eckel and K. P. Wright, “Energy Expenditure during Sleep, Sleep Deprivation and Sleep Following Sleep Deprivation in Adult Humans,” The Journal of Physiology, Vol. 589, No. 1, 2011, pp. 235-244. doi:10.1113/jphysiol.2010.197517
- M. H. Bonnet and D. L. Arand, “Insomnia, Metabolic Rate and Sleep Restoration,” Journal of Internal Medicine, Vol. 254, No. 1, 2003, pp. 23-31. doi:10.1046/j.1365-2796.2003.01176.x
- K. Spiegel, E. Tasali, P. Penev and E. Van Cauter, “Brief Communication: Sleep Curtailment in Healthy Young Men Is Associated with Decreased Leptin Levels, Elevated Ghrelin Levels, and Increased Hunger and Appetite,” Annals of Internal Medicine, Vol. 141, No. 11, 2004, pp. 846-850.
- A. V. Nedeltcheva, J. M. Kilkus, J. Imperial, K. Kasza, D. A. Schoeller and P. D. Penev, “Sleep Curtailment Is Accompanied by Increased Intake of Calories from Snacks,” The American Journal of Clinical Nutrition, Vol. 89, No. 1, 2009, pp. 126-133. doi:10.3945/ajcn.2008.26574
- L. Brondel, M. A. Romer, P. M. Nougues, P. Touyarou, and D. Davenne, “Acute Partial Sleep Deprivation Increases Food Intake in Healthy Men,” The American Journal of Clinical Nutrition, Vol. 91, No. 6, 2010, pp. 1550- 1559. doi:10.3945/ajcn.2009.28523
- C. A. Everson and A. Szabo, “Recurrent Restriction of Sleep and Inadequate Recuperation Induce both Adaptive Changes and Pathological Outcomes,” American Journal of Physiology—Regulatory, Integrative and Comparative Physiology, Vol. 297, No. 5, 2009, pp. R1430-R1440. doi:10.1152/ajpregu.00230.2009
- A. M. Caron and R. Stephenson, “Energy Expenditure Is Affected by Rate of Accumulation of Sleep Deficit in Rats,” Sleep, Vol. 33, No. 9, 2010, pp. 1226-1235.
NOTES
*Corresponding author.