Open Journal of Nephrology
Vol. 2 No. 4 (2012) , Article ID: 25559 , 4 pages DOI:10.4236/ojneph.2012.24018
Central Obesity and Comorbidity Risk in Hemodialysis Patients: A Cross Sectional Study in Lebanon
1Faculty of Public Health, Branch 5, Lebanese University, Saida, Lebanon
2Faculty of Economic Sciences and Business Administration, Branch 5, Lebanese University, Nabatieh, Lebanon
3Doctoral School of Literature, Humanities & Social Sciences, Lebanese University, Beyrouth, Lebanon 4Institute of Social Science, Branch 5, Lebanese University, Saida, Lebanon
Email: *nsdroubi@inco.com.lb
Received September 11, 2012; revised October 24, 2012; accepted November 10, 2012
Keywords: Anthropometric; Obesity; Conicity Index; Body Mass Index; Comorbidity; Hemodialysis
ABSTRACT
Introduction: Abdominal deposition of fat has been described as the type of obesity that offers the greatest risk for the health of individuals, and is associated with increased mortality, and morbidity. Conicity index (Ci), Body mass index (BMI), and waist hip ratio (WHR) are used to predict the risk of obesity related diseases. However, it has not been examined whether these indicators can predict the comorbidities in hemodialysis subjects in Lebanon. Objective: to determine the effect of central obesity on comorbidities in hemodialysis patients in Lebanon. Material and Method: This is a cross-sectional study of obesity in 60 hemodialysis subjects in Lebanon. A linear regression analysis was used to determine the relationship between BMI, Ci, WHR, and comorbidities measured by Charlson (CCI) and Davies comorbidities indexes. Results: Ci values were significantly associated with age, and CCI; the abdominal fat deposition evaluated by the conicity index and WHR were a predictor of the comorbidities according to CCI (b = 2.96; p = 0.01), and Davies comorbidity index (b = 1.19; p = 0.05) scores. BMI was a weak predictor of comorbidity. Conclusion: Abdominal obesity by using simple anthropometric measurements, e.g., Ci and WHR values can similarly predict the presence of comorbidities in hemodialysis patients. Maintaining appropriate Ci and WHR values might be important to improve outcome in hemodialysis patients.
1. Introduction
Obesity is a major public health problem. Being obese and overweight is associated with substantial increased risks of mortality and morbidity. Obesity and related noncommunicable diseases [1] are recognized as imposing a major burden on health systems. Increased health care costs, activity limitations, and reduced productivity [2] are also associated with a relevant impairment of health related quality of life [3].
The most widely used anthropometric measure of obesity is body mass index (BMI) and it has been applied into both public health and clinical practice. However, BMI does not consider the distribution of body fat. Other measures which are being increasingly used are waist circumference (WC) [1,4,5], waist-hip circumference ratio (WHR) [6] and conicity index (Ci) [7,8]. The Ci estimates fat accumulation in the abdomen which leads to a deviation of body shape from a cylindrical to a double-cone shape, i.e., two cones with a common base at the waist level [7,8] (Figure 1). This abnormal deposition of fat in the abdomen has been described as the type of obesity that greatly threatens the individual’s health leading to metabolic derangements, coronary disease [1,7,9,10],
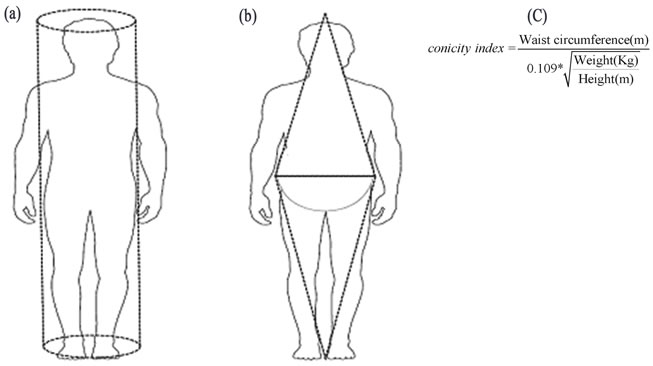
Figure 1. Theoretical description of the concept of conicity index (Ci). Ci models the accumulation of fat in the abdominal area as progression of the body from a cylindrical (a) to a biconical shape (b). This anthropometric estimate is derived (c) from the waist circumference, the weight and the height [7] (figure printed with permission of Oxford University Press; License number: 2752000049072).
increased mortality [4,7,10,11].
In the case of chronic kidney disease patients (CKD), it has been hypothesized that overweight (25.0 ≤ BMI < 29.9 kg/m2) is a sign of a healthy and a better nutritional status [7]. The most frequent nutrition disorder of CKD patients is now excessive obesity instead of weight loss. However, WC may be a better predictor of mortality than BMI in adults with CKD [11]. Abdominal fat has been associated with inflammation, insulin resistance, hyperadipokinaemia, dyslipidaemia, and oxidative stress [7], each of which may predict malnutrition, increased mortality, and the development of protein-energy wasting [7, 12,13].
Hemodialysis is the most common treatment for endstage renal disease (ESRD). It is a medical procedure designed to remove wastes, toxins and fluids from the blood when the kidneys have failed. The blood is cleaned by a part of the hemodialysis machine known as an artificial kidney or dialyzer.
In Lebanon, no study, so far, has been conducted to assess the central obesity of hemodialysis population. The present study aims 1) to describe the prevalence of the central obesity in hemodialysis patients; and 2) investigate the relationship between obesity assessed by the anthropometrics variables as Ci, and WHR and morbidity amongst hemodialysis patients in Lebanon.
In view of the different associations between abdominal fat and myocardial infarction and/or early death according to gender [1,11], men and women were analyzed separately. In addition, the analysis was conducted according to habitat location because living in urban area may influence obesity particularly in low and middle revenu countries [1,8,14-16].
2. Materials and Methods
2.1. Study Design
This was a cross-sectional study. Recruitment of the patients occurred from May to December 2010 in a hemodialysis center at a general hospital in south Lebanon. Out of the 65 prevalent patients recruited for the original study, 60 (92.3%) individuals were studied.
2.2. Data Collection
Informed consent was obtained from all patients. The interviewer conducted a standardized, structured interview using a pre-tested questionnaire to collect information on demographics, socio-economic status (e.g. age, gender, education level, marital status, occupation), habitat location, financial status (a measure of financial status rated from 1, very poor, to 5, very good [16]. Other variables recorded were the global quality of life assessment (QoL), and Health status rated from 1 (very poor) to 5 (very good).
Each patient’s medical chart was reviewed, and data on smoking, alcohol, consanguinity, first dialysis, etiology, comorbidities, and results of the laboratory analysis extracted. Dosages of total albumin, hematocrit, Phosphorus, Potassium, triglycerides, Urea Reduction Ratio (URR%) [17] were done.
2.3. Comorbidity Scores
Comorbidity was scored for both the Charlson (CCI) and Davies comorbidity index. One person collected data and scored all patients. Scoring involved the review of history, of the physical and medical records.
The CCI assigns: 1 point for a history of myocardial infarction, congestive heart failure, peripheral vascular disease, cerebrovascular disease (transient ischemic attack or cerebrovascular accident with minor or no residue), dementia, chronic pulmonary disease, connective tissue disorder, peptic ulcer disease, mild liver disease, and diabetes without end organ damage; 2 points are assigned for hemiplegia, moderate to severe renal disease, diabetes with end organ damage, tumor without metastases, leukemia, lymphoma, and myeloma; 3 points are assigned for moderate or severe liver disease; and 6 points are assigned for metastatic solid tumor or AIDS. For every decade over 40 years of age, 1 point is added to the score. For a patient on dialysis, the minimum Charlson score is 2.
The Davies score assigns 1 point for each of the following conditions: ischemic heart disease (prior myocardial infarction, angina, or ischemic changes on EKG), left ventricular dysfunction (clinical evidence of pulmonary edema not due to errors in fluid balance, or history of congestive heart failure), peripheral vascular disease (includes distal aortic, lower extremity, and cerebrovascular disease), malignancy, diabetes, collagen vascular disease, and other significant pathology (e.g., chronic obstructive pulmonary disease).
The CCI and Davies scores were categorized into 4 levels: 2 - 3, 4 - 5, 6 - 7, >7 for CCI; and 0, 1, 2, and >2 for Davies [18-21].
2.4. Anthropometric Measurements
Anthropometric measurements such as height, weight, waist and hip circumference were recorded. Subjects were measured wearing minimal clothes.
A flexible plastic tape was used to measure WC, accurate up to the nearest 0.1 cm. The waist was measured in the middle distance between the last floating rib and the iliac crest, whereas the hips were measured with the measuring tape passing on femoral trochanters of each circumference.
Weight and height were measured in the dialysis Center by the nursing team [1]. Height was measured to the nearest 0.1 cm with a height stand. The subject stood without shoes or head gear (cap, ribbon etc.) in an upright posture. The crown of the head was horizontal during measurement. Weight was measured using a scale accurate to 0.5 kg and the weighting scale was set to zero before every measurement [8].
BMI was calculated as weight (kg) divided by height (m) squared, and recorded in four categories according to the World Health Organization: <18.5 kg/m2, underweight; BMI ≥ 18.5 to < 25 kg/m2, normal weight; BMI ≥ 25 to < 30 kg/m2, overweight; BMI ≥ 30 kg/m2, obese.
Two measures of body fat distribution i.e., WHR and Ci were done. WHR is determined through the division of the waist circumference by the hip circumference [6]. The Ci is determined through the measurements of weight, height and WC, by using the mathematical equation:
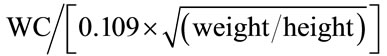
[1,7,8]. Thus, patients with an elevated Ci are those with an abnormal fat deposition in the abdominal region with respect to their height and weight [7]. The Ci reflects how many times the WC of such a person is bigger than the estimated circumference of a cylinder generated with the height and the weight of that individual [7,8]. As an example, a Ci of 1.50 means that the individual’s WC is 1.50 times bigger than the circumference of a hypothetical cylinder based on the height and weight of that individual [7,8]. The tertiles of Ci distribution were assessed to classify patients into three categories: Low Ci, Middle Ci, and High Ci [7].
2.5. Statistical Analysis
The Continuous variables were expressed as mean ± standard deviation (SD), median, and quartiles as appropriate. The categorical variables are expressed as percentage.
The ANOVA test was used to compare differences in mean for continuous variables. For nominal variables, we used the χ2 test. Linear regression analyses were performed to estimate the association between anthropometric measures of obesity (Ci, BMI, and WHR), and Charlson, and Davies comorbidities indexes scores [22,23].
A p-value < 0.01 was considered to be significant because of multiple testing. Analyses were performed using the Statistical Package for Social Sciences (SPSS) version 16.0.
3. Results
3.1. Characteristics of the Study Subjects
Table 1 describes the characteristics of the study subjects according to habitat location, and gender. 51.7% were women, 36.7% patients live in urban area. The mean of age was 57.5 years (SD = 16.7 years) and was lower in rural (52.8 ± 16.1) when compared with urban areas (65.5 ± 14.7, p = 0.004).
The mean number of person in house is 4.03 (SD = 2.2; range 1 to 10). A minority (5.0%) of patients lives alone. The percentage of men with a formal job was much higher than that of women (41.4% vs. 6.1%, p < 0.01). Only 6.7% of patients perceived their financial status as poor; 13.4% considered their health status as very bad. The proportion of current smokers was significantly greater among men (31.0%) than women (17.1%, p < 0.01). 10% are current drinkers of alcohol. Consanguinity is observed in 36.7% of cases: First degree 68.20%, second 18.2%. The mean of dialysis vintage is 37.2 months (SD = 53.8). Diabetes (30.0%) and nephrosclerosis (26.7%) are the most prevalent etiology. Most (80.0%) of patients have at least one comorbidity. The CCI and Davies comorbidity index scores were very severe for 15.0%, and 16.7% of patients respectively (>7 for CCI; and >2 for Davies) (Table 1).
3.2. Relationship between Tertiles of Abdominal Fat Deposition (Ci) and Demographics and Clinical Characteristics
Tables 2 and 3 show the relationship between tertiles of abdominal fat deposition (Ci) and demographics and clinical characteristics. Patients were divided into groups according to tertiles of Ci distribution: Low Ci (1.04 - 1.36), Middle Ci (1.37 - 1.50), and High Ci (1.51 - 2.31). 24.6% of patients have central obesity (high tertile of Ci). 28.1% of patients were overweight (BMI 25 - 30 kg/m2), and 17.5% were obese (BMI ³ 30 kg/m2).
The Ci was positively associated with age (p = 0.02), CCI (p < 0.01) and, albumin concentration (p = 0.04). There was no association between the Ci and Davies comorbidity index, dialysis vintage or plasma triglycerides concentration. Across Ci tertiles, an increase in BMI (mainly accounted for by fat body mass) was not observed (Table 2).
3.3. Predictors of Comorbidities
Table 4 displays the beta interpreted as odds ratios (ORs) for linear regression with CCI, and Davies comorbidity indexes scores as the dependent variables, and Ci, BMI, and WHR as the measure of obesity. The results show that central obesity measured by Ci, WHR was a predictor of comorbidities in hemodialysis patients.
4. Discussion
The present study suggests that Ci, and WHR, values were useful indicators to identify the presence, though unequal, of multiple comorbidities in hemodialysis subjects.
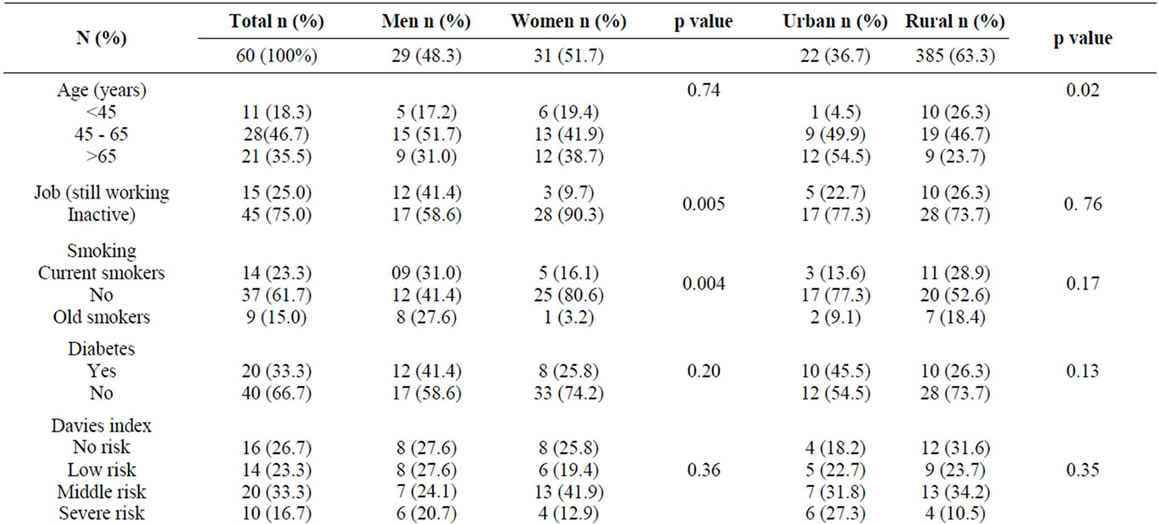
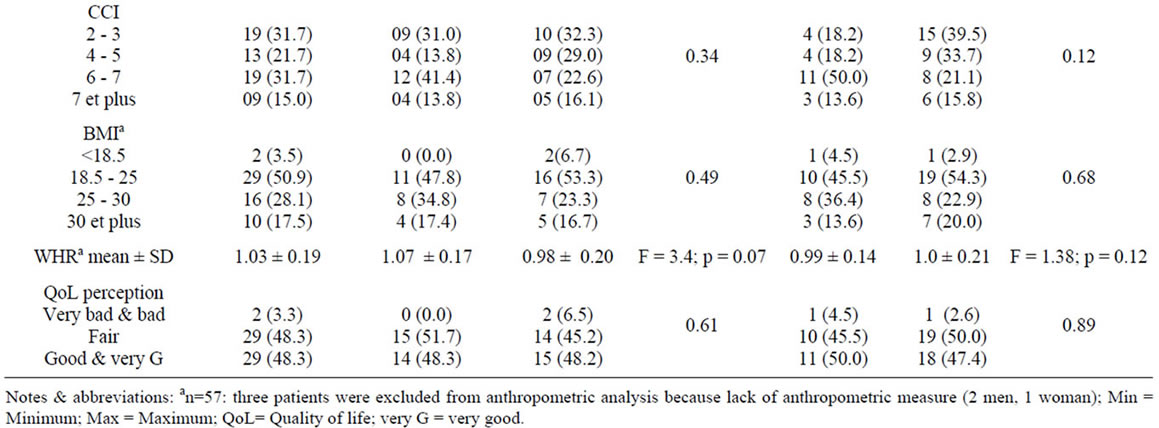
Table 1. Patient’s characteristics according to gender and environment.
The Ci estimates abdominal obesity by using simple anthropometric measurements (WC, height and weight) to model the body as two cones with the base at the waist level [7]. The Ci tertiles of our population was comparable to those reported by Codeiro and al [7]. As in other studies, patients with an increased Ci tended to be older [7,24], married persons [8], and had more comorbidities [7].
The present study shows the ability of the Ci, and WHR to identify hemodialysis patients with high comorbities using Charlson and Davies indexes. Charlson comorbidities scores is also considered a significant predictor for mortality, and should be done at the start of dialysis [19].
The BMI was found to be a weak predictor of comorbidity. Indeed, an increase in Ci in the presence of a normal BMI is observed. Several studies indicate that measures of central obesity are better discriminators of morbidity compared with BMI [1,11]. As opposed to BMI, which does not differentiate between muscle and fat, the Ci may be a useful tool to identify individuals with abdominal obesity, but who are not necessarily obese or overweight [7,11].
Several studies have shown the relationship between abdominal adiposity and cardiovascular [10], metabolic risk factors [5,7,9,10], vascular disease [9], insulin resistance [24], high blood pressure [6], inflammation and, protein-energy wasting [7], as well as mortality [4,7,10]. Waist circumference measures have been considered a better index of visceral adipose tissue and was advocated as a “supplemental vital sign” for every patient [5]. In our study, we used the CCI which is an index composite of the afore mentioned comorbidities [18-21].
No relationship is observed between rurality and the Ci. This result is similar to that observed for the obesity, most morbidities [25], and for different dimensions of
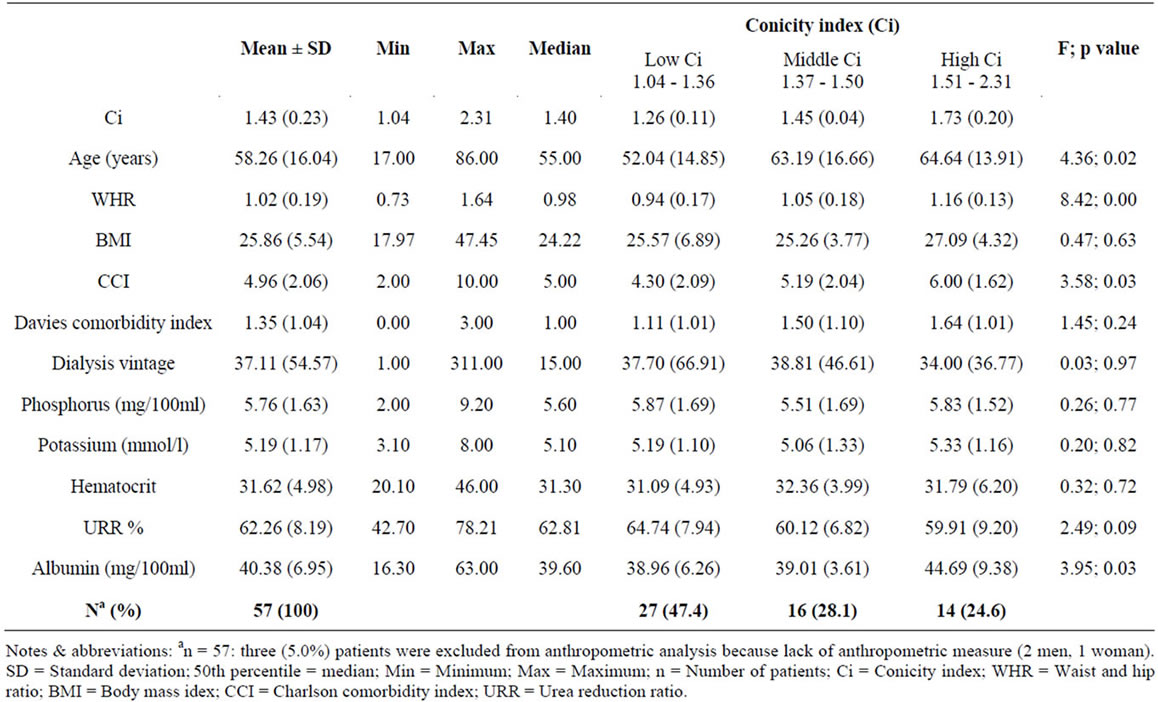
Table 2. Demographics and clinical characteristics of hemodialysis patients according to tertiles of abdominal fat deposition evaluated by the conicity index (Ci): one way ANOVA test.
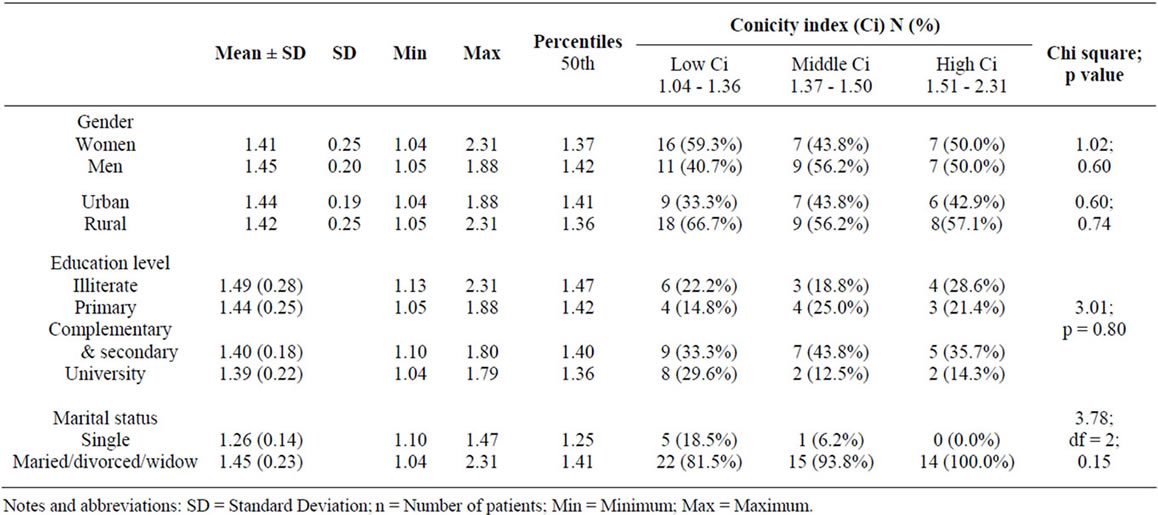
Table 3. Abdominal fat deposition evaluated by the Conicity index (Ci) according to demographics characteristics of haemodialysis patients: Chi square test.
quality of life in south Lebanon [16].
There is a shortage of data about the Ci of hemodialysis patient in Lebanon, and this cross-sectional study is a first attempt to relate Ci to comorbidity. By means of the Ci, a simple estimate derived from easily available measures of height, weight and WC, dialysis patients with an especially high mortality risk can be identified [7].
Our study has some limitations. The sample size is small, and fluid status may have influenced estimate of
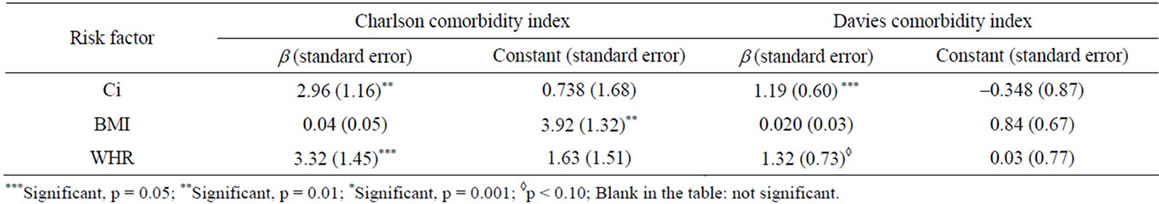
Table 4. Linear regression results between anthropometric measures of obesity (Ci, BMI, and WHR), and Charlson and Davies comorbidities indexes scores.
body weight [7].
5. Conclusions
In conclusion, anthropometry is a simple, inexpensive, and non-invasive method available to assess the size, proportion, and composition of the human body [1,7,8, 11,26], and is useful to predict comorbidity in hemodialysis patients.
Maintaining appropriate Ci and WHR values (e.g. by lifestyle modification including diet and exercise) might be an important instruction to improve outcome in hemodialysis patients.
REFERENCES
- F. J. G. Pitanga and I. Lessa, “Anthropometric Indexes of Obesity as an Instrument of Screening for High Coronary Risk in Adults in the City of Salvador—Bahia,” Arquivos Brasileiros de Cardiologia, Vol. 85, No. 1, 2005, pp. 26-31. http://www.scielo.br/pdf/abc/v85n1/en_a06v85n1.pdf
- D. A. Webb, J. M. Robbins, J. R. Bloch and J. F. Culhane, “Estimating Prevalence of Overweight and Obesity at the Neighborhood Level: The Value of Maternal Height and Weight Data Available on Birth Certificate Records,” Population Health Metrics, Vol. 8, No. 1, 2010, p. 16. http://www.pophealthmetrics.com/content/8/1/16
- E. Mannucci, M. L. Petroni, N. Villanova, et al., “Clinical and Psychological Correlates of Health-Related Quality of Life in Obese Patients,” Health and Quality of Life Outcomes, Vol. 8, 2010, p. 90 http://www.hqlo.com/content/8/1/90
- S. Hermann, S. Rohrmann, J. Linseisen, et al., “The Association of Education with Body Mass Index and Waist Circumference in the EPIC-PANACEA Study,” BMC Public Health, Vol. 11, No. 1, 2011, pp. 1-12. http://www.biomedcentral.com/1471-2458/11/169
- R. Cherqaoui, T. A. Kassim, J. Kwagyan, C. Freeman, G. Nunlee-Bland, M. Ketete, S. Xu and O. S. Randall, “The Metabolically Healthy but Obese Phenotype in African Americans,” The Journal of Clinical Hypertension, Vol. 14, No. 2, 2012, pp. 92-96. doi:10.1111/j.1751-7176.2011.00565.x
- K. Kaur and R. Mogra, “Association of Body Mass Index, Body Fat and Hypertension among Postmenopausal Women,” Journal of Human Ecology, Vol. 20, No. 3, 2006, pp. 171-175. http://www.krepublishers.com/02-Journals/JHE/JHE-20-0-000-000-2006-Web/JHE-20-3-000-000-2006-Abstract-PDF/JHE-20-3-171-175-2006-1442-Kaur-K/JHE-20-3-171-175-2006-1442-Kaur-K-Text.pdf
- A. C. Cordeiro, A. R. Qureshi, P. Stenvinkel, et al., “Abdominal Fat Deposition Is Associated with Increased Inflammation, Protein-Energy Wasting and Worse Outcome in Patients Undergoing Haemodialysis,” Nephrology Dialysis Transplantation, Vol. 25, No. 2, 2010, pp. 562-568. doi:10.1093/ndt/gfp492
- M. S. Flora, C. G. N. Mascie-Taylor and M. Rahman, “Conicity Index of Adult Bangladeshi Population and Their Socio-Demographic Characteristics,” Ibrahim Medical College Journal, Vol. 3, No. 1, 2009, pp. 1-8. http://www.banglajol.info/index.php/IMCJ/article/viewArticle/2910
- A. M. Hodge, L. Maple-Brown, J. Cunningham, J. Boyle, T. Dunbar, T. Weeramanthri, J. Shaw and K. O’Dea, “Abdominal Obesity and Other Risk Factors Largely Explain the High CRP in Indigenous Australians Relative to the General Population, But Not Gender Differences: A Cross-Sectional Study,” BMC Public Health, Vol. 10, No. 1, 2010, p. 700. http://www.biomedcentral.com/1471-2458/10/700
- Y. Liu, G. Tong, W. Tong, L. Lu and X. Qin, “Can Body Mass Index, Waist Circumference, Waist-Hip Ratio and Waist-Height Ratio Predict the Presence of Multiple Metabolic Risk Factors in Chinese Subjects?” BMC Public Health, Vol. 11, No. 35, 2011, pp. 1-10. http://www.biomedcentral.com/1471-2458/11/35
- C. Zoccali, S. M. Seck and F. Mallamaci, “Obesity and the Epidemiology and Prevention of Kidney Disease: Waist Circumference versus Body Mass Index,” American Journal of Kidney Diseases, Vol. 58, No. 2, 2011, pp. 177-185. doi:10.1053/j.ajkd.2011.05.009 http://download.journals.elsevierhealth.com/pdfs/journals/0272-6386/PIIS0272638611006998.pdf
- R. de Moutsert, D. C. Grootendorst, J. Axelsson, E. W. Boeschoten, R. T. Krediet, F. W. Dekker and NECOSAD Study Group, “Excess Mortality Due to Interaction between Protein Energy Wasting, Inflammation and Cardiovascular Disease in Chronic Dialysis Patients,” Nephrology Dialysis Transplantation, Vol. 23, No. 9, 2008, pp. 2957-2964. doi:10.1093/ndt/gfn167
- R. Pellicano, B. J. Strauss, K. R. Polkinghorne and P. G. Kerr, “Body Composition in Home Haemodialysis versus Conventional Haemodialysis: A Cross-Sectional, Matched, Comparative Study,” Nephrology Dialysis Transplantation, Vol. 25, No. 2, 2010, pp. 568-573. doi:10.1093/ndt/gfp490
- S. Yusuf, S. Reddy, S. Ounupuu and S. Anand, “Global Burden of Cardiovascular Diseases. Part I: General Considerations, the Epidemiologic Transition, Risk Factors and Impact of Urbanization,” Circulation, Vol. 104, No. 22, 2001, pp. 2746-2753. doi:10.1161/hc4601.099487
- C. Arambepola1, S. Allender, R. Ekanayake and D. Fernando, “Urban Living and Obesity: Is It Independent of Its Population and Lifestyle Characteristics?” Tropical Medicine and International Health, Vol. 13, No. 4, 2008, pp. 448-457. doi:10.1111/j.1365-3156.2008.02021.x
- I. Sabbah, N. Drouby, S. Sabbah, N. Retel-Rude and M. Mercier, “Quality of Life in rural and urban populations in Lebanon Using SF-36 Health Survey,” Health and Quality of Life Outcomes, Vol. 1, 2003, p. 30. http://www.hqlo.com/content/1/1/30
- R. A. Sherman and R. Hootkins, “Simplified Formula and Normograms for Monitoring hemodialysis Adequacy,” In: A. R. Nissensson and R. N. Fine, Eds., Handbook of Dialysis Therapy, 4th Edition, Saunders Elsevier, Philadelphia, 2008, pp. 310-318. doi:10.1016/B978-1-4160-4197-9.50024-7
- B. T. Bikbov and N. A. Tomilina, “Letters and Replies: Some Notes about the Usage of the Charlson Comorbidity Index,” Nephrology Dialysis Transplantation, Vol. 19, No. 11, 2004, pp. 2926-2927. doi:10.1093/ndt/gfh463
- L. Fried, J. Bernardini and B. Piraino, “Comparison of the Charlson Comorbidity Index and the Davies Score as a Predictor of Outcomes in PD Patients,” Peritoneal Dialysis International, Vol. 23, No. 6, 2003, pp. 568-573. www.pdiconnect.com
- J. C. McGregor, P. W. Kim, E. N. Perencevich, D. D. Bradham, J. P. Furuno, K. S. Kaye, J. C. Fink, P. Langenberg, M.-C. Roghmann and A. D. Harris, “Utility of the Chronic Disease Score and Charlson Comorbidity Index as Comorbidity Measures for Use in Epidemiologic Studies of Antibiotic-Resistant Organisms,” American Journal of Epidemiology, Vol. 161, No. 5, 2005, pp. 483-493. doi:10.1093/aje/kwi068 http://aje.oxfordjournals.org/content/161/5/483.full.pdf+html?sid=4b1ea8f0-b988-4c57-974a-75de648c5424
- L. F. Morrone, S. Mazzaferro, D. Russo, F. Aucella, M. Cozzolino, M. G. Facchini, A. Galfre, F. Malberti, M. C. Mareu, M. Nordio, G. Pertosa, D. Santoro and CPCP Study Investigators, “Interaction between Parathyroid Hormone and the Charlson Comorbidity Index on Survival of Incident Haemodialysis Patients,” Nephrology Dialysis Transplantation, Vol. 24, No. 9, 2009, pp. 2859-2865. doi:10.1093/ndt/gfp170
- T. Ancelle, “Statistique Epidemiologie,” 2nd Edition, Maloine, Paris, 2008.
- P. Czenrnichow, J. Chaperon and X. Le Coutour, “Epidemiologie Abreges Connaissances et Pratique,” Masson, Paris, 2001.
- A. Zadeh-Vakili, F. R. Tehrani and F. Hosseinpanah, “Waist circumference and Insulin Resistance: A Community Based cross Sectional Study on Reproductive Aged Iranian Women,” Diabetology & Metabolic Syndrome, Vol. 3, No. 18, 2011, p. 6. http://www.dmsjournal.com/content/3/1/18
- I. Sabbah, D.-A. Vuitton, N. Droubi, S. Sabbah and M. Mercier, “Morbidity and Associated Factors in Rural and Urban Populations of South Lebanon: A Cross-Sectional Community-Based Study of Self-Reported Health in 2000,” Tropical Medicine and International Health, Vol. 12, No. 8, 2007, pp. 907-919. doi:10.1111/j.1365-3156.2007.01886.x
- K/DOQITM, “Nutrition Work Group Membership,” American Journal of Kidney Diseases, Vol. 35, Suppl. 2, 2000, pp. S1-S3.
NOTES
*Corresponding author.