World Journal of Cardiovascular Diseases
Vol.2 No.2(2012), Article ID:18749,8 pages DOI:10.4236/wjcd.2012.22017
How many systolic and diastolic variables must be measured in elderly patients with symptoms of heart failure?*
![]()
1Department of Medicine-Geriatric, Institution of Public Health and Clinical Medicine, Umeå University, Umeå, Sweden
2Department of Epidemiology, Umeå University, Umeå, Sweden
Email: jan.remmets@telia.com
Received 19 December 2011; revised 10 February 2012; accepted 20 February 2012
Keywords: Echocardiography; Systole; Diastole; Elderly; Primary Health Care
ABSTRACT
Objectives: To explore the concordance and the feasibility of obtaining systolic or diastolic variables of left ventricular function in elderly patients with heart failure symptoms. Methods: One hundred twenty four patients with symptoms of heart failure (mean age 77 years, 70% females) were included in a crosssectional, explorative study. Nineteen echocardiographic variables (7 systolic and 12 diastolic) were measured. Results: Overall, feasibility ranged from 93% to 100% for 15 variables and was 48% for mitral regurgitation dp/dt(MRdp/dt), 66% for the difference between pulmonary AR-dur and mitral A-dur, 81% for the ratio between early and late mitral inflow velocity (E/A), and 76% for tissue Doppler imaging late diastolic velocity (TDI A’). Concordance was very good/ good in 83% and poor/missing in 17% of systolic variables, whereas it was very good/good for 67% of diastolic variables and poor/missing for 33%. Factor analysis reduced systolic variables to two factors that explained 69% of the total variance in systolic function. Conclusions: Low feasibility for some and questionable concordance of especially diastolic variables questions the rationale for routinely measuring a high number of echocardigraphic variables. The results of the factor analysis further strengthen the possibility of reducing the number of measured variables. The clinical value of such a reduction needs to be validated.
1. INTRODUCTION
The clinical diagnosis of heart failure (HF) is often difficult and misleading [1]. An evaluation of left ventricular (LV) function is needed, usually by echocardiography (Echo) [2]. In elderly patients, it may be more difficult to obtain Echo variables due to anatomic considerations and co-morbidities. The number of LV function measurements has increased significantly, including both established and newer variables [3], resulting in an expanded Echo examination that is more costly and time consuming. The question as to whether all old and new variables must be analysed is seldom examined and there is a lack of knowledge on the feasibility of obtaining all proposed variables. Secondly, to our knowledge there are no studies on the concordance of systolic and diastolic variables in elderly patients with symptoms of heart failure. In the present cross-sectional, explorative, echocardiographic study, our aims were 1) to explore the feasibility of obtaining systolic and diastolic variables, and 2) to study the concordance and pattern of correlations (factor analysis) of systolic and diastolic measurements.
2. MATERIALS AND METHODS
2.1. Population
From 2000 to 2003, we studied 170 elderly patients from one selected primary health care centre (7800 inhabitants) in the city of Skellefteå, northern Sweden. In this cohort, we validated the diagnosis of chronic HF in patients with suspected but previously undiagnosed HF [4]. In short, all patients with symptoms of HF were examined by a general practitioner (GP) then referred for echo and diagnosed by a cardiologist at the local hospital (KB) according to the criteria proposed by the European Society of Cardiology [5]. One year after the first study ended, a new echo machine was available that expanded the measurements for systolic and diastolic function in several new ways. The question about the feasibility and concordance of all these measurements was then raised. It was also of interest to study correlations within systolic or diastolic variables and whether or not these could be reduced through factor analysis. All patients were offered a new examination performed by one of the investigators (JR) who was blinded to the results from the first study. Of these 170 patients, 46 were unable to participate, 23 had died, 11 declined participation, nine did not come to the appointment, two had dementia and could not provide written informed consent, and one had moved to another area. In total, 124 patients were included from December 2002 to February 2005. Baseline characteristics are presented in Table 1. The patients were elderly and predominately female primary health care patients (70% females, 30% males, mean age (77 ± 9) years) of whom 46% were older than 80 years. The majority had clinical symptoms of dyspnea (82%) or fatigue (69%) suggesting HF. No patients were in a decompensated state. Medications and concomitant diseases are listed. Mean body mass index (BMI) was (27 ± 5) kg/m2. We decided to leave the patients undiagnosed to make the Echo examination as unbiased as possible.
2.2. Echocardiographic Examination
Systolic and diastolic variables were analyzed with the
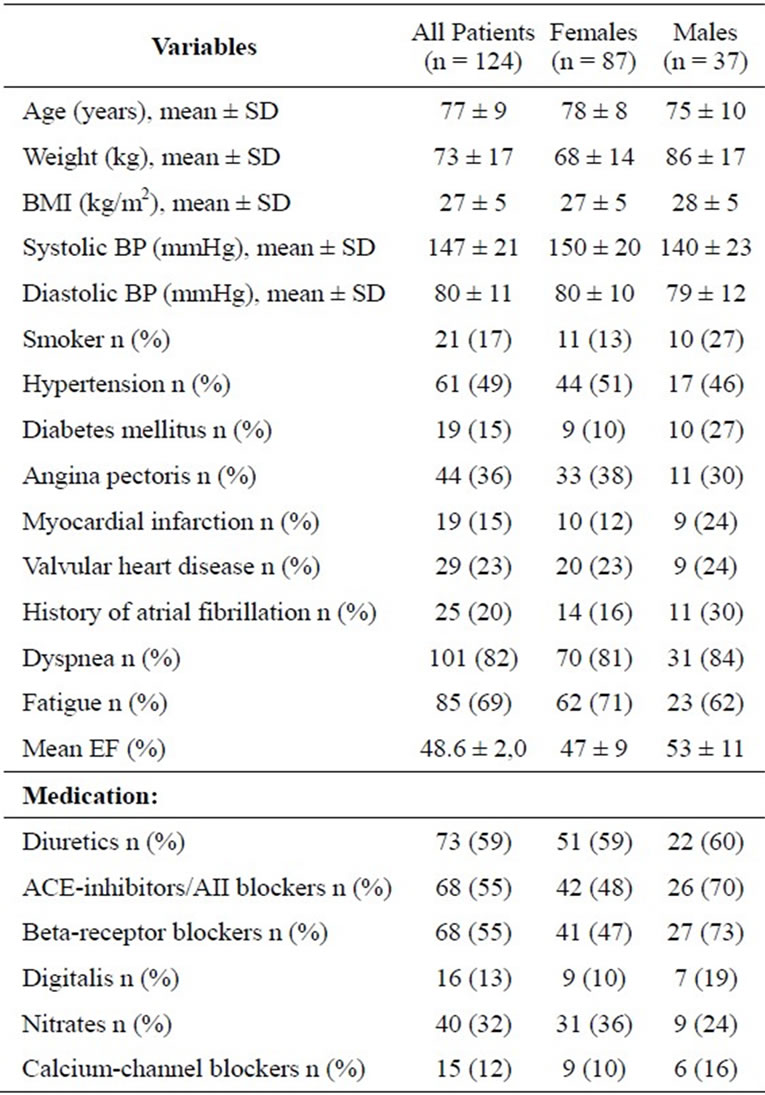
Table 1. Baseline patient characteristics.
Acuson Sequoia 256 system (Siemens Medical Systems, Mountain View, CA). Standard images were taken and calculations performed according to the guidelines of the American Society of Echocardiography [6]. Left atrial (LA) size was indexed to body size (LA index) to avoid differences related to body size or gender. Visual estimation of LV systolic function was performed and qualitatively characterized as good or mildly, moderately, or severely depressed [2]. The LV was divided into 17 segments [7] and segmental wall motion abnormalities (1 = normal contractility, 2 = hypokinesis, 3 = akinesis, and 4 = dyskinesis, X = segment not visible) were tabulated. Wall-motion score index was then calculated [8]. Measurement of the systolic mitral annular motion (MAM) was obtained with M-mode by placing a cursor at the septal, lateral, anterior, and inferior regions of the mitral annulus in the 4- and 2-chamber apical views. The mean of the systolic displacement in the four regions was then calculated [9].
2.3. Doppler Velocities
The transmitral and pulmonary venous flow-velocity patterns were recorded with a pulsed wave Doppler technique recommended by the American Society of Echocardiography [10] and by the Technical Guide for Obtaining Optimal Flow Velocity Recordings [11]. Measurements were averaged from three different and most readable cardiac cycles. Pulsed Doppler technique was also used to estimate LV stroke volume [10]. Using the spectral display of the mitral regurgitation jet, the rate of LV pressure rise (MRdp/dt) was used as an indirect measure of myocardial contractility and systolic function [12]. The MR signal was optimized, sweep speed set to 100 mm/sec, and the velocity scale set to 4 m/sec. The time interval between 1 m/sec and 3 m/sec was measured and dp/dt was performed using the Bernoulli equation.
2.4. Color M-Mode
E wave propagation velocity (Vp) was recorded in the apical 4-chamber view with the color sector as narrow as possible, and by adjusting the color baseline to 40 - 50 cm/sec [3]. The slope of the first aliasing velocity (red to blue) from the mitral leaflet tips in early diastole at a position of 4 cm in the LV cavity was calculated in cm/sec. The three most readable measurements were averaged.
2.5. Tissue Doppler Imaging
Tissue Doppler imaging (TDI) [3] was obtained from the 4-chamber apical view. TDI velocities were measured at the septal corner of the mitral annulus and velocities from the three most readable beats were averaged. The velocity scale was adjusted to obtain a Nyquist limit of 15 - 20 cm/sec with a sample volume of 3 - 5 mm. We used low-wall filter settings and a Doppler gain setting of –15 dB. By aligning the cursor as parallel as possible to the septal wall, Doppler beam angles over 20 degrees were avoided.
LA contractility was estimated by TDI measuring A’ (mitral annular velocity at the septal corner) at the time of atrial contraction [13]. TDI A’ < 6.5 cm/sec or atrial fibrillation implied impaired LA systolic function.
2.6. Protocol and Derived Variables
A standardized protocol was devised to allow for reliable evaluation of LV function. LV systolic function was assessed with a visual estimation of LV function [2], fractional shortening (FS%) [6], wall motion score index (WMSI) [8], mitral annular motion (MAM) [9], Dopplerderived mitral regurgitation dp/dt (MRdp/dt) [12], stroke volume index (SVI) [14], and tissue Doppler imaging systolic velocity (TDI S’) at the septal corner of the mitral annulus [15]. Diastolic variables were LA index [16], the ratio between early and late mitral inflow velocity (E/A) [17], E deceleration time (DT) [18], isovolumic relaxation time (IVRT) [18], the ratio between pulmonary vein systolic and diastolic flow velocities (PVs/d) [19], the difference between the pulmonary AR-dur and mitral A-dur (PVARdur-Adur) [20], flow propagation velocity (Vp) [3], tissue Doppler-imaging early diastolic velocity (TDI E’) [3], tissue Doppler-imaging late diastolic velocity (TDI A’) [21], LA contractility [13], E/E [22], and E/Vp [23]. Echocardiographic variables are presented in Table 2.
Systolic heart failure was defined as an EF below 50%. The mean calculated EF was 48.6% ± 2.0% [24]. Of all 124 patients, 69 (56%) patients had an EF below 50%. If diastolic heart failure is strictly diagnosed as heart failure with preserved ejection fraction, only 7 patients fulfilled the criteria proposed by Xin-Xin Shuai and co-workers [25]. Their criteria was based on EF ≥ 50%, E/E’, LA index and PVARdur-Adur. The remaining 48 patients in our study with EF ≥ 50% did not fulfil the above criteria for diastolic heart failure [25] but could miss or have one or more diastolic variables outside the reference values presented in Table 3.
2.7. Procedures
Cut-off values with references are shown in Table 3. These values were searched and chosen from the most cited articles and we tried to find specific variables for patients aged > 70 years. We used concordance on an individual basis to evaluate whether the measured variables were in agreement, indicating either normality or abnormality. For example, if all variables in an individ-
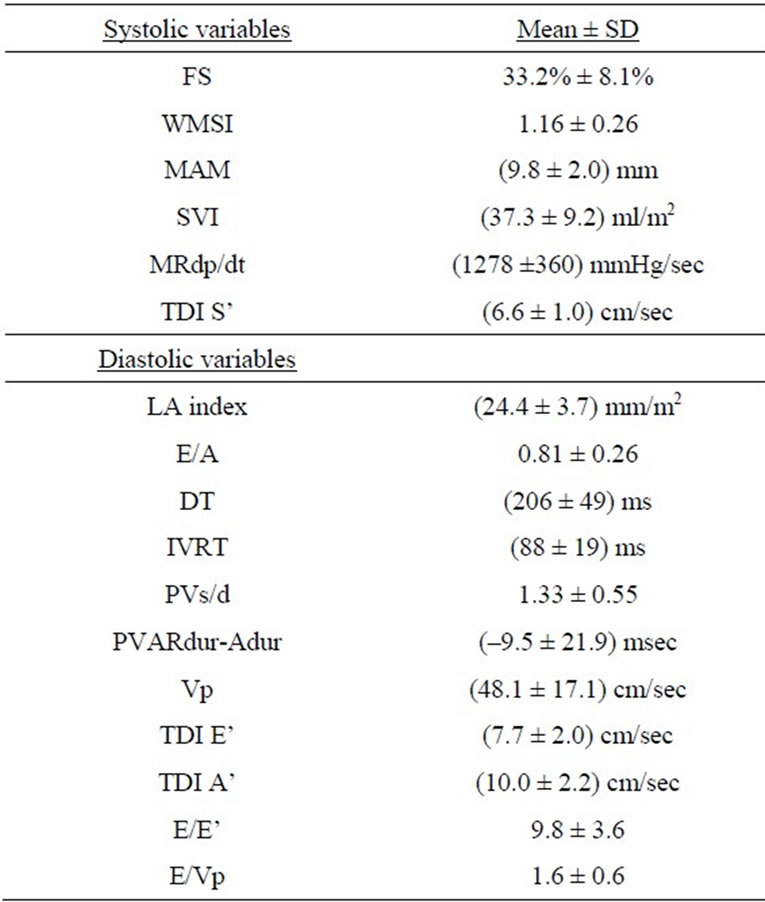
Table 2. Measured echocardiographic variables of the patients, data presented as mean ± standard deviation.
Explanation of abbreviations: FS, fractional shortening; WMSI, wall motion score index; MAM, mitral annular motion; SVI, stroke volume index; MRdp/dt, Doppler derived mitral regurgitation dp/dt; TDI S’, tissue Doppler imaging systolic velocity; LA index, LA antero-posterior diameter indexed to body surface; E/A, the ratio between early mitral inflow velocity and late mitral inflow velocity; DT, E deceleration time; IVRT, isovolumic relaxation time; PVs/d, the ratio between pulmonary vein systolic and diastolic flow velocities; PVARdur-Adur, the difference between the pulmonary AR-dur and mitral A-dur; Vp, flow propagation velocity; TDI E’, tissue Doppler imaging early diastolic velocity; TDI A’, tissue Doppler imaging late diastolic velocity.
ual patient were abnormal, i.e. outside the cut-off limits for normality, the concordance was very good. If half of the variables were abnormal and half were normal, the concordance was judged as poor. In the definitions below, we elaborate on how the extent of concordance was assessed.
For each individual patient, we also noted which variables could not be obtained either because of poor image quality, technical difficulties, or atrial fibrillation.
2.8. Definitions
Feasibility was defined as the percentage of echo variables that could be obtained and measured.
Concordance was defined as follows:
1) Very good if all measurable systolic or diastolic variables were in agreement.
2) Good (acceptable) if two or fewer systolic or three or fewer diastolic variables differed.
3) Poor if more than two of the systolic or more than
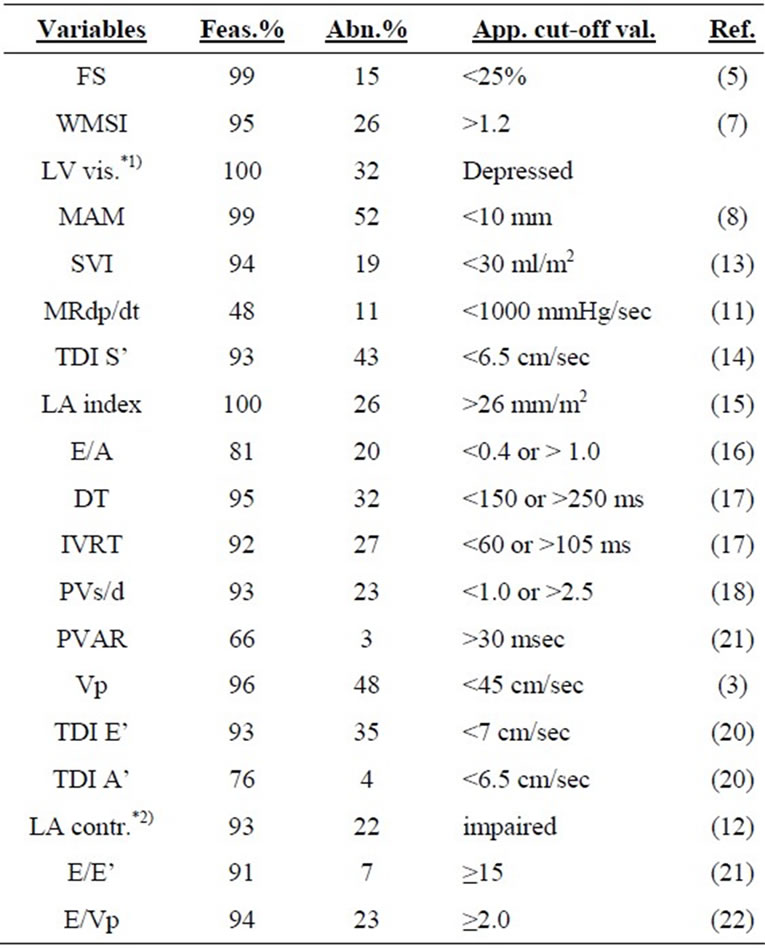
Table 3. Feasibility of obtaining variables, prevalence of abnormalities, applied cut-off values with references from the literature.
Explanation of abbreviations: Feas., feasibility, Abn., abnormality, App. cutoff val., applied cut-off values, Ref., references, FS, fractional shortening; WMSI, wall motion score index; *1)LV vis., visual estimation of LV systolic function; MAM, mitral annular motion; SVI, stroke volume index; MRdp/dt, Doppler derived mitral regurgitation dp/dt; TDI S’, tissue Doppler imaging systolic velocity; LA index, LA antero-posterior diameter indexed to body surface; E/A, the ratio between early mitral inflow velocity and late mitral inflow velocity; DT, E deceleration time; IVRT, isovolumic relaxation time; PVs/d, the ratio between pulmonary vein systolic and diastolic flow velocities; PVAR, the difference between the pulmonary AR-dur and mitral A-dur; Vp, flow propagation velocity; TDI E’, tissue Doppler imaging early diastolic velocity; TDI A’, tissue Doppler imaging late diastolic velocity; *2)LA contractility abnormalities includes patients with atrial fibrillation.
three of the diastolic variables differed.
4) Missing if more than two of the systolic or three of the diastolic variables could not be obtained and no estimation of concordance was done.
The percentages of the three different levels of concordance were calculated.
2.9. Statistical Analysis
Statistical analysis was performed with SPSS software (version 11.5) (SPSS Chicago, IL). All continuous variables were expressed as the mean value ± standard deviation (SD) and categorical variables as percentages. Two systolic variables, WMSI and visual categorization, and six diastolic variables, E/E’, E/A, DT, LA index, PVs/d, and TDI A’, were skewed and thus log transformed. After log transformation, only WMSI and visual categorization of all variables were still moderately skewed at –1.8 ± 0.2 and –2.1 ± 0.2, respectively.
Factor analysis has been used to simplify the underlying structure of multiple contributing variables. Grouping variables into factors may be of value as it shows which variables correlate with each other. For this purpose, we used principal component analysis with Varimax rotation to reduce the number of systolic and diastolic variables. Only factors with eigenvalues above 1.00 were chosen. These factors in a rotated principal analysis are, by definition, uncorrelated. All systolic and diastolic variables, respectively, contributed to all factors but with different loadings. A factor loading is a variable’s correlation to the factor. In each factor, only those variables with a loading above 0.5 were considered. WMSI was inverted so as to be presented in the same functional direction as the systolic variables in Figure 1. No diastolic variable was inverted.
The study complied with the Declaration of Helsinki and was approved by the local ethics committee of Västerbotten in northern Sweden. All patients provided their written informed consent to participate.
3. RESULTS
The feasibility of different Echo variables is listed in Table 3. The success rate for recorded variables was 93% to 100% for all but four variables; MR dp/dt could be measured in only 48%, PVAR dur-A dur in 66%, E/A in 81%, and TDI A’ in 76% of patients.
For the systolic variables, very good concordance was achieved in 23%, good (acceptable) concordance in 60%, and poor concordance in 15%. For diastolic variables, very good concordance was achieved in 10%, good (acceptable) concordance in 57%, and poor concordance in 22% (Table 4). There was missing information in 2% of systolic and 11% of diastolic variables. The prevalence of abnormalities among the different echocardiographic variables is summarized in Table 3. Among systolic parameters, MAM was abnormal in 52% and TDI S’ in
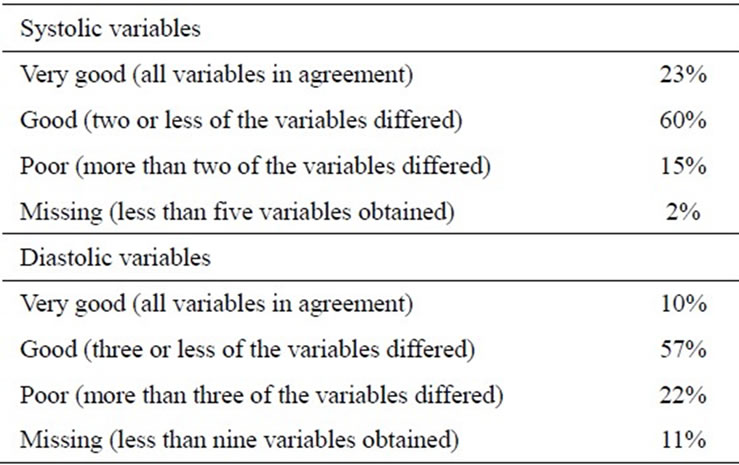
Table 4. Consistency of echocardiographic variables.
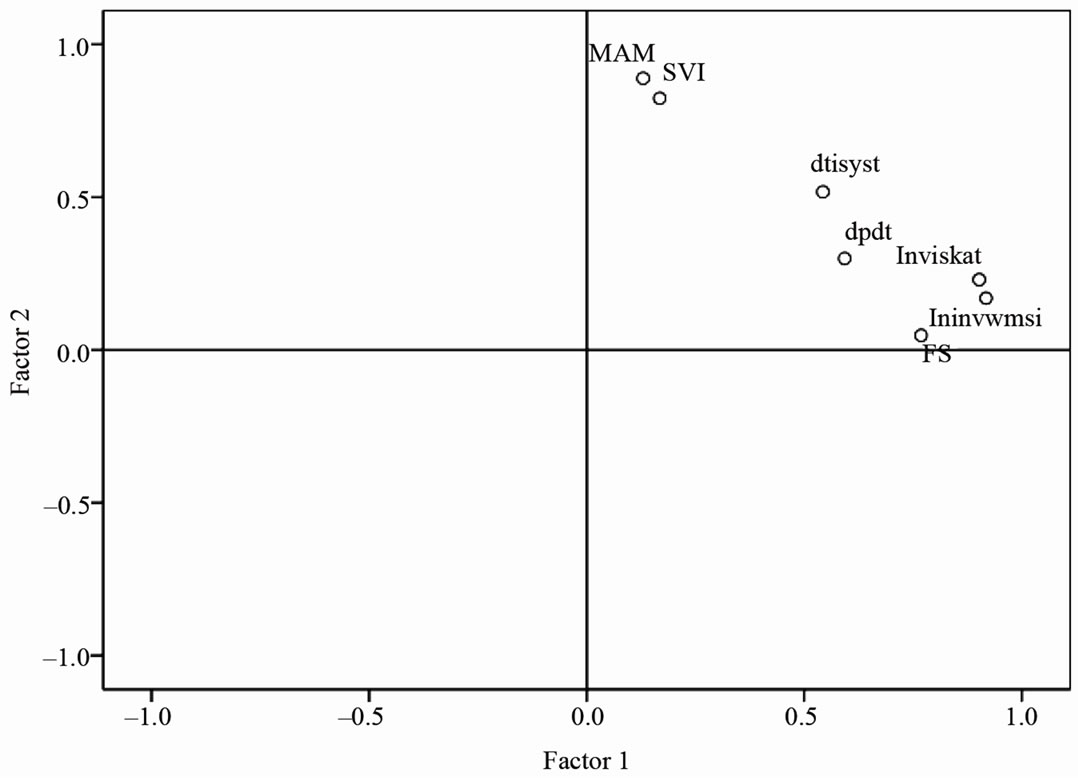
Figure 1. Result of factor analysis with the extracted two factors with seven included systolic variables. Lnviskat and lninvwmsi are highly associated with factor 1 while MAM and SVI are primarily associated with factor 2.
Abbreviations: lnviskat = log transformed visual estimation of LV function, lninvwmsi = log transformed inverted wall motion score index, FS = fractional shortening, MAM = mitral annular motion, dp/dt = Doppler derived mitral regurgitation (MRdp/dt), SVI = stroke volume index, dtisyst = tissue doppler imaging systolic velocity at the septal corner of the mitral annulus (TDI S’).
43%. Disturbances in systolic long-axis motion showed the highest percentage of abnormalities. Of diastolic variables, velocity propagation rate was abnormal in 48% and TDI E’ and DT were abnormal in 35% and 32%, respectively.
Factor Analysis
Seven systolic variables were reduced to two factors that explained 69% of the total variance in systolic function. Although the WMSI and visual categorization were somewhat skewed, they were included in the factor analysis. LogWMSI, logVisual categorization, FS, MRdp/dt, and TDI S’ with loadings 0.92, 0.90, 0.77, 0.59, and 0.54, respectively, constituted Factor 1. Factor 2 included variables MAM, SVI, and TDI S’ with loadings of 0.89, 0.82, and 0.52, respectively (Figure 1).
Eleven diastolic variables (LA contractility was excluded because it was a dichotomous variable) were reduced to four factors explaining 73% of diastolic parameters. Factor 1 included logE/E’ (–0.86), TDI E (0.82), logTDI A (0.57), and PVARdur-Adur (0.56). Factor 2 included Vp (–0.96), E/Vp (0.83), and IVRT (0.65). Factor 3 included logPVs/d (0.87), logE/A (–0.82), and logTDI A (0.57), and Factor 4 included only logLAindex (0.81).
No figure is shown for diastolic variables because of the difficulty with presenting four dimensions graphically.
4. DISCUSSION
One of the main findings of our study was that the feasibility of assessing echocardiographic variables was low for four variables; MR dp/dt, PVARdur-Adur, TDI A’, and E/A. The feasibility of the other echocardiographic variables was acceptable. Another finding was that concordance was poor/missing in 17% of systolic and 33% of diastolic variables. MR dp/dt could be measured in less than half of the patients due to lack of mitral regurgitation or a disturbing valve click. Measurement of PVARdur was not possible due to atrial fibrillation at echocardiography in 22 patients, whereas 20 patients demonstrated low-flow signal quality. E/A was not recorded in 24 patients (22 with atrial fibrillation and two with poor image quality). TDI A’ was used to estimate left atrial contractility [13], but patients with atrial fibrillation were also regarded as having impaired LA systolic function, explaining the difference in feasibility between LA contractility (93%) and TDI A’ (76%).
Khan et al. [26] studied patients in sinus rhythm (80 patients, mean age 69 years) and had a 100% success rate for TDI measurements of the septal and lateral mitral annulus. This also might explain why they could record mitral valve flow in 100%. Khan reported a very low recording success rate (46%) for pulmonary vein atrial reversal (PVAR dur). Otherwise, we achieved similar results regarding TDI variables and Vp. Jensen et al. [27] had an 89% success rate for obtaining PVARdur in patients with sinus rhythm, but their patients were also younger (mean age 68 years) than ours.
We extend earlier knowledge of not only feasibility, but also of concordance of echocardiographic variables in individual patients. The concordance was better among systolic variables than among diastolic ones. The measured diastolic variables were more numerous than the systolic ones, and were therefore more likely to show disagreement. There are many potential explanations for variations in concordance, such as the number of patients with atrial fibrillation, concomitant diseases, degree of HF, patients’ age, and ongoing treatment. It is also important to recall how cut-off values are determined. In the literature, we found wide variation in how normality and abnormality were defined but very little data on how the cut-off limits were applied to elderly HF patients, as most studies did not include sufficiently high numbers of patients of advanced age. Another problem that should be considered is the way each variable relates to ventricular dysfunction. This is important whether there is a linear or U-shaped relationship, as for E/A in diastolic dysfunction.
The prevalence abnormalities depend to a high degree on the cut-off value chosen for a given abnormality. In Table 3, these are shown together with their references. For clinical decisions, the cut-off value has a very strong impact and the clinical question for elderly patients is often whether divergent results are due to normal aging or pathology. For TDI S’ with a cut-off value of <6 cm/sec, we found 24% abnormalities. On the other hand, if a cut-off value of <7 cm/sec was chosen, 62% were abnormal. With respect to systolic variables, MAM and TDI S’ were abnormal more often when compared with fractional shortening (FS%). One possible explanation is that long-axis disturbances precede radial changes measured as FS% [28] Since 18% of our study patients (at the Echo exam) had atrial fibrillation, this had a strong impact on some of the diastolic variables. Among our patients with impaired LA contractility, 22 patients (81%) had atrial fibrillation. Of those with reduced PVs/d, 59% had atrial fibrillation contributing to a decreased systolic fraction of the pulmonary vein flow pattern. In our study, there were very few patients with estimated increased left atrial pressure. Only 7% had an E/E’ > 15, and 26% had an enlarged left atria; that is, LA index > 26 mm/m2. This suggests that only a few patients in our study had severe left HF, which is in agreement with what was presented in the ESC Consensus Statement of 2007 [29].
Factor analysis was used to study the possibility of reducing the number of variables that constituted systolic or diastolic function. Systolic variables could be reduced to two factors that mainly describe radial (Factor 1) or longitudinal (Factor 2) functions. A reduction in the number of variables always entails a significant loss of information; in our case, 31% for systolic and 27% for diastolic function. Future prospective studies are needed to define whether or not it is enough to analyze only the variables with the highest correlations to the factors; furthermore, the incremental value of adding variables with internal correlations below 0.5 or eigenvalues less than 1.
We regarded our patients as fairly representative of Swedish primary health care patients [30] therefore, it was important from a clinical point not to exclude patients with atrial fibrillation, valvular heart disease, or those with pacemakers.
5. LIMITATIONS
The present study was cross-sectional with no control group and no gold standard among the variables tested. The number of patients was limited, which hampered the statistical analysis. A higher number of patients was desirable, but we examined all patients available who presented at this primary health care centre. Because this was an explorative and hypothesis-generating study of older patients with HF, our judgement was that the number of patients enrolled would be sufficient.
Factor analysis was based only on those patients with all systolic (n = 52) and diastolic (n = 76) variables registered. Left ventricular ejection fraction was only calculated [24], instead we used categorized visual estimation, mitral annular motion, and tissue Doppler imaging systolic velocity.
TDI was not measured at four sites as some authors have recommended [31] but Omnen [22] showed that the E/E’ ratio using the medial annulus correlated better with LV filling pressures when measured with left heart catheterization.
A wall motion score index of 1.0 is regarded as normal, but we used a cut-off value of 1.2 according to results published by Moller [8]. LA size was measured as the antero-posterior diameter by M-mode in the parasternal long-axis view and not measured with the LA volume method, as recommended by ASE [6]. Doppler velocity measurements in patients with atrial fibrillation are usually averaged from five different readable cardiac cycles, but we averaged three different cycles as for other Doppler measurements in the study.
The examinations were performed by a single investigator on one occasion and we did not study reproducibility by any inter-reader variability as Khan did [25] Since our patients were referred from only one primary health care centre, the external validity is reduced. Another limitation when studying patients complaining of dyspnea upon exertion is that all examinations were done at rest. Exercise Echo could unmask patients who show normal values at rest but have restrictive filling patterns with exercise [32].
6. CLINICAL IMPLICATIONS
Our results indicate that in clinical practice, MRdp/dt and PVARdur-Adur in elderly patients could be omitted as routine measurement because these variables had limited feasibility and only moderate correlations to the extracted factors for evaluating systolic and diastolic function. The routine measurement of PVARdur-Adur could also be questioned, but in select circumstances it may still be useful to detect increased LV end-diastolic pressures in cases where the other diastolic variables show signs of normal mean left atrial pressure. The incremental value of these variables beyond other measures of systolic or diastolic function warrants further evaluation. The concordance for diastolic variables was poor/missing in 33%, which further raises the question of which echocardiographic variables are the most informative, time-saving, and rational for use in daily Echo practise.
7. CONCLUSIONS
The low feasibility of some systolic variables and the questionable concordance of diastolic variables and factor analysis suggest that the number of systolic and especially diastolic measurements could be reduced. The clinical outcome of such a reduction needs to be evaluated.
Funding: This work was supported by an unrestricted grant from the Foundation of Medical Research in Skellefteå.
8. ACKNOWLEDGEMENTS
The authors are very grateful to Dr Thomas Suh for his skillful linguistic help in preparing the manuscript.
REFERENCES
- Caruana, L., Petrie, M.C., Davie, A.P. and McMurray, J.J. (2000) Do patients with suspected heart failure and preserved left ventricular systolic function suffer from “diastolic heart failure” or from misdiagnosis? A prospective descriptive study. British Medical Journal, 321, 215-218. doi:10.1136/bmj.321.7255.215
- Cheitlin, M.D., Armstrong, W.F., Aurigemma, G.P., et al. (2003) ACC/AHA/ASE 2003 Guideline update for the clinical application of echocardiography: summary article. A report of the American college of cardiology/ american heart association task force on practice guidelines (ACC/AHA/ASE committee to update the 1997 guidelines for the clinical application of echocardiogramphy). Journal of the American Society of Echocardiography, 16, 1091-1100. doi:10.1016/j.echo.2003.08.001
- Garcia, M.J., Thomas, J.D. and Klein, A.L. (1998) New Doppler echocardiographic applications for the study of diastolic function. Journal of the American Collage of Cardiology, 32, 865-875. doi:10.1016/S0735-1097(98)00345-3
- Olofsson, M., Edebro, D., Boman, K. (2007) Are elderly patients with suspected HF misdiagnosed? A primary health care center study. Cardiology, 107,226-232. doi:10.1016/S0735-1097(98)00345-3
- Guidelines for the diagnosis of heart failure (1995) The task force on heart failure of the european society of cardiology. European Heart Journal, 16, 741-751.
- Lang, R.M., Bierig, M., Devereux, R.B., et al. (2005) Recommendations for chamber quantification: a report from the American Society of Echocardiography’s Guidelines and Standards Committee and the Chamber Quantification Writing Group, developed in conjunction with the European Association of Echocardiography, a branch of the European Society of Cardiology. Journal of the American Society of Echocardiography, 18, 1440-1463. doi:10.1016/j.echo.2005.10.005
- Cerqueira, M.D., Weissman, N.J., Dilsizian, V., et al. (2002) Standardized myocardial segmentation and nomenclature for tomographic imaging of the heart: a statement for healthcare professionals from the Cardiac Imaging Committee of the Council on Clinical Cardiology of the American Heart Association. Circulation, 105, 539-542. doi:10.1161/hc0402.102975
- Moller, J.E., Hillis, G.S., Oh, J.K., et al. (2006) Wall motion score index and ejection fraction for risk stratifycation after acute myocardial infarction. American Heart Journal, 151, 419-425. doi:10.1016/j.ahj.2005.03.042
- Hoglund, C., Alam, M., Thorstrand, C. (1988) Atrioventricular valve plane displacement in healthy persons. An echocardiographic study. Acta Medica Scandinavica, 224, 557-562.
- Quinones, M.A., Otto, C.M., Stoddard, M., Waggoner, A., Zoghbi, W.A., (2002) Recommendations for quantification of Doppler echocardiography: a report from the Doppler quantification task force of the nomenclature and standards committee of the American society of echocardiography. Journal of the American Society of Echocardiography, 15, 167-184. doi:10.1067/mje.2002.120202
- Appleton, C.P., Jensen, J.L., Hatle, L.K. and Oh, J.K. (1997) Doppler evaluation of left and right ventricular diastolic function: a technical guide for obtaining optimal flow velocity recordings. Journal of the American Society of Echocardiography, 10, 271-292. doi:10.1016/S0894-7317(97)70063-4
- Bargiggia, G.S., Bertucci, C., Recusani, F., et al. (1989) A new method for estimating left ventricular dP/dt by continuous wave Doppler-echocardiography. Validation studies at cardiac catheterization. Circulation, 80, 1287- 1292. doi:10.1161/01.CIR.80.5.1287
- Khankirawatana, B., Khankirawatana, S., Peterson, B., Mahrous, H. and Porter, T.R. (2004) Peak atrial systolic mitral annular velocity by Doppler tissue reliably predicts left atrial systolic function. Journal of the American Society of Echocardiography, 17, 353-360. doi:10.1016/j.echo.2003.12.023
- Ilercil, A., O’Grady, M.J., Roman, M.J., et al. (2001) Reference values for echocardiographic measurements in urban and rural populations of differing ethnicity: the Strong Heart Study. Journal of the American Society of Echocardiography, 14, 601-611. doi:10.1067/mje.2001.113258
- Bruch, C., Gradaus, R., Gunia, S., Breithardt, G. and Wichter, T. (2003) Doppler tissue analysis of mitral annular velocities: evidence for systolic abnormalities in patients with diastolic heart failure. Journal of the American Society of Echocardiography, 16, 1031-1036. doi:10.1016/S0894-7317(03)00634-5
- Pritchett, A.M., Jacobsen, S.J., Mahoney, D.W., Rodeheffer, R.J., Bailey, K.R. and Redfield, M.M. (2003) Left atrial volume as an index of left atrial size: a population-based study. Journal of the American College of Cardiology, 41, 1036-1043. doi:10.1016/S0735-1097
- Munagala, V.K., Jacobsen, S.J., Mahoney, D.W., Rodeheffer, R.J., Bailey, K.R. and Redfield, M.M. (2003) Association of newer diastolic function parameters with age in healthy subjects: a population-based study. Journal of the American Society of Echocardiography, 16, 1049-1056. doi:10.1016/S0894-7317(03)00516-9
- Klein, A.L., Burstow, D.J., Tajik, A.J., Zachariah, P.K., Bailey, K.R. and Seward, J.B. (1994) Effects of age on left ventricular dimensions and filling dynamics in 117 normal persons. Mayo Clinic Proceedings, 69, 212-224.
- Rossvoll, O. and Hatle, L.K. (1993) Pulmonary venous flow velocities recorded by transthoracic Doppler ultrasound: relation to left ventricular diastolic pressures. Journal of the American College of Cardiology, 21, 1687- 1696. doi:10.1016/0735-1097(93)90388-H
- Klein, A.L., Abdalla, I., Murray, R.D., et al. (1998) Age independence of the difference in duration of pulmonary venous atrial reversal flow and transmitral A-wave flow in normal subjects. Journal of the American Society of Echocardiography, 11, 458-465. doi:10.1016/S0894-7317(98)70026-4
- Sohn, D.W., Chai, I.H., Lee, D.J., et al. (1997) Assessment of mitral annulus velocity by Doppler tissue imaging in the evaluation of left ventricular diastolic function. Journal of the American College of Cardiology, 30, 474- 480. doi:10.1016/S0735-1097(97)88335-0
- Ommen, S.R., Nishimura, R.A., Appleton, C.P., et al. (2000) Clinical utility of Doppler echocardiography and tissue Doppler imaging in the estimation of left ventricular filling pressures: A comparative simultaneous Doppler-catheterization study. Circulation, 102, 1788-1794.
- Rivas-Gotz, C., Manolios, M., Thohan, V. and Nagueh, S.F. (2003) Impact of left ventricular ejection fraction on estimation of left ventricular filling pressures using tissue Doppler and flow propagation velocity. American Journal of Cardiology, 91, 780-784. doi:10.1016/S0002-9149
- Emilsson, K., Egerlid, R., Nygren, B.M. and Wandt, B. (2006) Mitral annulus motion versus long-axis fractional shortening. Experimental & Clinical Cardiology, 11, 302- 304.
- Shuai, X.X., Chen, Y.Y., Lu, Y.X., Su, G.H., Wang, Y.H., Zhao, H.L. and Han, J. (2011) Diagnosis of heart failure with preserved ejection fraction: which parameters and diagnostic strategies are more valuable? The European Journal of Heart Failure, 13, 737-745.
- Khan, S., Bess, R.L., Rosman, H.S., Nordstrom, C.K., Cohen, G.I. and Gardin, J.M. (2004) Which echocardiographic Doppler left ventricular diastolic function measurements are most feasible in the clinical echocardiographic laboratory? American Journal of Cardiology, 94, 1099-1101. doi:10.1016/j.amjcard.2004.06.080
- Jensen, J.L., Williams, F.E., Beilby, B.J., et al. (1997) Feasibility of obtaining pulmonary venous flow velocity in cardiac patients using transthoracic pulsed wave Doppler technique. Journal of the American Society of Echocardiography, 10, 60-66. doi:10.1016/S0894-7317(97)80033-8
- Henein, M.Y. and Gibson D.G. (1999) Long axis function in disease. Heart, 81, 229-231.
- Paulus, W.J., Tschope, C., Sanderson, J.E., et al. (2007) How to diagnose diastolic heart failure: a consensus statement on the diagnosis of heart failure with normal left ventricular ejection fraction. European Heart Journal, 28, 2539-2550. doi:10.1093/eurheartj/ehm037
- Alehagen, U., Eriksson, H., Nylander, E. and Dahlstrom, U. (2002). Characteristics of a Swedish primary health care population. Heart Drug, 2, 211-220. doi:10.1159/000067723
- Alam, M., Wardell, J., Andersson, E., Samad, B.A. and Nordlander, R. (1999) Characteristics of mitral and tricuspid annular velocities determined by pulsed wave Doppler tissue imaging in healthy subjects. Journal of the American Society of Echocardiography, 12, 618-628. doi:10.1053/je.1999.v12.a99246
- Ha, J.W., Oh, J.K., Pellikka, P.A., et al. (2005) Diastolic stress echocardiography: a novel noninvasive diagnostic test for diastolic dysfunction using supine bicycle exercise Doppler echocardiography. Journal of the American Society of Echocardiography, 18, 63-68. doi:10.1016/j.echo.2004.08.033
NOTES
*Conflict of Interest: None declared.