Open Journal of Civil Engineering
Vol.04 No.04(2014), Article ID:52869,8 pages
10.4236/ojce.2014.44034
Present Assessment of Public Traffic System Based on GIS in Kitakyushu
Kazuyuki Watari1,2, Weijun Gao1
1Faculty of Environmental Engineering, The University of Kitakyushu, Kitakyushu, Japan
2Geo Cluster Co. LTD, Japan
Email: gaoweijun@me.com
Copyright © 2014 by authors and Scientific Research Publishing Inc.
This work is licensed under the Creative Commons Attribution International License (CC BY).
http://creativecommons.org/licenses/by/4.0/


Received 18 September 2014; revised 10 October 2014; accepted 2 November 2014
ABSTRACT
With increasing of serious environment problems and the coming of the aging society, new traffic systems should be urgently rebuilt. It is necessary to evaluate the traffic service level by utilizing new technique and tool. This paper takes Kitakyushu city as case study to carry out an evaluation of urban traffic system. The concept of accessibility and mobility is used to evaluate the present condition of existing public traffic system based on GIS technology, and then establishment of new route is discussed according to the evaluation results. Additionally, this paper established GIS database and illustrated the relationship between the public traffic and population density. The regions without enough existing traffic were identified. Moreover, the essential terms and considerations were put forward to simulate a new route of public traffic line.
Keywords:
Urban Public Traffic, GIS Technology, Kitakyushu, Japan

1. Introduction
Advanced urban traffic system needs to be adjusted due to urgent demand of national/city’s government. Therefore, it is important for urban traffic management department to put forward an improvement measure. Meanwhile, with increasing of serious environment problems (energy circumstances and urban traffic) and the coming of the aging society, new traffic systems should be urgently rebuilt. Moreover, the urban traffic plan needs to be further examined. So, it is necessary to evaluate the traffic service level by utilizing new technique and tool.
There are many researches with the traffic system. Thong [1] , developed a GIS database with consideration of efficient data input and retrieval process in a way that is most useful to transportation planners for network travel demand projection and evaluation purposes. Arampatzis [2] presented a decision support system (DSS) integrated in a geographical information system (GIS) for the analysis and evaluation of different transport policies. Suzanne Mavoa [3] calculated a public transit and walking accessibility index for Auckland, New Zealand. SUN [4] investigated the inherent principles of spatial-temporal evolution of traffic congestion based on Shenzhen floating car data (FCD) and geo-simulation platform. Charlotte Wahl [5] studied public participation in Swedish municipal traffic planning with the focus onto what extent and how municipalities and consultants interact with participants in traffic-planning processes. Lee [6] proposed a wiki-like collaborative real-time traffic information collection, fusion and sharing framework, which includes user-centric traffic event reacting mechanism, and auto- matic agent-centric traffic information aggregating scheme.
This paper takes Kitakyushu city as a case study to carry out an evaluation of urban traffic system. The concept of accessibility and mobility is used to evaluate the present condition of existing public traffic system based on GIS spatial technology, and then establishment of new urban traffic route is discussed according to the evaluation results. Then, the paper establishes the region item and discusses new routes and their profit.
2. Study Area
Kitakyushu (33˚52'N, 130˚49'E) locates in Fukuoka prefecture, Kyushu, Japan. Its total area is 486.81 km2, population is 976,800 in 2013 [7] , and population density is 2040.80 per km2 (Figure 1). In the view of topographical features, topographic relief in Kitakyushu is bigger, sea extent elevation reaches to above 900 meters, mid- mountain and low-mountain accounting for 35% of total region area is main topographic types. Kitakyushu borders on the main islands of Japan across Kanmon Strait and is adjacent to several other Asian countries, and particularly it is conveniently located at the straight line connecting two largest cities, Tokyo in Japan and Shanghai in China. Meanwhile, the eastern and northern Kitakyushu has long coast line. It is one of the most active areas in Kitakyushu and enjoys the fastest economic development. In the 2013, GDP is JPY 3,523,636 million, travel people is 1220 ten thousand.
3. Investigation of Public Traffic Service
Firstly, this study extracts blank and inconvenient areas of public traffic service in Kitakyushu as research ob- jectives on the basis of GIS database.
Secondly, operating route and attained profit in these areas are evaluated.
Finally, feasibility of the new public traffic system is discussed according to the evaluation results.
Case analysis flows based on GIS technology are seen in Figure 2. The six cases are seen in Figure 3.
The cases area assumed as follow to evaluate the traffic blank area:
The inconvenient where operation new route to the bus stop is lower than 1 are extracted. The street where one-way lines are lower than 16 from am 6 to pm 10 is considered. Seen from Figure 4, the traffic blank area is outside the buffer, and the traffic inconvenient area is inside the buffer. The repeated points of each data are deleted by manual operation. The center of each terminal in the six cases is set the center of a circle, a distance is taken as radius, the resulting circle is considered to blank and inconvenient areas. The inconvenient area in-
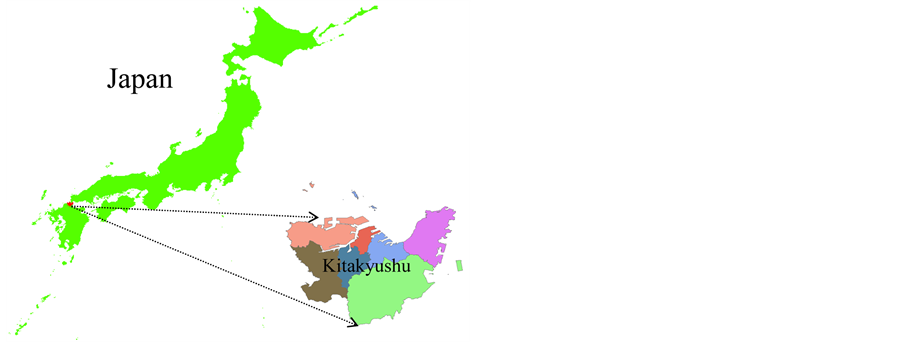
Figure 1. Study area.
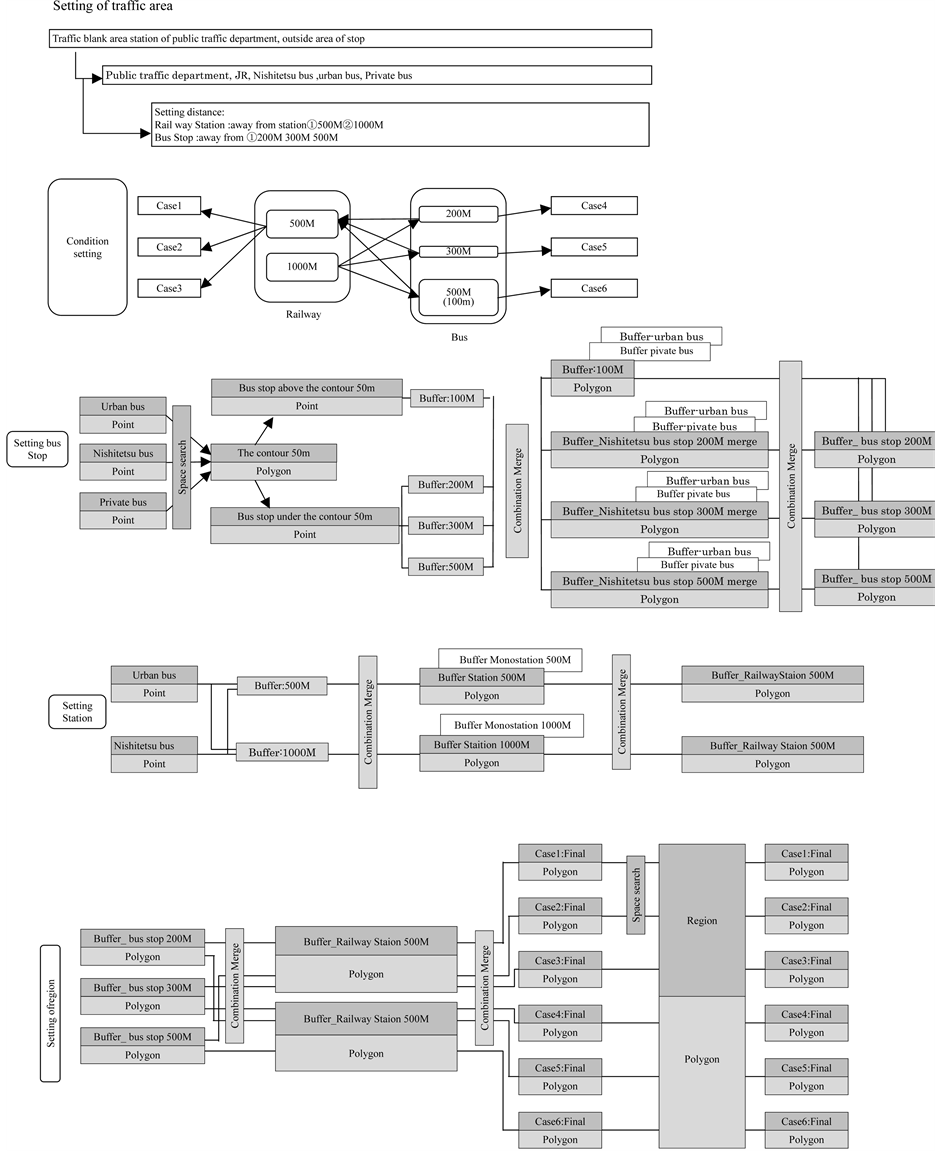
Figure 2. Case analysis flow based on GIS technology. ① 500 m away from railway and 200 m away from bus stop; ② 500 m away from railway and 300 m away from bus stop; ③ 500 m away from railway and 500 m away from bus stop; ④ 1000 m away from railway and 200 m away from bus stop; ⑤ 1000 m away from railway and 300 m away from bus stop; ⑥ 1000 m away from railway and 500 m away from bus stop.
creases according to the extraction data (500, 300 and 200 m away from bus stop). According to investigation
results, population without access to traffic will increase with the distance away from bus stop.

Figure 3. Case analysis.
4. Establishment of Region Item
According to the extracted elementary school, this paper selects some school areas where there are more than 2000 people and more than 500 elders as research objectives, and then neighborhoods with 1 km radius around the research objective are considered as the same areas to carry out case studies. The case studies contain CASE2 and CASE5. The number of the extraction was as follows: CASE2: 26 districts (Figure 5); CASE5: 11 districts (Figure 6). In order to discuss new route setting of target district, the following conditions need to be proposed. In CASE 2, inconvenient area is extracted to take as research objective. In the adjacent circumstances, if an area is longed to other elementary schools, but the area is situated in the 1 kilometer radius around the research objective, we think it as the same region. The requested area of government is taken as a research object.
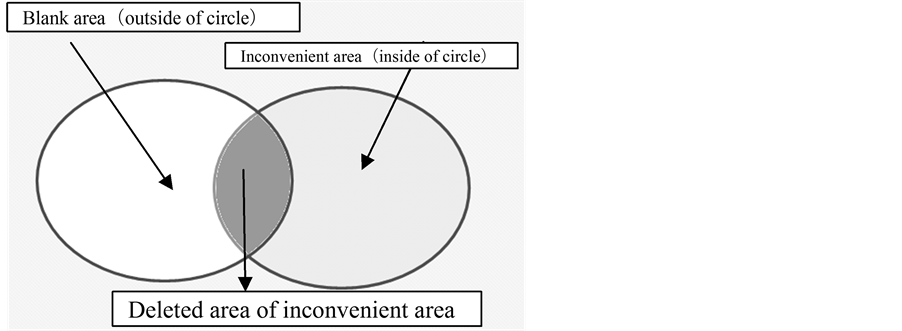
Figure 4. Blank area and inconvenient area.
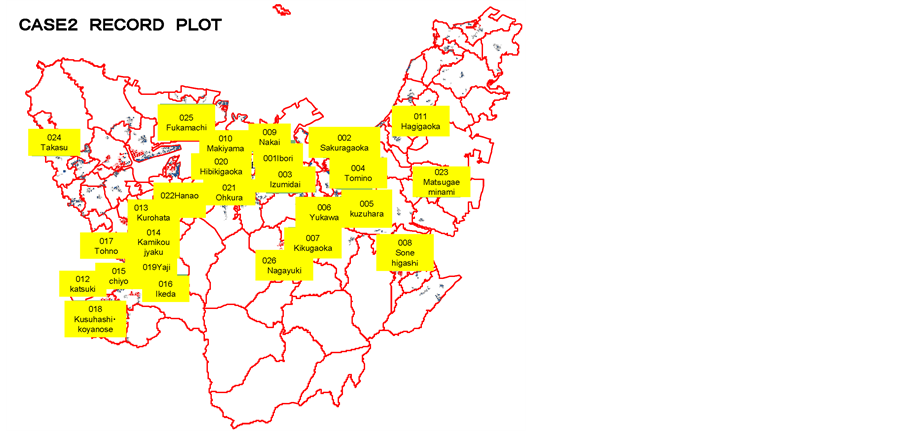
Figure 5. CASE2 26 districts.
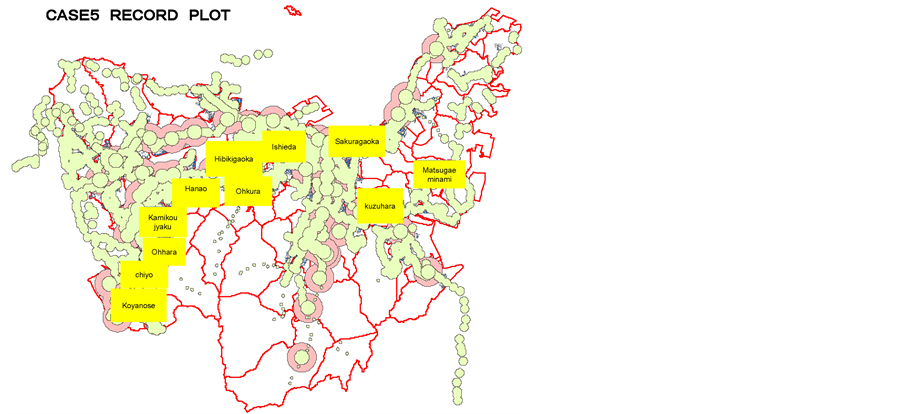
Figure 6. CASE5 11 districts.
5. Result and Discussion
5.1. Discussion of New Route
At present, bus users are inclined to decreasing. There are two reasons, on the one hand, traffic jam of the highway becomes more and more serious because of the concentration of the increasing cars; on the other hand, timing system of bus is bad. Meanwhile, there are many residents in the suburbs area. However, development balance of public bus is not adjusted, which result in that buses do not pass through the suburbs area. Until now, there aren’t bus routes in the many places. Therefore, it is necessary to set up the community bus routes in the inconvenient area of public traffic. The system with short distance, small quantity, frequent transportation and the circulation type should be firstly discussed to offer comfortable mobility for every people in the narrow roads of the public transport blank (inconvenient) area (Figure 7).
It is easy to go to the urban center by operating the route linking with busy streets, the main facilities and the traffic blank zones. In addition, circulation bus of the one way will be operated; it only takes 30 - 60 minutes to run a round. So the number of bus should be increased. Since the larger route bus doesn’t pass the narrow road of the residential area, if minibus is applied, the bus stops become nearer.
If the mobility of the public blank (inconvenience) area is improved, communication of local people will be activated; community will be brought up; increasing of elder’s outgoing opportunities will be promoted; activa- tion of the social participation will be supported. It is anticipated to improve the access to central town and to activate the people’s communication. Importantly, the system will help the urban traffic away from seriously
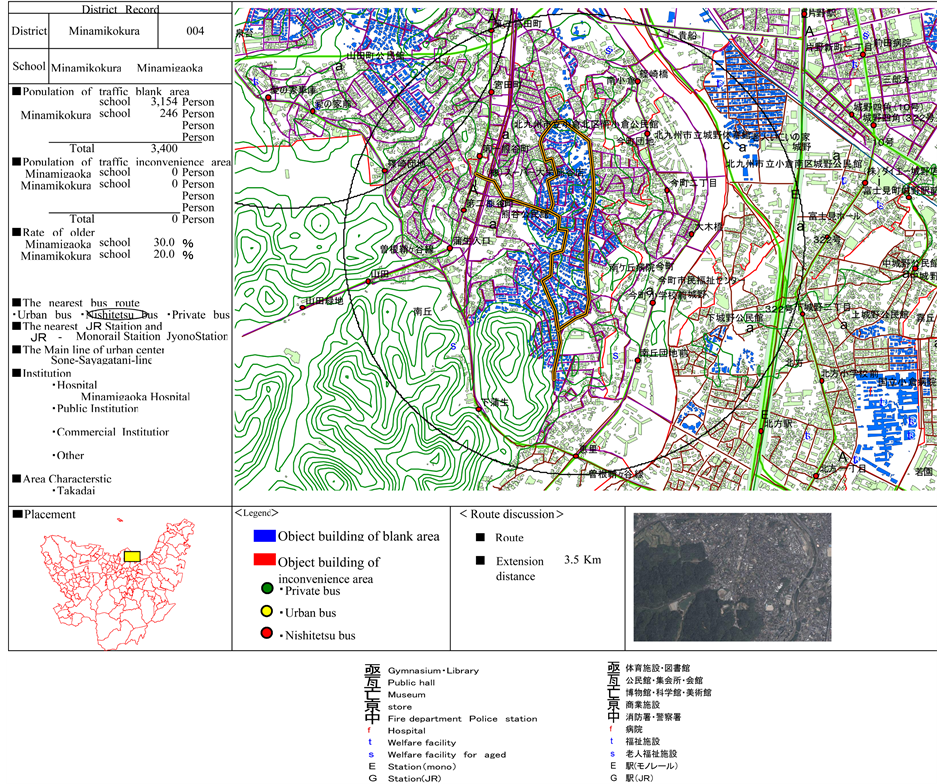
Figure 7. District record.
depending on the private cars.
5.2. Discussion of Profit
There are many irregular areas and ramps in the suburb; on the other hand, streets in the resident area are adjusted in the process of management. The jamming in some parts of arterial streets will make it difficult for bus to run on the dot. Even in the central area, landform and street structure still limit the convenience of traffic. Due to the willing of traveling, the amount of traveling elders has been increasing. Among the traffic ways, walking and taking bus occupy a large percent, especially, bus is usually applied in everyday life. However, some complaints are arisen against the problems when taking bus, for example, climbing up and down, receiving the message, distance to the station, bus intermediate, noisy and services.
The target people of the system are those elders who reside in the traffic-lagging areas. They use the bus in many occasions of everyday life, such as, shopping, going to hospital, and so on. The system covers the traffic- lagging areas, areas with high elder percent and central town. The route will be regulated to single-direction circulation through the narrow streets in the period of 30 - 60 minutes. The system will provide the people with amenity and mobility; moreover, some valuable suggestions will be zealously discussed and be introduced into the system. The distance of two bus stations is set to 200 m; additionally, waiting places are constructed under the considerations of accumulating snow. Especially, the existing establishment will be neatly made the best use.
Here about the calculation of the profit.
We assumed enterprise (investment) cost as Centerprise and the value of enterprise cost based on the data from the bus company.
We estimated the number of users P for the target area according to the population and age by
P = population of area × ap (person)
Here, ap = the use rate of people at the kind of age (based on the data from the bus company).
The income of the bus area Cgain can be predicted by

Here g is the income for one bus line including financial aid and advertisement support (JPY/Person).
If the income of the bus area Cgain is larger than the Centerprise, the project gets the profit and we say this line is “OK”, otherwise we say the line is “OUT”.
All the simulation was calculated in the GIS platform.
5.3. Discussion of New Traffic Service
Service time: 5 days one week, 8 hours one day, 250 days one year. Eight percent of elders (older than 65 ages) of target area will use the new traffic service, according to the data statistic of Bus Company.
Charge of standard service: 23,400 Yen; Charge of subvention: 20,500 Yen; Charge of advertisement sponsorship: 20,100 - 16,500 Yen. According to the assumed conditions, profit of the new route in 2015 is simulated based on GIS technology (Table 1). “Out” means no profit under the designated condition. Therefore, in Iwai- machi area, there is no profit even with financial aid or advertisement support due to the lack of population. Profit of the 10th route under the assumed conditions is estimated by using amount of 2nd route by the 2015 will be increased because of increasing of elder’s percent, which indicates that 12th route will obtain more profit. If charge of other routes can be sponsored by the advertisement agencies, possibility of getting profit will be en- sured (Figure 7).
6. Conclusions
In this paper, we try to present a method to verify the traffic blank and inconvenient area in Kitakyushu city.
The six cases were selected to evaluate the traffic system. Based on the data of registered permanent residence, timetables of railway and road, urban management information of Kitakyushu, this study established the GIS database and illustrated the relationship between the public traffic departments and population divisions. Addi- tionally, the regions without enough existing traffic establishments were identified. Moreover, the essential terms and considerations were put forward to simulate the verifying methods for new routes of public traffic

Table 1. Profit of new route in 2015.
departments. However, recently price of fuels has remarkably increased, which led to the considerations again and again on arranging the outlay. We selected 22 areas to predict the profit by introducing a new bus line and gave a judgment to establish a new bus line.
In the future, we will add some GIS databases concerning about the buildings and circulating destinations, and will investigate the relations among these data; meanwhile, it is necessary to emphasize the influencing factors in the research method of new routes.
Acknowledgements
This research was based on data from the project of Kitakyushu Transportation Bureau. We would like to ex- press our thanks to Kitakyushu city.
References
- Thong, C.M. and Wong, W.G. (1997) Using GIS to Design a Traffic Information Database for Urban Transport Plan- ning. Computers, Environment and Urban Systems, 21, 425-443. http://dx.doi.org/10.1016/S0198-9715(98)00003-9
- Arampatzis, G., Kiranoudis, C.T., Scaloubacas, P. and Assimacopoulos, D. (2004) A GIS-Based Decision Support System for Planning Urban Transportation Policies. European Journal of Operational Research, 152, 465-475.
- Mavoa, S., Witten, K., McCreanor, T. and O’Sullivan, D. (2012) GIS Based Destination Accessibility via Public Transit and Walking in Auckland, New Zealand. Journal of Transport Geography, 20, 15-22. http://dx.doi.org/10.1016/j.jtrangeo.2011.10.001
- Sun, J. (Daniel), Liu, Q. and Peng, Z.R. (2011) Research and Analysis on Causality and Spatial-Temporal Evolution of Urban Traffic Congestions―A Case Study on Shenzhen of China. Journal of Transportation Systems Engineering and Information Technology, 11, 86-93.
- Wahl, C. (2013) Swedish Municipalities and Public Participation in the Traffic Planning Process―Where Do We Stand? Transportation Research Part A: Policy and Practice, 50, 105-112. http://dx.doi.org/10.1016/j.tra.2013.01.012
- Lee, W.-H., Tseng, S.-S. and Shieh, W.-Y. (2010) Collaborative Real-Time Traffic Information Generation and Sharing Framework for the Intelligent Transportation System. Information Sciences, 180, 62-70. http://dx.doi.org/10.1016/j.ins.2009.09.004
- Kitakyushu City (2014) Population. http://www.city.kitakyushu.lg.jp/soumu/file_0373.html