Advances in Materials Physics and Chemistry
Vol.3 No.1A(2013), Article ID:30348,18 pages DOI:10.4236/ampc.2013.31A010
High Resolution X-Ray Diffraction Analyses of (La,Sr)MnO3/ZnO/Sapphire(0001) Double Heteroepitaxial Films
1X-Ray Research Laboratory, Rigaku Corporation, Tokyo, Japan
2Graduate School of Engineering, Mie University, Mie, Japan
3Adwel R&D Co., Ltd., Shiga, Japan
4Department of Physics, Sri Venkateswara Degree College, Kadapa, India
Email: inaba@rigaku.co.jp
Copyright © 2013 Katsuhiko Inaba et al. This is an open access article distributed under the Creative Commons Attribution License, which permits unrestricted use, distribution, and reproduction in any medium, provided the original work is properly cited.
Received January 20, 2013; revised March 8, 2013; accepted April 14, 2013
Keywords: X-Ray Diffraction; Heteroepitaxy; LSMO/ZnO; Orientational Relations; In-Plane XRD; Reciprocal Space Mapping
ABSTRACT
Thin films of (La,Sr)MnO3 (LSMO) were deposited on ZnO underlayer on sapphire (Sap) substrate by ion beam sputtering at the growth temperatures from 650˚C to 750˚C with supply of either plasma oxygen or molecular oxygen. The epitaxial relationships of lattices and crystalline qualities of LSMO/ZnO/Sap double-hetero systems were extensively analyzed by means of X-ray diffraction techniques with a modern high resolution XRD system. The epitaxial growth of out-of-plane (110) phase of the LSMO overlayer on the (0001) ZnO underlayer on the (0001) sapphire substrate is promoted at the higher temperatures accompanying the suppression of other competitive growth of the LSMO (001) and (111) phases. The plasma oxygen supply more enhances this suppression of the LSMO (111) phase at 750˚C. The complex in-plane orientational relationships of these three phases were clarified by the precise analyses based on various measurements of high resolution out-of-plane XRD and in-plane XRD, pole figure, and reciprocal space mappings. They are summarized as follows.  ,
,  , and
, and  (μ-mode), where the notations such as
  indicate the in-plane crystalline directions. The two possible configurations of LSMO (111) phase were discussed. These relationships were confirmed also by the data analyses of out-of-plane wide-range reciprocal space mappings using the 2-dimensional X-ray detector.
1. Introduction
Various combinations of oxide thin films have been studied for fabrications of new functional devices. Perovskite (La,Sr)MnO3 (LSMO) manganate shows versatile electrical and magnetic properties such as colossal magnetoresistance [1] and is a p-type semiconductor at higher temperatures. While ZnO is an n-type widegap semiconductor which is studied as transparent conductive oxide for thin film transistors and display applications, since it is transparent for visible light but absorbs UV light. We are trying to obtain a novel p-n heterojunction of LSMO/
ZnO system whose characteristics can be modified by magnetic field, temperature and UV light [2]. For these purposes, the controls of the crystalline orientations of these materials are crucial to obtain superior and controllable junction characteristics.
Bhosle and Narayan [3] investigated an epitaxial growth of an (110) out-of-plane oriented LSMO directly on a cplane sapphire (Sap), and reported the epitaxial orientational relationship as
 . In this article, we define (110) and (0001) as the surface planes which show the out-of-plane crystalline orientations of the grown thin film, and
  and
and  as the crystalline axes parallel to the surface planes which show the inplane crystalline orientations of the films, respectively, hereafter. The lattice matching between the LSMO film and the sapphire substrate for the case of Bhosle and Narayan is expected to be good since
  = 0.13753 nm (
 = 0.3890 nm) is very close to
  = 0.13746 nm (
 = 0.4762 nm). However, the lattice mismatch in the perpendicular direction within the surface plane is as high as 19%. They reported that this relatively large mismatch was accommodated by matching of four (200) planes of the LSMO films with five
  planes of sapphire.
In our case, the lattice mismatch should be considered between LSMO films and ZnO underlayers. The interplanar distances of major lattice planes perpendicular to the surface plane are  = 0.27506 nm and
  = 0.19450 nm for the LSMO films, and
  = 0.16250 nm and
  = 0.28146 nm (
 = 0.3250 nm) for the ZnO underlayer. A small lattice mismatch of −2.2% is expected by the coincidence of
  and
and , and also a lattice mismatch of 20% is expected by the coincidence of
  and
and . Thus, the epitaxial growth of the LSMO film on the ZnO underlayer with the epitaxial orientation of
  is expected. A relatively large mismatch along LSMO [001] direction would be accommodated by matching of four (200) planes of the LSMO films with five
  planes of ZnO underlayers. Thus some improvement of the crystalline quality of LSMO epitaxial layer can be expected. Further, we propose that the in-plane orientation of LSMO against the sapphire substrate can be controlled by insertion of intermediate ZnO layer.
In this study, we try to extensively analyze lattice relationships of epitaxial growth and crystalline qualities in the LSMO/ZnO/sapphire double-hetero system. We use here X-ray Diffraction (XRD) technique with the modern high resolution XRD systems, such as out-of-plane 2θ-θ XRD scans, ω rocking curves, in-plane XRD scans, f rocking curves, pole figure measurements, and reciprocal space mappings.
2. Experimental
2.1. Thin Film Fabrications
The thin films of (La,Sr)MnO3 (LSMO) overlayer were epitaxially grown on the ZnO underlayer on the (0001) sapphire (Sap) substrate by ion beam sputtering technique. Molecular oxygen (ML) or plasma oxygen (PL) was supplied during the growth. Deposition conditions for the LSMO overlayer were varied as a function of the substrate temperature (Ts: 650˚C - 750˚C) and the oxygen partial pressure (Po). Details of the film fabrication can be referred in the previous papers [1,4].
Four LSMO/ZnO/Sap double-hetero epitaxial films were mainly studied in this article. Two of them are termed as PL-LT and PL-HT in which the LSMO films were grown at the low Ts (650˚C) and high Ts (750˚C) with the supply of plasma oxygen, respectively. The other two are termed as ML-LT and ML-HT in which the LSMO films were grown at the low Ts (650˚C) and high Ts (700˚C) with the supply of molecular oxygen, respectively. Many other double-layer films grown at different deposition conditions were also characterized to give deliberate and correct discussions, while the experimental results are not shown for these samples in this paper.
2.2. XRD Analysis
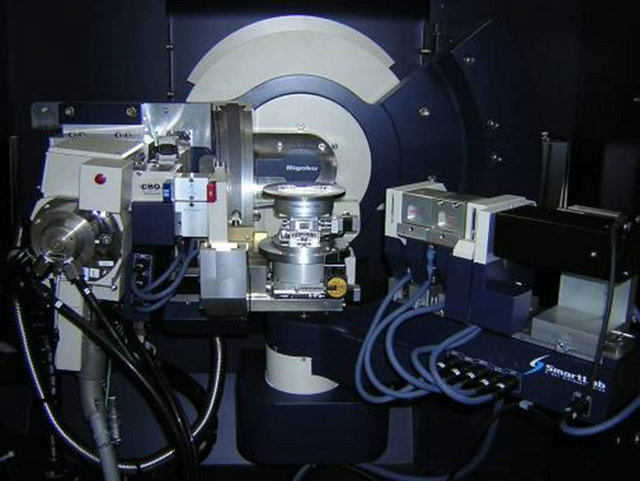
All the XRD measurements were performed with the “SmartLab” diffractometer system (Rigaku Corp.) [5], equipped with high power 9 kW Cu rotating anode generator (Figure 1(a)). The sample is manipulated with 3- circles (ω, χ, f) and the detector is moved with 2-circles (2θ and 2θχ). The goniometer configuration is schematically shown in Figure 1(b). The samples of LSMO/ ZnO/Sap films were extensively analyzed with this XRD system in terms of their crystalline qualities (mosaic spreading; tilt and twist), lattice strains, and orientational relationships between LSMO and ZnO/sapphire substrate. We employed various measurement techniques, such as out-of plane XRD measurements and X-ray Rocking Curves (XRCs), in-plane XRD measurements and XRCs, Pole Figure (PF) measurements, and out-of-plane wide-range Reciprocal Space Mapping (RSM) using the 2-dimensional (2D) X-ray detector. These techniques should be briefly mentioned in this section.
2.2.1. Out-of-Plane XRD Measurements: 2θ-θ Scans and ω-Scans
For the high resolution XRD analysis with double axis geometry, a Ge220-2bounce channelcut monochromating collimator was employed in the incident optics to use the CuKα1 radiation (λ = 0.154059 nm) [6,7]. A resolution of optics for XRC was confirmed to be better than 0.004 deg by the rocking curve measurement for the sapphire 0006 reflection. The 2θ-θ scans were performed to detect diffraction signals arising from the lattice planes parallel to the sample surface plane as shown in Figure 2, which give the information of preferential growth axes (lattice planes) of the LSMO overlayer (and ZnO underlayer). The ω-scan rocking curve measurements were performed on the LSMO peaks to evaluate the tilt mosaic spreading of LSMO overlayer.
 (a)
(a) (b)
(b)
Figure 1. (a) An over view of the 5-circle thin film X-ray diffractometer equipped with the 2θc axis (SmartLab); (b) A schematic illustration of 5-circle goniometer system.
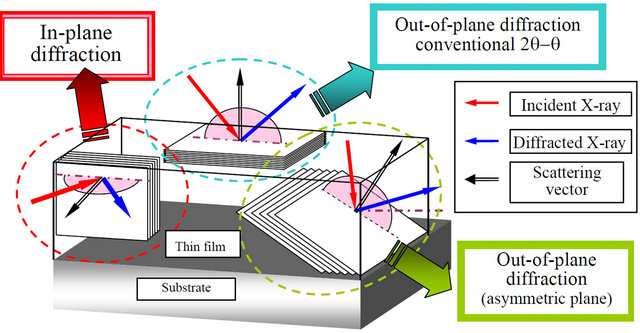
Figure 2. A schematic diagram of the geometries of thin film X-ray diffraction measurement, showing relations between the lattice planes of a thin film sample and X-ray geometries.
2.2.2. In-Plane XRD Measurements: 2θχ-( Scans, (-Scans, and In-Plane Reciprocal Space Mappings
The in-plane XRD is a powerful technique for thin film characterizations, since this technique is geometrically sensitive to film surface layers. Further we can directly access to the lattice planes perpendicular to the film surface which is illustrated in Figure 3 as well as Figure 2 [8-12].
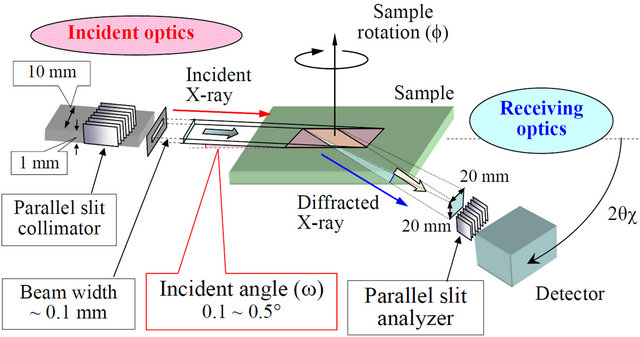
Regarding the surface sensitivity, the divergence of the incident X-ray beam in the normal direction to the sample surface greatly affects the sensitivity, which is indicated by vertical arrows in Figure 3(b). Therefore, the in-plane XRD measurements with SmartLab were performed by controlling the incident angle (ω) to the sample surface plane in the accuracy of around 0.01 deg. There we utilized the well shaped parallel incident X-ray beam formed by the parabolic multilayered mirror, using CuKα radiation (λ = 0.154186 nm as the weighted average of CuKα1 and CuKα2). This measurement with the grazing incidence beam geometry was performed by the sample rotation with f-axis and detector motion of 2θχ, while the sample was kept on the horizontal plane without tilting the sample by χ-axis (Figure 1(b)). In this article, the incident angle to the sample surface in the in-plane XRD measurements was set to be around 0.32 deg which is close to the angle for the total external reflection of LSMO [8,11].
A resolution of the in-plane XRD profiles should depend on the optical elements employed, such as the Parallel Slit Collimator (PSC) in the incident side, and the Parallel Slit Analyzer (PSA) in the receiving side (Figure 3). The horizontal resolution of 0.50 deg was set in this study. The direct accessibility of this technique to the lattice planes perpendicular to the sample surface plane enables us to analyze the in-plane lattice constants directly by the coupling motion (2θχ-f) of detector (2θχ) and sample rotation (f). Moreover, the directional distributions of perpendicular crystalline planes near the surface plane (i.e., twist mosaic spreading) can be evaluated from the peak width of profiles for the sample rotation (f), while the detector is positioned at fixed 2θχ angle. As illustrated in Figure 3, the in-plane reciprocal space mapping (in-plane RSM) measurements were performed by the iterative motions of incremental step of Δf and 2θχ-f scans [11].
2.2.3. Pole Figure Measurements Using the In-Plane Axis [13]
The pole figure (PF) measurement is an indispensable technique for the characterization of orientational relationships in the complex heteroepitaxial thin film systems. A sample is generally manipulated with tilting and rotated with f-axis while keeping the 2θ-θ configuration. This geometry is called as a skew geometry, where the angles of the incident X-rays and exit X-rays to the sample surfaces should be kept identical. The χ-axis is commonly used for tilting a sample in usual PF measurements in a case of conventional XRD systems. However, in the present PF measurement using the in-plane axis, the lattice planes inclined to the surface plane can be accessed by the tilting motion through the combining motions of 2θ and 2θχ, without tilting the sample. As can be easily seen from the schematic illustration of the goniometer
 (a)
(a) (b)
(b)
Figure 3. (a) A schematic illustration of goniometer setup and motion for in-plane XRD measurements; (b) ) A schematic illustration of the incident optics setup for in-plane XRD measurements using a parabolic multilayer X-ray mirror.
motion in Figure 4, a whole hemisphere pole figure measurement is accomplished with this PF measurement using the in-plane axis. The azimuthal angle (β) is denoted for the relative angle of f from the referential azimuthal direction of a sample, for example,  axis of the sapphire substrate. The same configuration of the optics is employed with that for the in-plane XRD measurement (Figure 3). This is the strong merit of this system we improved for precise in-plane measurements. We measured the PF on the present samples using this novel inplane system.
2.2.4. Out-of-Plane Wide-Range Reciprocal Space Mapping Using the 2D X-Ray Detector [14]
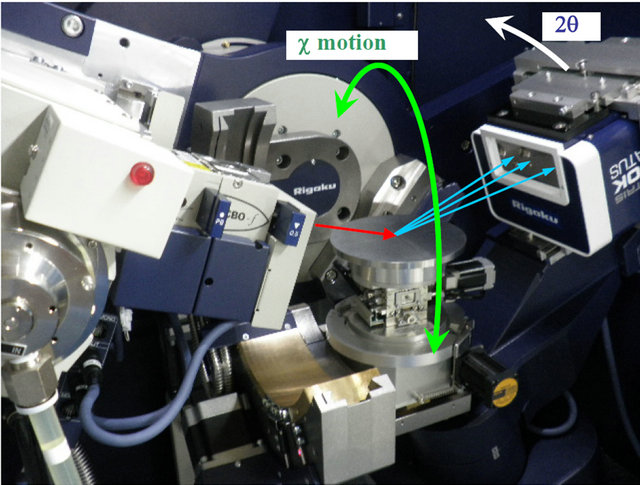
The RSM measurements were complementarily done to cover the PF measurements for the characterization of orientational relationships in the complex heteroepitaxial thin film systems. The RSMs of wide angular ranges can be measured using the 2D detector and point-shaped incident X-ray beam as shown in Figure 5(a). The PILATUS 100K/R 2-dimensional solid-state semiconductor detector is employed in this measurement, instead of a 0-dimensional scintillation detector. The CBO-f device [14] is employed in the incident optics, which acts as a converter of the line-shaped X-ray beam to the point -shaped X-ray beam (diameter of around 0.4 mmf). The photograph of this system is shown in Figure 5(a).
Both of the RSM and the PF measurements should access to the lattice plane inclined with ψ with respect to the sample surface as illustrated in Figure 5(b). Due to the geometrical restriction to keep the skew geometry (2θ-θ geometry), the sample is tilted with the χ-axis, while the 2D detector was scanned with time-delayed integration (TDI) mode (Figure 5(b)). The area of RSM measured by this mode is painted in red where the diffraction vector is marked by a red arrow in Figure 5(b). For a comparison, the area of RSM measured by the conventional mode of ω-shift and 2θ-ω scan is shown as a sector colored in blue. In this mode, the sample is tilted with the ω-axis, instead of the χ-axis, which is a so-called co-planar ge-
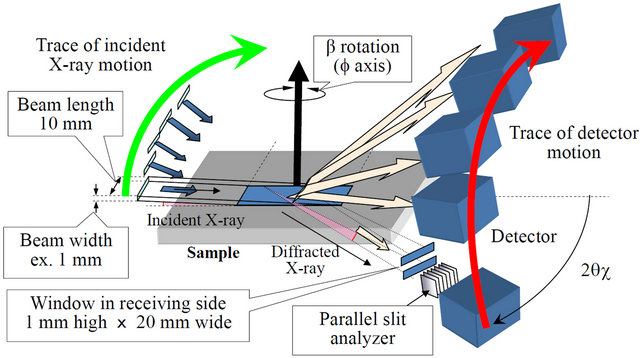
Figure 4. A schematic illustration of the goniometer motion for PF measurement using the in-plane axis.
ometry (Figure 5(b)). An optical resolution to the tilting direction in this mode is defined with the divergence of the incident optics to the omega direction, and the higher resolution is expected when the monochomating collimator is employed. The area of in-plane RSM is shown as a section colored in green. The capture angles in the χ tilting direction for a single 2θ-ω scan with the 2D detector was set as ±7.5 deg with a sample-detector distance of 150 mm.
The wide range RSM data can be obtained by iterative motions of the goniometer for small χ steps and 2θ/ω scans. The 2D data should be shown either in the goniometer coordinates (the two coordinate axes are tilting angles (χ) and 2θ angles) or in the reciprocal space coordinates. The two orthogonal axes are employed in a scale of the reciprocal unit (1/Å is used in this study), those are the direction along the surface plane and the direction normal to the surface plane.
3. Results and Discussion
3.1. Out-of-Plane XRD Measurements
Figure 6 shows the out-of-plane 2θ-θ scan profiles for the four samples. The LSMO overlayer peaks of 110, 111, 002, 220, 222 reflection can be clearly observed as well as 0002 and 0004 reflections from the ZnO underlayer, and 0006 reflections from the sapphire substrate. A sharp peak at 2θ = 64.5 deg is the 0009 reflections from sapphire substrates, which is intrinsically the forbidden reflections but actually observed due to the effect of multiple reflections [15]. From these data, it is assumed that phases with three different preferred orientation textures competitively exist in the LSMO overlayer grown on the ZnO underlayer on the (0001) sapphire substrate. These are, (110) growth phase, (111) growth phase and (001) growth phase (represented by 002 reflection peak). Hereafter we denote these out-of-plane oriented LSMO phases as the (110) phase, (111) phase and (001) phase. Extended profiles around the peaks of LSMO 110, 111 and 002 reflections are shown in Figures 7(a)-(c), respectively. The peak intensities of LSMO 110 of PL-HT and ML-HT are several times stronger than those of PL-LT and ML-LT. This indicates that the LSMO (110) growth is greatly promoted at the higher Ts (700˚C and 750˚C) than at the lower Ts (650˚C). Looking at the 111 peaks, the intensity for ML-HT is much stronger than that for ML-LT and PL-LT. Conspicuously the 111 peak for PL-HT cannot be observed. The 002 peak intensity for ML-HT is weaker than that for PL-LT and ML-LT. The 002 peak for PL-HT cannot be observed again.
It is quite clear that the (110) phase growth is much promoted at the higher temperature than at the lower temperature, contrary the (001) phase growth is promoted at the lower temperatures than at the higher temperatures. This must be resulted from a different lattice matching between the LSMO overlayer and ZnO underlayer. Probably the LSMO (110) phase has the better lattice matching at the higher temperatures, while the LSMO (001) phase has the better lattice matching at the lower temperature due to different thermal expansion rates of these lattices. It was partially reported by our previous paper [4]. However, the LSMO (111) phase behaves curiously. It is promoted at the higher temperatures up to 700˚C, but it cannot be grown at 750˚C. Exactly speaking, at 750˚C
 (a)
(a)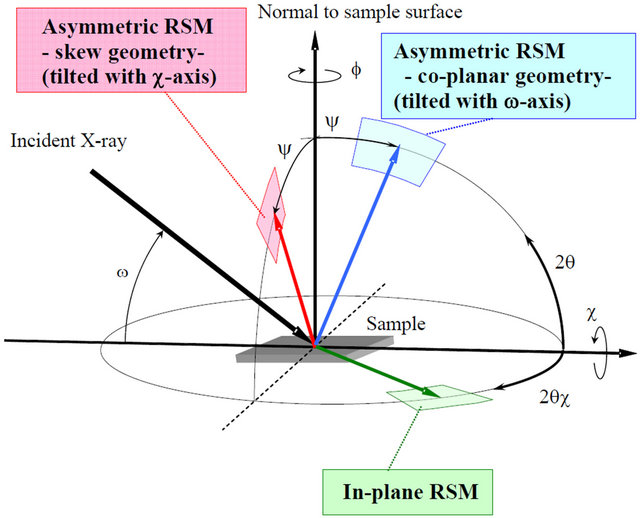 (b)
(b)
Figure 5. (a) A photograph of SmartLab system equipped with the 2D detector for the wide-range reciprocal space mapping measurement. The incident X-ray beam is shown by a red arrow, and the diffracted X-ray beams are shown by blue arrows. Tilting motion for the sample with χ-axis is shown by a curved green arrow; (b) Geometry of the reciprocal space mapping measurement.
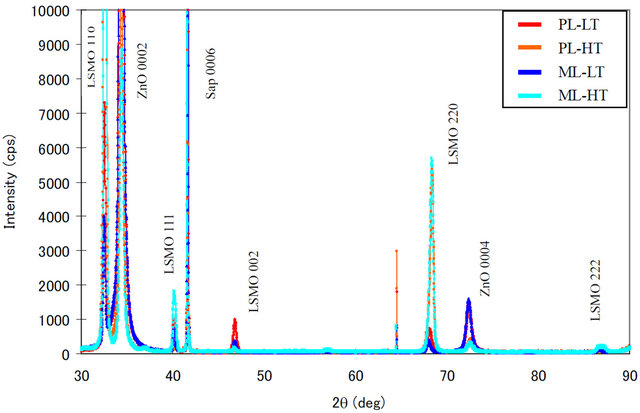
Figure 6. Out-of-plane XRD: 2θ-θ scan profiles for the four samples. The horizontal axis is shown in 2θ angle (deg), and the vertical axis is the intensity in counts per second (cps) unit with linear scale.
LSMO (111) phase can be grown faintly under the molecular supply, while it cannot be grown at all under the plasma supply. We can recognize an outstanding rule of the plasma effect for the three phases. The growth is always enhanced by the plasma when the temperature is low, on the contrary, the growth is always suppressed by the plasma when the temperature is high. This clearly indicates that the crystalline formation energy is supplemented by the plasma energy when the thermal energy is insufficient. The plasma energy, however, gives excess energy when the thermal energy is sufficient, leading to decomposition of LSMO crystal structure. This must be the reason why the LSMO (111) and (001) phases cannot be grown at the higher temperature of 750˚C under the plasma supply.
It should be noted that as shown in Figure 7(d) asymmetric tailing of the peaks to the lower angles in 2θ can be observed for the 220 reflections of PL-HT and ML-HT grown at the higher temperatures. We decomposed the (220) peak of ML-HT as schematically shown by two broken curves. This tail in the lower 2θ angle is found to be overlapping with the peaks of the other samples of ML-LT and PL-LT grown at the lower temperature. Further, a doublet peak is clearly observed in the higher order 222 reflection of ML-HT in Figure 7(e), which apparently implies two phases with closely different lattice constants exist in the LSMO overlayer. Estimated lattice constants from these peaks are a = 0.3890 (±0.0003) nm for PL-HT and a = 0.3875 (±0.0003) nm for ML-HT after the deconvolution analysis of the 220 reflections. The value of a = 0.3875 nm is smaller than the bulk value, which is expected to arise from near-interface domains of the LSMO layers being constrained by the ZnO/sapphire. This is resulted from the lattice matching epitaxial growth of promoted (110) phase. This might cause elastic shrinkage of the LSMO lattices along the growth direction due to the tensile stress near the interface. On the contrary, the larger value of a = 0.3890 nm is close to that estimated from the peaks for PL-LT and ML-LT, and this value coincides with that of the bulk LSMO.
The orientational distribution of the crystallite axis of the (110) phase can be analyzed from the tilt spreading in the ω rocking curve profiles for the LSMO 110 reflections shown in Figure 8. Full Width at Half Maximum (FWHM) values are around 2.0 deg for the four samples, which are matched to the FWHM values for ZnO 0002 reflections (not shown here). Thus it is supposed that the tilting of the overlayer LSMO (110) phase is grossly limited by that of the ZnO underlayer. Looking the curves carefully, we notice the same rule with the above. The FWHM value is smaller for the higher temperatures than for the lower temperature samples, implying that the LSMO with better mosaic spreading can be grown at the higher temperatures. At the higher temperature, the LSMO with better crystalline quality can be grown by the molecular supply than by the plasma supply, implying that the plasma gives the excess energy for the crystal growth at the higher temperature. On the contrary, the better mosaic crystalline LSMO can be grown by the plasma supply than by the molecular supply at the low temperature. It implies that the plasma energy can supplement the
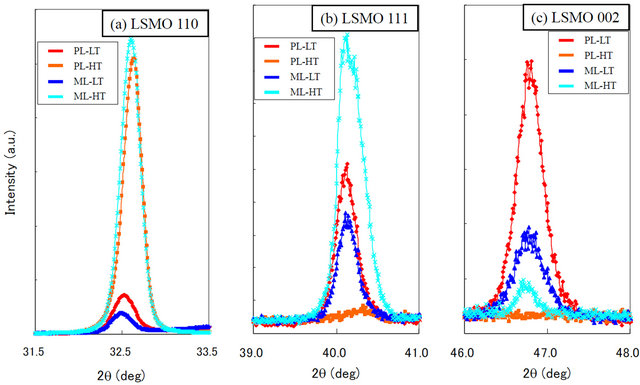
(a) LSMO 110 reflections (b) LSMO 111 reflections (c) LSMO 002 reflections

(d) LSMO 220 reflections (e) LSMO 222 reflections
Figure 7. Extended 2θ-θ profiles of the LSMO (110), (111) and (001) phases in Figure 6. (a) LSMO 110 reflections; (b) LSMO 111 reflections; (c) LSMO 002 reflections; (d) LSMO 220 reflections; (e) LSMO 222 reflections. Two black broken curves in Figure 7(d) are schematically shown as the deconvoluted peaks of the sample ML-HT for eye guide.
shortage of the thermal energy when the thermal energy is insufficient, leading to the better mosaic crystallinity.
An inset in Figure 8 is a rocking curve profile for the sapphire 0006 refection. The FWHM value of this peak is 0.0035 deg, which corresponds to the resolution of the present optics.

Figure 8. High resolution ω rocking curve profiles for the LSMO 110 reflections for the four samples. Horizontal axes are shown in the relative angles of ω in degree. Vertical axes are shown in the normalized intensity with the peak top intensity. The inset shows a rocking curve profile for the sapphire 0006 refection. This gives a resolution of the employed optics as around 0.0035 deg in FWHM.
3.2. In-Plane XRD Measurements
In-plane Reciprocal Space Mapping (RSM) data [11,16, 17] for the four samples are shown in Figures 9(a)-(d) with the reciprocal space coordinates in the unit of 1/Å. In these figures, the horizontal axis is aligned to  axis of the sapphire substrate and also to
  axis of the ZnO underlayer, and the vertical axis is aligned to
  axis of the sapphire substrate and also to
  axis of the ZnO underlayer.
The 2θχ-f coupled scans, which should correspond to the 2θ-θ scans for the out-of-plane XRD, sweep the directions in the reciprocal space radially from the origin of reciprocal space. That is, we sweep by the iterative motions of incremental step of Δf and 2θχ-f coupled scans. (the 2θχ scan under various fixed f with infinitesimally small interval). The 2θχ corresponds to the distance between the vertical crystalline plane, and the f corresponds to the in-plane direction of this crystalline plane. An example of the traces of 2θχ-f coupled scans is demonstrated by a red broken arrow in Figure 9(a). The circumferential position denotes the azimuthal angle (β), which is traced with an arc of yellow solid curve in Figure 9(a). The orientational distribution of the vertical lattice plane receives the circumferential direction in this figure, that is, the distribution traces an arc with a fixed equidistance (corresponding to a d-value) from the origin.
Here we mention first on the mosaic spread of twisting, that can be evaluated by the in-plane rocking curve (f-scan) profiles in this measurement system. The in-plane rocking curve profiles traced from these 2D figures in Figures 9(a)-(d) for the 110 reflections of LSMO are shown in Figure 10 for the four samples. The FWHM values for the samples of PL-LT and ML-LT grown at the lower temperature are around 5.0 deg. These peaks with rather wide width indicate that the vertical (110) lattice plane is basically oriented in certain directions (exactly mentioned later) but should have some distribution in the film plane. In other word, the crystallites (having the out-ofplane orientations of (001), (110) and (111)) are basically in-plane aligned but exhibit slight dispersion within surface planes at some extent. We can recognize faint rings in Figures 9(a) and (c) for the samples of PL-LT and ML-LT. These rings imply an existence of small amount of randomly distributed components of the grains. Then it should be noted that the films grown at the lower temperature have both of the fundamentally aligned major grains and the randomly distributed minor grains.
In contrast to the wide spread of FWHM observed in the samples of PL-LT and ML-LT, the FWHM values in the samples of PL-HT and ML-HT grown at the higher temperatures are rather small as around 2.0 deg, and it is close to the value for  reflections of the ZnO underlayer (not shown here). It is supposed from these facts that the twisting of LSMO film follows that of ZnO underlayer during the film growth of LSMO at the higher temperatures. However, such constraint of the LSMO lattice from the ZnO lattice is not so strong at the lower temperature. Due to this relaxation, the LSMO films grown at the lower temperature have the larger spread of twisting. This gives a very important knowledge concerning the in-plane orientations in the epitaxial growth.
The lattice constant of LSMO along the in-plane direction can be determined as a = 0.389 - 0.390 nm from the 110 reflections. These values are almost the same with


(a) Sample PL-LT (b) Sample PL-HT


(c) Sample ML-LT (d) Sample ML-HT those estimated by the out-of-plane 2θ-θ measurement mentioned above. We would like to mention here, the crystallinity (i.e., twist) of the LSMO overlayer can be improved by inserting the ZnO underlayer with the smaller lattice mismatch between the LSMO overlayer and the sapphire substrate with the larger lattice mismatch, compared with the case of direct growth of LSMO on the sapphire substrate [3].

Figure 10. In-plane f-rocking curve profiles for the LSMO 110 reflections of the four samples.
indicated in Figures 9(a)-(d) appearing on each equidistant circumference. However, it should be noted that each grain does not always have all these three vertical planes, for example, the (001) grain does not have the vertical (111) plane. The LSMO has the cubic symmetry and the (001) phase should show four-fold symmetry within the surface plane, basically. However, as mentioned later, the LSMO has three equivalent alignments on the (0001) ZnO with the hexagonal symmetry showing six-fold symmetry. Then the LSMO does not always show the exact four-fold symmetry, but shows apparent six-fold like symmetry.
The 111 reflection is only related to the (110) grain, then it is efficient to analyze the in-plane orientational relationships using the 111 reflection first. The azimuthal angles β corresponding to the diffraction spots from the cubic LSMO, should appear at Bhosle and Narayan [3] reported as
 . The in-plane relation of the lattice orientation of our
 is the same with that of their [1-10](110)LSMO//[1-100](0001)Sap in the system of rectangular on hexagonal lattices. However, the relation between LSMO and sapphire substrate is different. Then it is important that we can control the orientation of LSMO against the sapphire substrate by
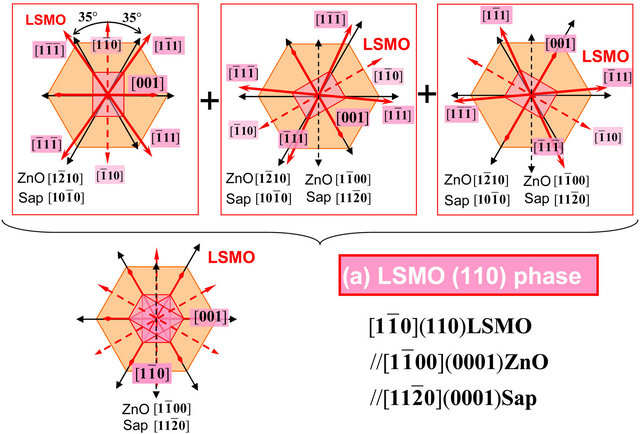

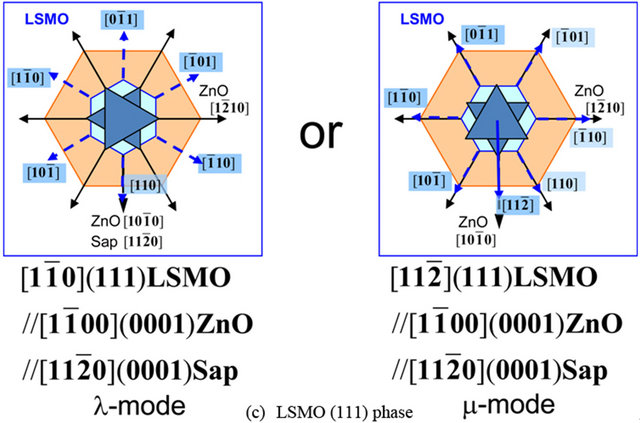
Figure 11. Schematic illustrations of the in-plane axes alignments of LSMO lattices of the three phases against the ZnO and sapphire lattices. The ZnO hexagonal lattices are shown in orange hexagons. (a) LSMO (110) phase: the LSMO lattices are shown in red rectangles, principle axes of LSMO are shown in red arrows; (b) LSMO (100) phase: the LSMO lattices are shown in green squares, principle axes of LSMO are shown in green arrows; (c) LSMO (111) phase: The overlayer LSMO lattices are shown in dark blue triangles, and principle axes of LSMO are shown in blue arrows. The two apparent triangles are shown for the 3-dimensional unit cell of LSMO (111) phase, because when the (111) grain is viewed from the top, we see one triangle, but when it is viewed from the bottom, we see the other triangle with 60 deg rotation. There are two possible arrangements, λ-mode and μ-mode, of the (111) phase as shown. The λ-mode is expected by the results of in-plane XRD shown in Figure 9, but we cannot exclude the possibility of μ-mode.
inserting the intermediate buffer layer.

For our visual comprehension, we show in Figure 12 the 3D pictures for the out-of-plane and in-plane epitaxial orientations of three LSMO phases over the ZnO underlayer on the sapphire substrate. Regarding the (111) phase, only the possible μ-mode is shown here.
Faint spots marked by white broken circles in Figures 9(b) and (d) can be identified as the  diffraction spots from ZnAl2O4 spinel phase. Dovienko et al., [18] and Wessler, et al., [19] reported the epitaxial growth of this phase in the vicinity between ZnO epitaxial film on the c-sapphire substrate, with the epitaxial orientation of
 . In our study, the same in-plane orientation with these reports was observed in the two samples of PL-HT and ML-HT grown at the higher temperatures. This ZnAl2O4 spinel phase is probably formed at the interface of ZnO underlayer and sapphire substrate as a very thin layer. The detection of this signal verifies the excellent in-plane sensitivity of the in-plane XRD technique.
3.3. Pole Figure Measurements Using the In-Plane Axis
In order to further clarify the epitaxial orientations of the (111) phase of LSMO overlayer, we performed the pole figure (PF) measurements for the LSMO 111 reflections. We should remind here that the (111) phase does not have the vertical (111) plane in its grain, then we cannot adopt the in-plane measurement. That is a reason why we adopt the pole figure measurement to detect the 111 reflection from the (111) phase. The choice of 111 reflections is based on two conditions. One reason is that the orientational relationships can be easily deduced from their diffraction spot positions in the PF data with respect to the lattices of ZnO underlayer and sapphire lattices. The other reason is that there are no reflections in the vicinity of 2θ value for this reflection (around 40 deg). The only exception is the sapphire 0006 reflection whose 2θ value is 41.68 deg. But its position to be appeared in

Figure 12. Three dimensional views of the orientational relationships of lattices for the three phases of LSMO on the (0001) ZnO on the (0001) sapphire substrate. Only the μ-mode configuration is shown for the (111) phase.
the PF data is already known well (at the center position of the PF data), and this might not be an obstacle for the orientational analysis of the LSMO overlayer.
We focused on comparison of the PF measurements for the samples of ML-LT and ML-HT to analyze this problem. The experimental results of diffraction spots are shown in Figures 13(a) and (b) for the 111 reflections from the (111) phase of ML-LT and ML-HT, respectively. These 2D data are shown in polar coordinates [20], where the tilting angles (radial direction: α) and the azimuthal angles (circumferential direction: β) are swept. If we define the tilting angle of a lattice plane from the sample surface plane as ψ (see Figure 5(b)), ψ = 0 deg corresponds to lattice planes parallel to the surface plane, and ψ = 90 deg corresponds to lattice planes perpendicular to the surface plane. Figures 13(a) and (b) are shown with polar coordinates with α and β [12], where, α is defined as α = 90 – ψ, and β is the azimuthal angle from the direction where one of  sapphire reflections is observed. We should note that the diffraction signals can be clearly found in the whole range of α, that is, α = 0 deg (corresponding to the in-plane XRD geometry) to α = 90 deg (corresponding to the 2θ-θ scan geometry). This means that the signal covers the whole hemisphere of a diffraction space.
The symbols used in these figures are the same as shown, for example, in Figure 12. Red arrows indicate the directions of  axes of sapphire and
  axes of the ZnO underlayer. A circle in red indicates the tilting of 70 deg (α = 20 deg), and a dotted circle in white indicates the tilting of 35 deg (α = 55 deg). Peaks at α = 0 deg (corresponding to the in-plane geometry) and those at α = 55 deg can be attributed to the LSMO (110) phase (see Figure 12). Peaks at α = 20 deg are originated from the LSMO (111) phase. The latter peaks are observed at the same β positions with those for the
  reflections of sapphire. This result reveals that the
  axis of LSMO (111) phase is aligned to the
  axis of sapphire substrate but not the
  axis. Consequently, the epitaxial orientation for the (111) LSMO (111) phase can be determined as


 . This is termed as the μ-mode and shown in Figure 11(c) which is equivalently noted as
 .
.
3.4. Out-of-Plane Wide-Range Reciprocal Space Mapping Using the 2-Dimensional X-Ray Detector
Lastly we tried to confirm the validity of the epitaxial orientational relationships mentioned above by an alternative measurement. That is, out-of-plane wide-range RSM measurements were performed using the 2D detector for the samples of ML-LT and ML-HT. The results are shown in Figures 14(a) and (b) for the ML-LT and


Figure 13. The pole figures obtained from the measurements using the in-plane axis of LSMO 111 reflections for the samples (a) ML-LT and (b) ML-HT. The red arrows indicate the directions of  axes of sapphire substrate and
  axes of the ZnO underlayer. The detected intensity is scaled in log scale. A red circle indicates the tilting of 70 deg from the surface plane, and a broken circle indicates the tilting of 35 deg from the surface plane. The center of the figure corresponds to the measurement of 2θ-θ scans, where lattice planes are parallel to the sample surface plane. The outer circle corresponds to the vertical plane diffraction obtained by the in-plane XRD measurement.
ML-HT, respectively. The horizontal axisqxcorresponds to the directions of  axis of sapphire substrate and
  axis of the ZnO underlayer, and the vertical axis qzcorresponds to the directions of
  axis of sapphire and ZnO. The detected intensity is scaled in log scale.All the diffraction peaks in Figures 14(a) and (b) can be indexed by the above mentioned epitaxial orientational relationships as shown in the figures.The positions of all the peaks are in good coincidence with the peak positions determined above.Consequently this measurement provides the validity of the above measurements and analyses..
All the peaks in Figures 14(a) and (b) can be indexed with a present model of epitaxial orientational relationships, and the positions of all these peaks are in good coincidence with peak positions estimated from the model, proving the validity of this model.
4. Summary
The LSMO overlayer was grown on the (0001) ZnO underlayer on the (0001) sapphire substrate by the ion beam sputtering at the growth temperatures from 650˚C to 750˚C with the supply of molecular oxygen or plasma oxygen. The out-of-plane and in-plane epitaxial orientational relationships of the lattices and crystalline qualities were analyzed using various X-ray diffraction techniques for the LSMO/ZnO/Sap double-hetero epitaxial systems. The growth of out-of-plane (110) oriented phase of LSMO is promoted at the higher temperatures, accompanying the suppression of other competitive growth of the LSMO (001) and (111) phases. The growth of LSMO (111) phase is remarkably suppressed by supplying the plasma oxygen at the higher temperature due to the excess energy. The slight contraction of lattice constants along the growth direction was found in the samples grown at the higher temperature. The tilting of lattices of the LSMO (110) phase was evaluated by the peak breadth of ω rocking curves as around 2.0 deg. This value is almost the same for the all samples investigated. The twisting of LSMO lattices was evaluated by the in-plane f rocking curves, indicating the improvement of crystalline quality for the samples grown at the higher temperatures.
The complex epitaxial orientaional relationships of the three LSMO phases were clarified by the precise analyses using the high resolution measurements of the out-of-plane XRD, the in-plane XRD, the in-plane RSM, and PF. They are summarized as


(μ-mode).


Fiure 14. The Out-of-plane wide-range reciprocal space mappings obtained by using the 2D X-ray detector for the samples (a) ML-LT and (b) ML-HT. The horizontal axis corresponds to the directions of  axis of the ZnO underlayer and
  axis of the sapphire substrate. The vertical axis corresponds to the directions of [0001] axis of the ZnO underlayer and sapphire substrate. The detected intensity is scaled in log scale. The index numbers indicate the reflecting planes. The LSMO phases are indicated by the same symbols with Figure 12.
The validity of these analyses for the epitaxial orientations of LSMO/ZnO/Sap double heteroepitaxial layers were confirmed by the alternative analysis of the outof-plane wide-range reciprocal space mappings using the 2D X-ray detector.
REFERENCES
- T. Endo, K. Uehara, T. Yoshii, M. Yokura, H. Zhu, J. Nogues, J. Colino and K. Endo, “Peculiar Electric and Magnetic Properties of La(Ba)MnO3 Thin Films,” Transactions of Materials Research Society of Japan, 20th Anniversary Special Issue, 2012, pp. 65-76.
- K. Lord, D. Hunter, T. M. Williams and A. K. Paradhan, “Photocarrier Injection Effect and p-n Junction Characteristics of La0.7Sr0.3MnO3/ZnO and Si Heterostructures,” Applied Physics Letters, Vol. 89, No. 5, 2008, Article ID: 052116. doi:10.1063/1.2335406
- V. Bhosle and J. Narayan, “Epitaxial Growth and Magnetic Properties of La0.7Sr0.3MnO3 Films on (0001) Sapphire,” Applied Physics Letters, Vol. 90, 2007, Article ID: 101903.
- K. Uehara, A. Okada, A. Okamoto, M. Yokura, S. L. Reddy, S. Kobayashi, K. Inaba, N. Iwata, R. Philip, H. Kezuka, M. Matsui and T. Endo, “Hetero-Epitaxial Growth of Cubic La(Sr)MnO3 on Hexagonal ZnO, In-Plane Orientations of La(Sr)MnO3 (001), (110), and (111) Phases,” Japanese Journal of Applied Physics, Vol. 51, 2012, Artile ID: 11PG07.
- K. Inaba, “X-Ray Thin-Film Measurement Techniques I. Overview,” The Rigaku Journal, Vol. 24, No. 1, 2008, pp. 10-15.
- P. F. Fewster, “X-Ray Scattering from Semiconductors,” Imperial College Press, 2000.
- T. Konya, “X-Ray Thin-Film Measurement Techniques III. High Resolution X-Ray Diffractometry,” The Rigaku Journal, Vol. 25, No. 2, 2009, pp. 1-8.
- K. Omote and J. Harada, “Grazing-Incidence X-Ray Diffractometer for Determining In-Plane Structure of Thin Films,” Advances in X-Ray Analysis, Vol. 43, 2000, pp. 192-200.
- S. Matsuno, M. Kuba, T. Nayuki, S. Soga and P. W. T. Yuen, “Microstructural Characterization of Thin Films and Surfaces by a New Grazing Incident X-Ray Diffractometer,” The Rigaku Journal, Vol. 17, No. 2, 2000, pp. 36-44.
- Y. F. Chen, S. K. Hong, H. J. Ko, V. Kirshner, H. Wenish, T. Yao, K. Inaba and Y. Segawa, “Effects of an Extremely Thin Buffer on Heteroepitaxy with Large Lattice Mismatch,” Applied Physics Letters, Vol. 78, No. 21, 2001, pp. 3352-3354. doi:10.1063/1.1373412
- S. Kobayashi, “X-Ray Thin-Film Measurement Techniques IV. In-Plane Diffraction Measurements,” Rigaku Journal, Vol. 26, No. 1, 2010, pp. 3-11.
- S. K. Han, D. C. Oh, J. H. Song, K. Inaba, T. Yao and S. K. Hong, “Lattice Deformation in a-Plane ZnO Films Grown on r-Plane Al2O3 Substrates Grown by PlasmaAssisted Molecular-Beam Epitaxy,” Applied Physics Express, Vol. 5, 2012, Article ID: 081101. doi:10.1143/APEX.5.081101
- K. Nagao and E. Kagami, “X-Ray Thin-Film Measurement Techniques VII. Pole Figure Measurement,” Rigaku Journal, Vol. 27, No. 2, 2011, pp. 6-14.
- S. Kobayashi and K. Inaba, “X-Ray Thin-Film Measurement Techniques VIII. Detectors and Series Summary,” Rigaku Journal, Vol. 28, No. 1, 2012, pp. 8-13.
- M. Renninger, “Beitrag zur Kenntnis der Roentgenorgraphischen Unterschiede Zwischen den Beiden DiamantTypen,”Acta Crystallographica, Vol. 8, 1955, pp. 606- 610. doi:10.1107/S0365110X55001928
- M. Seki, T. Konya, K. Inaba and H. Tabata, “Epitaxial Thin Films of InFe2O4 and InFeO3 with Two-Dimensional Triangular Lattice Structures Grown by Pulsed Laser Deposition,” Applied Physics Express, Vol. 3, 2010, Article ID: 105801. doi:10.1143/APEX.3.105801
- G. Saint-Girons, C. Priester, P. Regreny, G. Patriarche, L. Largeau, V. Favre-Nicolin, G. Xu, Y. Robach, M. Gendry and G. Hollinger, “Spontaneous Compliance of the InP/ SrTiO3 Heterointerface,” Applied Physics Letters, Vol. 92, No. 24, 2008, Article ID: 241907. doi:10.1063/1.2944140
- K. Dovidenko, S. Oktyabrsky, A. K. Sharma and J. Narayan, “TEM Characterization of ZnO and AlN/ZnO Thin Films Grown on Sapphire,” Materials Research Society Symposium Proceedings, Vol. 526, 1998, pp. 311-316. doi:10.1557/PROC-526-311
- B. Wessler, F. F. Lange and W. Mader, “Textured ZnO Thin Films on (0001) Sapphire Produced by Chemical Solution Deposition,” Journal of Materials Research, Vol. 17, No. 7, 2002, pp. 1644-1650. doi:10.1557/JMR.2002.0242
- M. Birkholz, “Thin Film Analysis by X-Ray Scattering,” Wiley-VCH Verlag GmbH & Co., 2006.