Advances in Materials Physics and Chemistry
Vol.2 No.3(2012), Article ID:23235,5 pages DOI:10.4236/ampc.2012.23026
Sintering Condition and Optical Properties of Zn3V2O8 Phosphor
Graduate School of Science and Engineering, Saitama University, Saitama, Japan
Email: s10mp251@mail.saitama-u.ac.jp
Received July 3, 2012; revised August 9, 2012; accepted August 19, 2012
Keywords: Zn3V2O8 Phase; XRD; Crystalline Purity; Internal Quantum Efficiency; Photoluminescence
ABSTRACT
One of promising phosphors in vanadium oxide family, Zn3V2O8, was successfully synthesized by a solid state reaction of ZnO and V2O5. Characterization by XRD, photoluminescence (PL) and SEM was done for samples with different temperature and time in the sintering process. Residual percentage of secondary Zn2V2O7 phase, subsidiary ZnO and Zn4V2O9 phases was dependent on the sintering condition. The crystalline purity (CP) was defined by the integral intensity ratio of Zn3V2O8 phase and that of residual phases in XRD spectra, which showed a reasonable correspondence to the PL quantum yield (QY) of each sample. The highest QY exceeding 50% was obtained by the sintering condition of 750˚C for 48 h. It turned out that the CP value is a good measure of high QY, which can be utilized for developing phosphor materials and controlling their processes.
1. Introduction
Development of phosphor materials has been accelerated with the expansion of lighting and display applications as well as the progress on material science [1]. Through continuous efforts for improving efficiency and stability, BaMg2Al16O27:Eu2+, CeMgAl11O19:Tb3+, Y2O3:Eu3+ etc. were utilized for fluorescent lamps [2], and CaWO4:Pb2+, Zn2SiO4:Mn2+, YVO4:Eu3+ etc. for plasma display panels [3]. The evolution of InGaN/GaN blue light emitting diode (LED) [4-6] provided cost-effective LED lamps in combination with yellowish phosphor YAG:Ce3+ and its variations [7]. The excitation density of such phosphor materials is higher than that of previous applications due to small emission volume and adjacent location of LED chips. As these LED lamps substitute for incandescent lamps, the quality of white light was added to one of key issues as well as efficiency and reliability. It is of crucial importance, therefore, to develop phosphor materials suitable for LED lamp applications with higher color rendering and reliable properties.
Unlike sharp emission lines due to 4f transitions of rare earth ions as Eu3+, Tb3+ etc., a family of vanadates, Zn3V2O8, CsVO3 et al., shows efficient and broad emission spectrum in a visible wavelength region. Each VO4 tetrahedron in Zn3V2O8 is isolated in an orthorhombic structure, while that in CsVO3 is two-dimensionally arrayed as the VO4 sheet in an orthorhombic pyroxene structure [8]. A two-component oxide system, zinc oxide and vanadium pentoxide, ZnO-V2O5, has been studied by many researchers [8-15]. With different mixing ratio of Zn, V and O, and different sintering conditions, there exists a number of different compositional phases as Zn4V2O9, Zn2V2O7 and Zn3V2O8, etc. [9]. Though the Zn3V2O8 phase is preferable for an efficient visible light emission, detailed study on the crystalline purity and light emission properties of the Zn3V2O8 phosphor was rarely reported.
In this work, we fabricated an efficient Zn3V2O8 phosphor by controlling the temperature and time duration of the sintering process and obtained a reasonable correspondence between crystalline and luminescent properties.
2. Material and Methods
2.1. Preparation of Zn3V2O8
The Zn3V2O8 phosphor was synthesized by a solid-state reaction of ZnO and V2O5, both with 99.99% purities. The mixing ratio of constituent source materials was fixed to the stoichiometric value as ZnO:V2O5 = 3:1. They were ground 4 h by a mortar, pressed into pellets, and then transferred into a crucible which was put into a sintering oven. The sintering was performed in the air with atmospheric pressure. The sintering temperature was varied between 600˚C and 800˚C, and the sintering time between 12 and 72 h. We obtained a slightly yellowish white powder of Zn3V2O8 after sintering, which was characterized by the following schemes.
2.2. Scheme of Measurement
The powder of Zn3V2O8 was ground again and then transferred onto a glass plate, and the X-ray diffraction (XRD) measurement was performed by using a RINT- UltimaⅢ (RIGAKU) diffractometer with Cu Kα radiation (40 kV × 40 mA). The surface morphology was observed by using a S-4100 (HITACHI) scanning electron microscope (SEM).
The photoluminescence (PL) and PL excitation (PLE) measurements of each sample, pressed inside a circular dip of 4mm diameter with 1mm depth on a Cu-holder, were performed by a FluoroMax-3 (Horiba Jovin-Yvon) spectrophotometer [16]. The excitation wavelength of PL measurement was 340 nm with the density of 5 mW/cm2, and the observation wavelength of PLE was set in the PL spectral peak of 585 nm.
The PL quantum yield (QY) was determined by a QEMS-2000 (Systems Engineering) PL quantum yield measurement system, which was composed of an LED with the peak wavelength of 375 nm, a calibrated integrating sphere, and a multichannel spectrometer.
Here, either a standard diffuser or the sample on the same quartz glass-holder was placed at the window of the integrating sphere and irradiated by the LED. The photon number absorbed by the sample Nα was calculated from the spectral difference between two cases at the irradiation wavelength, and the emitted photon number Ne was obtained by the PL spectrum from the sample. The value of QY was defined by the ratio Ne/Nα. All measurements were performed at room temperature.
3. Results and Discussion
3.1. XRD Patterns
Figure 1 shows the XRD patterns of samples with different sintering temperature between 600˚C and 800˚C at the fixed sintering time of 12 h. The principal XRD peak positions of all samples coincided with those of the Zn3V2O8 phase according to Joint Committee on Powder Diffraction Standards (JCPDS card) [17]. Its crystalline structure is the orthorhombic space group Cmca with lattice parameters a = 6.28(8) Å, b = 11.53(6) Å and c = 8.28(2) Å [Z = 4] (JCPDS 34-0378): the (1 2 2) diffracttion peak is dominant among others. The secondary phase observed in every spectrum was attributed to the Zn2V2O7 phase (JCPDS 016-0830) as shown by asterisks in the figure: the (0 2 2) peak is the highest one. The intensity ratio of the (0 2 2) peak to the (1 2 2) peak of the Zn3V2O8 phase showed a minimum point at the temperature of 750˚C.
Besides these Zn3V2O8 and Zn2V2O7 phases, subsidiary phases which bring forth residual peaks were depen-
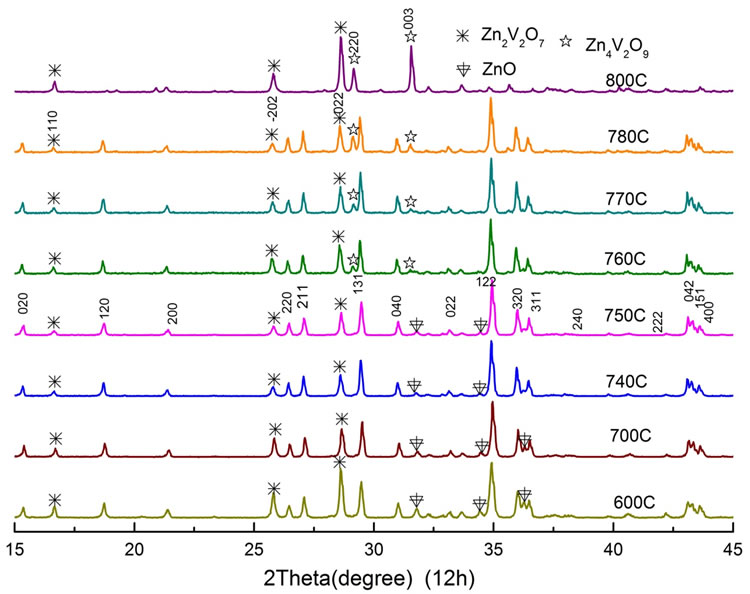
Figure 1. XRD patterns as a function of sintering temperature between 600˚C and 800˚C for a fixed time of 12 h.
dent on the sintering temperature. At the temperature from 600˚C to 750˚C, peaks of ZnO (JCPDS 65-3411) were resolved in the XRD pattern as shown by arrows, while those of Zn4V2O9 phase (JCPDS 01-077-1757) appeared above 760˚C as shown by stars in the figure. With increasing temperature, the former intensity decreased but that of the latter increased, showing their minimum point at the temperature around 750˚C.
Next, we fixed the sintering temperature to the 750˚C, and varied the sintering time from 12 h to 72 h as shown in Figure 2. Here the peak intensity of the Zn2V2O7 phase decreased and that of ZnO phase disappeared with increasing the time from 12 h to 48 h. It became clear from the experiment that an enough sintering time of 48 h is necessary for reducing the Zn2V2O7 and other phases at the temperature of 750˚C.
3.2. Photoluminescence Characteristics
The optical properties of Zn3V2O8 powder samples were characterized by PL and PLE measurements. At the fixed time of 12 h, PL and PLE spectra of samples with different sintering temperature were shown in Figure 3. In the PLE spectrum, each sample showed a broad absorption band centered at around 340 nm. A sub-peak at 380 nm, which was attributed to ZnO, was clearly observed in samples treated below 740˚C. The PL spectra showed a broad emission band between 450 nm and 750 nm with a peak wavelength at about 585 nm [18]. The full width at half maximum (FWHM) of the emission band was 180 nm. The highest PL intensity was obtained at the sintering condition of 750˚C from this experiment.
Then PL and PLE spectra were compared in Figure 4 as a function of the sintering time at the fixed temperature of 750˚C. By increasing the sintering time from 12 h to 48 h, the PL intensity increased with the ratio of
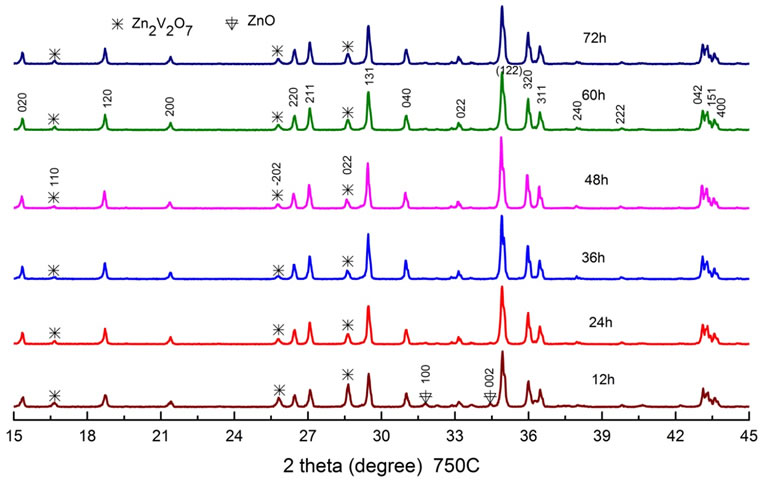
Figure 2. XRD patterns as a function of sintering time between 12 h and 72 h at a fixed temperature of 750˚C.
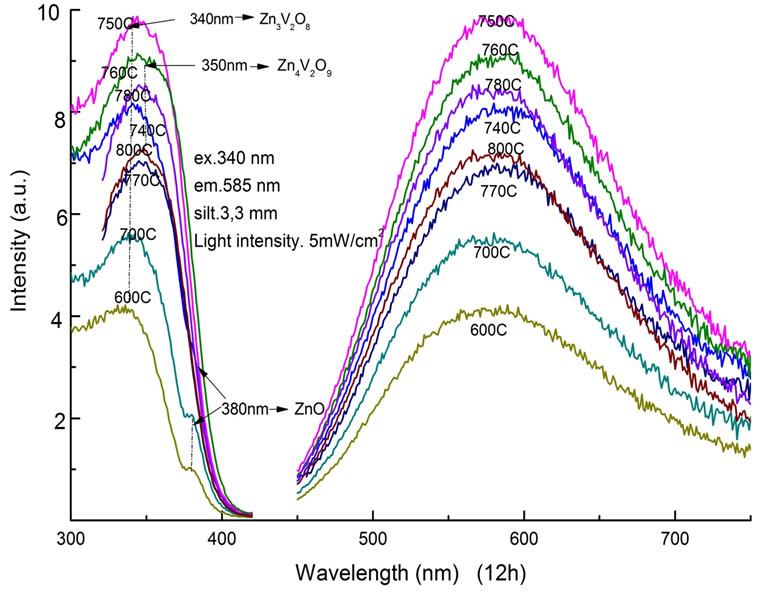
Figure 3. PLE and PL spectra as a function of sintering temperature between 600˚C and 800˚C for a fixed time of 12 h.
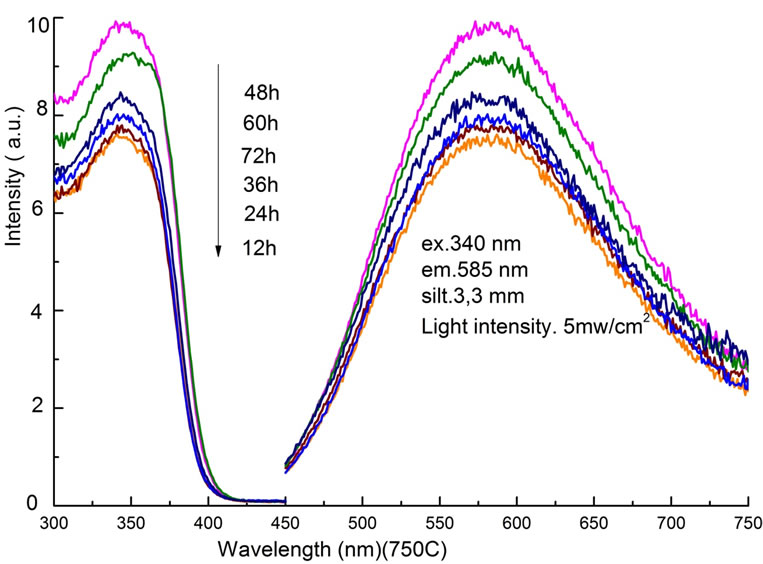
Figure 4. PLE and PL spectra as a function of sintering time between 12 h and 72 h at a fixed temperature of 750˚C.
24.3%. Further increase in time, longer than 60 h, changed the purity of the Zn3V2O8 phase, and decreased the PL intensity. Therefore, it is confirmed that both the temperature and the time of sintering process affect light emission properties, indicating the necessary condition of 750˚C and 48 h.
3.3. SEM Observation
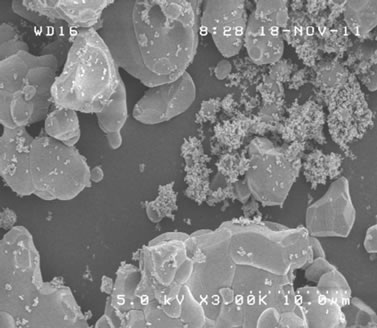
Surface morphology of synthesized samples was observed by SEM. Resultant images of samples sintered at 700˚C, 750˚C and 760˚C, all during 12 h, were shown in Figures 5(a)-(c). With increasing the sintering temperature, dregs-like particles at the surface of each block became less dominant and the size of each block increased. Figure 5(d) shows the image of the sample sintered at 750˚C for 48 h. With increasing the sintering time from 12 h to 48 h, such dregs-like particles in Figure 5(b) completely disappeared and the size of each block increased, even larger than that of 760˚C of Figure 5(c). No significant difference was observed between samples sintered at 750˚C and 760˚C in case of 48 h duration. The SEM image of the sample under suitable sintering process, shown in Figure 5(d), yielded a typical size of several µm, and was almost homogeneous throughout the observing volume [19-21]. Above result of SEM observation is considered to have direct correspondence with the crystallization process of Zn3V2O8 [9], indicating its sintering temperature and time dependence distinctly.
3.4. Crystalline Purity and PL Quantum Yield
In order to determine the dominance of Zn3V2O8 phase over other phases quantitatively, we defined a crystalline purity (CP) as the integral intensity ratio of Zn3V2O8
 (a)
(a)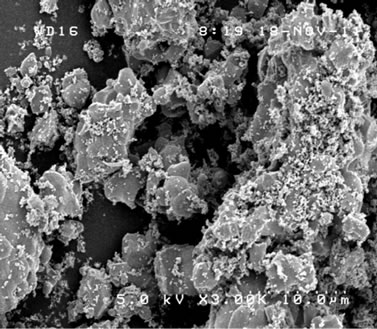 (b)
(b)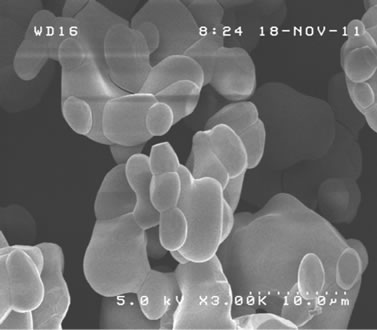 (c)
(c)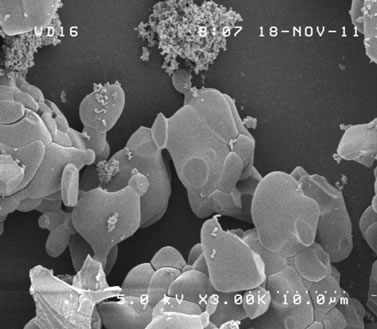 (d)
(d)
Figure 5. SEM image of samples sintered at (a) 700˚C; (b) 750˚C; and (c) 760˚C for 12 h; and (d) 750˚C for 48 h, respectively.
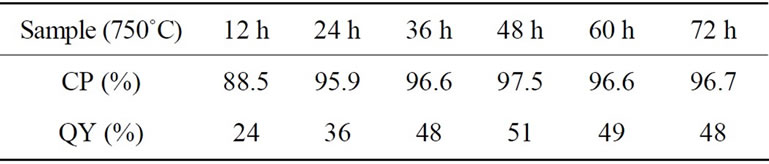
Table 1. Crystalline purity (CP) and PL quantum yield (QY) as a function of sintering time at 750˚C.
peaks and that of the residual peaks including Zn2V2O7, ZnO and Zn4V2O9 phases in the diffraction angle between 15 and 45 degree of XRD spectra. Calculated CP values of samples sintered at 750˚C with different time were listed together with their values of QY in Table 1. The highest CP of 97.5% was obtained for the sample sintered during 48 h. It is quite important that the sample showed highest value of the QY: the highest QY value of 51% is similar to the previous report [13].
Combining the result of SEM observation, the correspondence between the CP and the QY implies that the crystal growth of Zn3V2O8 phase with an enough scale is indispensable for an efficient light emission. The sintering process at 750˚C with time duration of 48 h is necessary for such high CP value. In the course of improving Zn3V2O8 phosphor and controlling its process, the CP value can be utilized as a good measure of high QY. Such continuing steps toward optimization lead us to fabricate efficient and stable phosphor materials suitable for LED lamp applications.
4. Conclusions
One of promising vanadate phosphor Zn3V2O8 was synthesized by solid reaction of ZnO and V2O5. Crystallographic and optical characterization was performed with varying the sintering temperature between 600˚C and 800˚C and the sintering time between 12 h and 72 h. Aside from the principal Zn3V2O8 phase, there observed secondary Zn2V2O7 phase and subsidiary ZnO and Zn4V2O9 phases, depending on the sintering condition.
The CP value, defined by the ratio of the integrated intensity of Zn3V2O8 phase and that of residual phases in the diffraction angle between 15 and 45 degree in the XRD spectra, showed a reasonable correspondence with the value of QY. In order to obtain high QY, the sintering temperature at 750˚C with the duration of 48 h is preferable. It turned out, therefore, that the CP value can be utilized as a good measure of high QY in Zn3V2O8 phosphor materials.
5. Acknowledgements
The authors would like to thank the project “Strategic Promotion on the field of Frontier Photonics”, supported by the Ministry of Education, Culture, Sports, Science and Technology, Japan. The work was supported also by the grant in aid for scientific research (B) by the Japan Society for the Promotion of Science.
REFERENCES
- S. Shionoya and W. M. Yen, “Phosphor Handbook,” CRC Press, Boca Raton, 1999.
- J. J. Opstelten, et al., “The Choice and Evaluation of Phosphors for Application to Lamps with Improved Color Rendition”, Journal of the Electrochemical Society, Vol. 120, No. 10, 1973, pp. 1400-1408. doi:10.1149/1.2403269
- J. Koike, et al., “New Tricolor Phosphors for Gas Discharge Display,” Journal of the Electrochemical Society, Vol. 126, No. 6, 1979, pp. 1008-1010. doi:10.1149/1.2129164
- I. Akasaki and H. Amano, “Breakthroughs in Improving Crystal Quality of GaN and Invention of the p-n Junction Blue-Light-Emitting Diode,” Japanese Journal of Applied Physics, Vol. 45, 2006, pp. 9001-9010. doi:10.1143/JJAP.45.9001
- H. Amano, M. Kito, K. Hiramatsu and I. Akasaki, “PType Conduction in Mg-Doped GaN Treated with LowEnergy Electron Beam Irradiation (LEEBI),” Japanese Journal of Applied Physics, Vol. 28, 1989, pp. L2112- L2114. doi:10.1143/JJAP.28.L2112
- S. Nakamura, T. Mukai and M. Senoh, “Candela-Class High-Brightness InGaN/AIGaN Double-Heterostructure Blue-Light-Emitting,” Applied Physics Letters, Vol. 64, 1994, pp. 1687-1689. doi:10.1063/1.111832
- K. Bando, K. Sakano, Y. Noguchi and Y. Shimizu, “Development of High-Bright and Pure-White LED Lamps,” Journal of Light and Visual Environment, Vol. 22, No. 1, 1998, pp. 2-5. doi:10.2150/jlve.22.1_2
- T. Nakajima, M. Isobe, T. Tsuchiya, Y. Ueda and T. Manabe, “Correlation between Luminescence Quantum Efficiency and Structural Properties of Vanadate Phosphors with Chained, Dimerized, and Isolated VO4 Tetrahedra,” The Journal of Physical Chemistry C, Vol. 114, No. 11, 2010, pp. 5160-5167. doi:10.1021/jp910884c
- M. Kurzawa, I. Rychlowska-Himmel, M. Bosacka and A. Blonska-tabero, “Study on Phase Relations in Zn3V2O8- ZnMoO4 System,” Journal of Thermal Analysis and Calorimetry, Vol. 64, No. 3, 2001, pp. 1113-1119. doi:10.1023/A:1011524424682
- M. Kurzawa and M. Bosacka, “Reinvestigation of Phase Equilibria in the V2O5-ZnO System,” Journal of Thermal Analysis and Calorimetry, Vol. 64, No. 3, 2001, pp. 1081-1085. doi:10.1023/A:1011564106026
- H. H. Hng and K. Y. Tse, “Effects of MgO Doping in ZnO 0.5 mol% V2O5 Varistors,” Ceramics International, Vol. 34, No. 5, 2008, pp. 1153-1157. doi:10.1016/j.ceramint.2007.02.004
- M. M. Abd El-Latif and M. F. Elkady, “Kinetics Study and Thermodynamic Behavior for Removing Cesium, Cobalt and Nickel Ions from Aqueous Solution Using Nano-Zirconium Vanadate Ion Exchanger,” Desalination, Vol. 271, No. 1-3, 2011, pp. 41-54. doi:10.1016/j.desal.2010.12.004
- T. Nakajima, M. Isobe, T. Tsuchiya, Y. Ueda and T. Kumagai, “A Revisit of Photoluminescence Property for Vanadate Oxides AVO3 (A:K, Rb and Cs) and M3V2O8 (M:Mg and Zn),” Journal of Luminescence, Vol. 129, No. 12, 2009, pp. 1598-1602. doi:10.1016/j.jlumin.2009.03.029
- R. Gopal and C. Calvo, “Crystal Structure of α-Zn3 (VO4)2,” Canadian Journal of Chemistry, Vol. 49, No. 18, 1971, pp. 3056-3059. doi:10.1139/v71-510
- Y. Q. Chen., L. Li., Q. Ren., H. T. Zhu, et al., “Phase Relations in the ZnO-V2O5-K2O System,” Chinese Physics B, Vol. 20, 2011, Article ID: 076402.
- T. Li, J. Luo, Z. Honda, T. Fukuda and N. Kamata, “Photoluminescence Characterization of Zn3V2O8 Phosphor,” National Convention of the Illuminating Engineering Institute of Japan, Matsuyama, p. 221. (in Japanese)
- H. H. Hng and K. M. Knowles, “Characterization of Zn3(VO4)2 Phases in V2O5-Doped ZnO Varistors,” Journal of the European Ceramic Society, Vol. 19, No. 6-7, 1999, pp. 721-726. doi:10.1016/S0955-2219(98)00303-3
- T. Nakajima, T. Tsuchiya and T. Manabe, “New Sign of Vacuum Ultraviolet Driven Crystal Growth in Ternary Oxide Zn3V2O8 Films,” Applied Physics A, Vol. 98, No. 4, 2010, pp. 885-888. doi:10.1007/s00339-009-5470-1
- S. Karamat, R. S. Rawat, P. Lee, et al., “Structural, Compositional and Magnetic Characterization of Bulk V2O5 Doped ZnO System,” Applied Surface Science, Vol. 256, No. 8, 2010, pp. 2309-2314. doi:10.1016/j.apsusc.2009.09.039
- M. M. Francisco, J. V. Miriam and P. Heriberto, “Microstructural Development of ZnO Pellets Doped with Different Vanadium Oxides (V2O5 and V2O3),” International Journal of Applied Ceramic Technology, Vol. 4, No. 6, 2007, pp. 564-570. doi:10.1111/j.1744-7402.2007.02167.x
- S. B. Ni, X. H. Wang, G. Zhou, F. Yang, J. M. Wang and D. Y. He, “Crystallized Zn3(VO4)2: Synthesis, Characterization and Optical Property,” Journal of Alloys and Compounds, Vol. 491, No. 1-2, 2010, pp. 378-381. doi:10.1016/j.jallcom.2009.10.188