Open Journal of Geology
Vol.06 No.09(2016), Article ID:70577,19 pages
10.4236/ojg.2016.69083
Conditions of Ore-Mineralization and Geochemical Correlation of Rare-Elements at the Robat Pb-Zn Deposit, West of Khomein, Central Iran
Golrokh Mahdavi*, Ahmad Khakzad, Mohammad Lotfi
Department of Geology, Faculty of Science, North Tehran Branch, Islamic Azad University, Tehran, Iran

Copyright © 2016 by authors and Scientific Research Publishing Inc.
This work is licensed under the Creative Commons Attribution International License (CC BY 4.0).
http://creativecommons.org/licenses/by/4.0/


Received: July 21, 2016; Accepted: September 11, 2016; Published: September 14, 2016
ABSTRACT
The Robat geological study area is located 32 Km west-northwest of Khomein town. From the geo-structural point of view, it is in the median part of the Sanandaj-Sirjan zone [1] , and from the mineralization aspect it is part of the Malayer-Esfahan Pb-Zn metallogenic belt [2] . The main hostrock of Pb-Zn ore-mineralization at the Robat deposit is the upper parts of the orbitolina-bearing limestone at its contact with the overlying unit of marl. Ore mineralization is characterized by vein-veinlet, fracture- filling and replacement textures, associated with silica, carbonate, argillic and hematitic alterations [3] . Geochemical trends of minor elements in ore represent positive correlation of Sb, Ag, Cu, Bi, Sn, Fe, U, Th, W, V, Zr and Y with Pb and Zn. Fluid inclusion study of samples indicates that primary fluid inclusions mainly consist of liquid, having an average temperature of homogeneity in the range of 160˚C to 270˚C, having the most frequency in the range of 180˚C to 190˚C at an average of 5 to 10 wt% NaCl equivalent for salinity. Based on the graph of pressure variations versus salinity (representing paleo-depth), it is understood that ore-mineralization at the Robat deposit is estimated to have formed at less than 50 bars pressure representing depths shallower than 200 m. Fluid inclusion study renders that the low salinity could be resulted from dilution by meteoric waters, also indicating that boiling could be the major mineral precipitation process. Therefore, it is concluded, based on these studies, besides field evidence, that the Robat Pb-Zn deposit shows strong affinity with MVT Pb-Zn mineralization type.
Keywords:
Robat Pb-Zn Deposit, Ore-Mineralization, MVT, Fluid Inclusion

1. Introduction
The Robat study area is located about 32 km west-northwest of the Khomein town, 10 km northwest of the Qurchi-Bashi town and 2 km north of the Robat-e Bala village (Figure 1). The boundaries of the study area are restricted between 49.7333˚E to 49.8117˚E and 33.7342˚N to 33.7825˚N, longitudes and latitudes respectively (Figure 2(a)). Within the vicinity of the Pb-Zn deposit, at the northeast, there is a vein-type barite deposit. This study provided the first hand information about the exact distribution of the Pb-Zn ore-body and its genesis based on field evidence, petrographic and mineralographic studies on thin-polished sections, geochemical analysis and study of fluid inclusions.
2. Study Method
Considering the active brown-field exploration stage conducted by Pichab Kansar company on the Robat Pb-Zn deposit, results of primary lithogeochemical survey were available, which made able the site selection and excavation of 18 trenches ranging between 20 to 80 m long and 1m deep, crosscutting mineralized veins or altered outcrops over the deposit area. For this study 18 samples were collected directly from trenched parts of mineralized veins, besides 3 samples from altered outcrops. Afterwards by completion of core-drillings and their chemical analysis by 1m intervals along core length, 9 samples were also collected from high grade intervals of the cores, making a total of 30 rock-chip samples.

Figure 1. Geographic location of the Robat study area on the GeoEye satellite image provided by Google Earth.
In order to conduct various studies on collected samples they were divided for separate preparation at the Iranian Mineral Processing Research Center (IMPRC) laboratories which operates under supervision of the Iranian Mines and Mining Industries Development and Renovation Organization (IMIDRO). Thin-polished sections underwent microscope study for detecting petrographic and mineralographic characteristics of mineralized/altered samples. Samples have been analyzed by 54-element package of ICP-MS analysis besides total-oxide XRF and XRD analysis, in order to be able to detect possible correlation among ore-mineralization and analytic results [4] . As the main objective of this study is studying rare-elements within lead-zinc ore of this deposit in order to compare conditions of this mineralization with similar deposit of its kind within the Malayer-Esfahan Pb-Zn metallogenic belt, special attention was given to samples with higher grades of the rare-elements Cd, Ga and In. Geochemical interpretations have been done, investigating interrelations of elements within samples. For fluid inclusion studies 10 samples having observable fluid inclusions in their double- polished chips were selected and studied to estimate genesis of ore mineralization at the Robat Pb-Zn deposit.
2.1. General Geology of the Mineral District
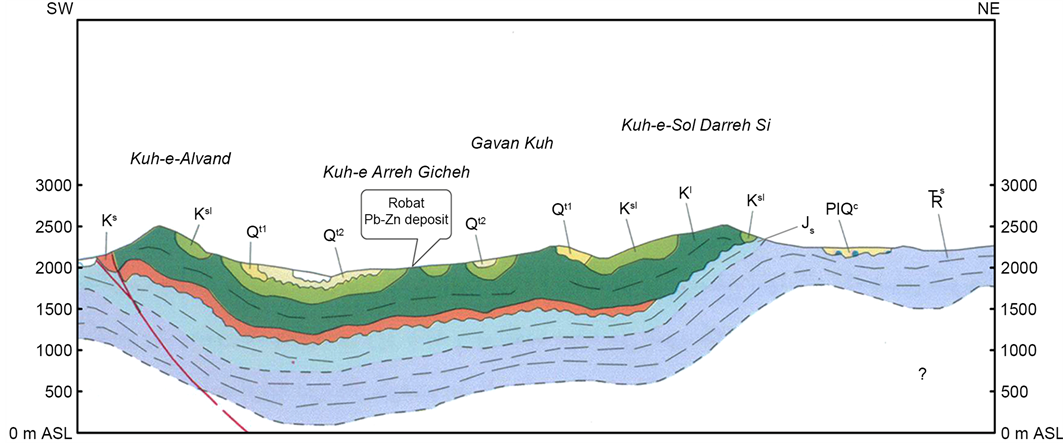
This study area situated in the Malayer-Esfahan Pb-Zn metallogenic belt, in within a regional tectono-stratigraphic trend of well-studied nearby Pb-Zn deposits, namely Ahangaran, Emarat, Muchan, Kelisheh, Haft-Savaran, Lakan, Hossein-Abad, which are all strata bound style, and the Robat Pb-Zn deposit shares major similarities in mineralization characteristics with these deposits. From the regional tectonic point of view, these deposits are arranged on the margins of a rift-generated sedimentary basin. In places that intrusive bodies/stocks have outcropped, grade and tonnage of these deposits have considerably improved, however nearby the Robat Pb-Zn deposit no such outcrops have been observed, requiring airborne magnetic interpretation with adequate line-spacing survey resolution to determine possibility of hidden intrusive bodied with various magnetic susceptibility and depths in order to estimate their composition (Figures 2(a)-(c) & Figure 3).
Petrographic and Mineralographic Study of Samples from Robat Pb-Zn Deposit
Thin-polished samples have been prepared and studied for all 30 rock-chip samples collected from the Robat Pb-Zn deposit. General specifications common among samples are re-crystallized to microcrystalline, cataclastic and porous texture, containing cryptocrystalline to microcrystalline quartz, Fe-oxides associated with carbonate minerals, less frequent sericitized phyllosilicates (muscovite) (Figure 4). Concentration of Fe-oxides along fractures and rims of carbonate minerals, some jarosite and natrojarosite also present in the silica background, besides minor amount of secondary malachite and cerussite in some samples (Figure 5).
In some parts of the thin-polished section (Figure 6) presence of minerals such as barite and celestine, besides some carbonates and considerable Fe-oxides, indicates that
 (a)
(a)
 (b)
(b)
 (c)
(c)
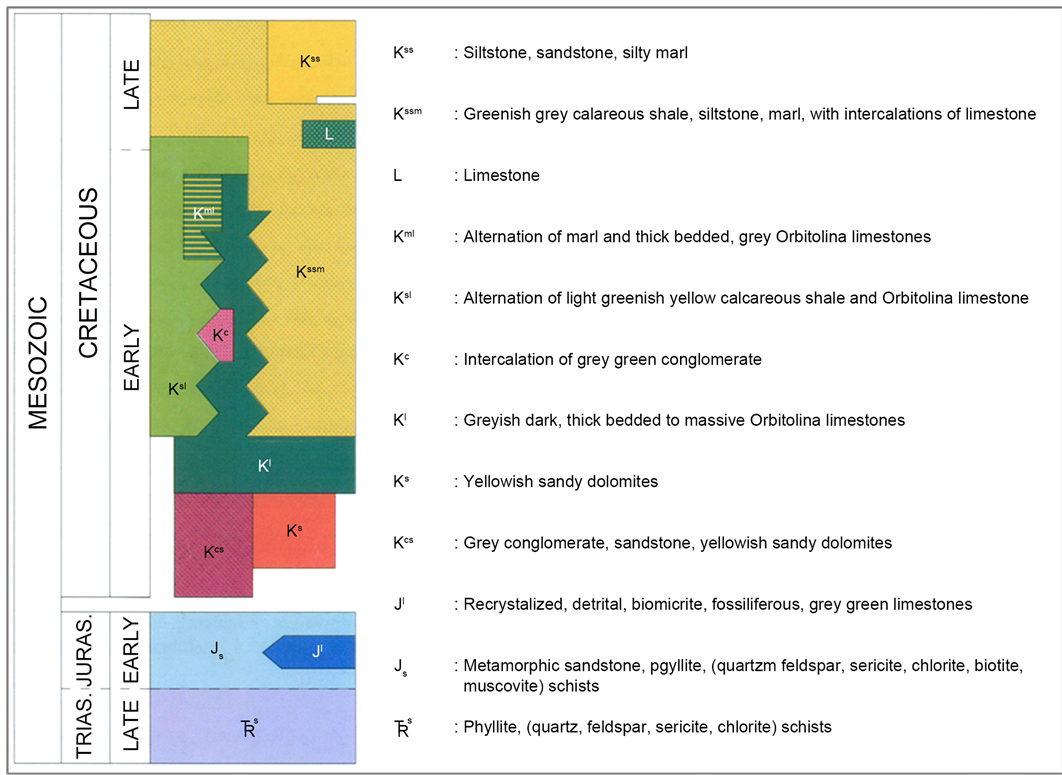
Figure 2. (a) Location of the Robat study area on the 1:100,000 scale geological map of Varcheh (Geological Survey of Iran; compiled by M.H. Kholghi, 2004); (b) Cross-section of the Robat study area, illustrating stratigraphic sequences of Cretaceous units of the 1:100,000 scale geological map of Varcheh (Geological Survey of Iran). Location on the Robat Pb-Zn deposit on the Arreh Giche Mountain (Kuh-e Arreh Gicheh) pointed within the illustration. Retrieved from the 1:100,000 scale geological map of Varcheh (Geological Survey of Iran; compiled by M.H. Kholghi, 2004) with modifications; (c) Mesozoic legend of the 1:100,000 scale geological map of Varcheh (Geological Survey of Iran; compiled by M.H. Kholghi, 2004).
these rocks have been exposed to surface oxidation for a considerable period, such that all primary magnetite and pyrite have converted to hematite.
The silica veinlet in the thin-polished section of Figure 7 indicates it has undergone tectonic movements and cataclasis. The silica veinlets are mainly composed of cryptocrystalline to microcrystalline quartz crystals caused by re-crystallization. Iron-oxides which have hematitic composition are generated by oxidation of primary pyrite and magnetite, associated with carbonate minerals. Minor fine-grained sericitic-altered phyllosilicates also present in the sample. These rocks are weakly porous, which could be an indication for some degree of dolomitization of the limestones at the Robat locality.
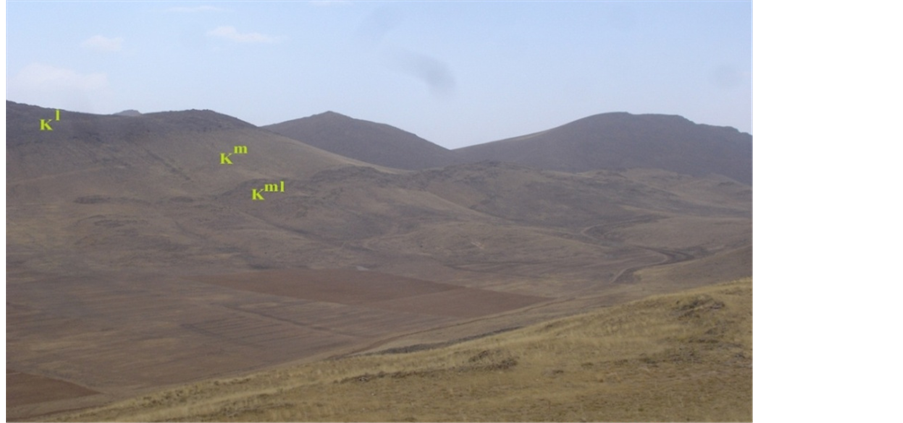
Figure 3. Photograph illustrating carbonate hostrocks of the mineralized veins at the Robat Pb-Zn deposit: Kl (grayish to dark thick-bedded to massive Orbitolina-bearing limestones); Km (marly limestones); Kml (grey marly and thick-bedded Orbitolina-bearing limestones).
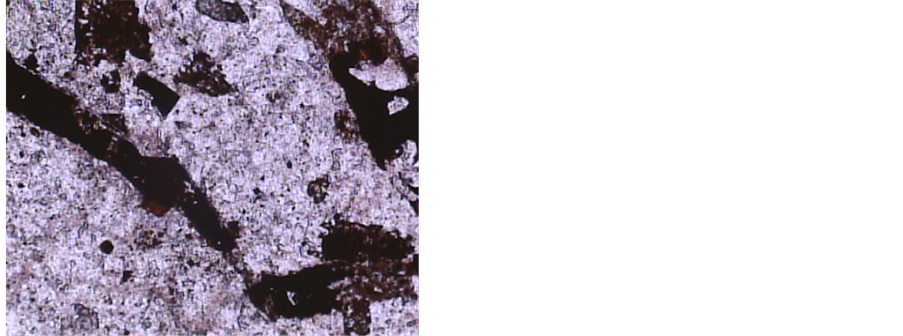
Figure 4. Quartz and phyllosilicates with Fe-oxides in silica veinlet (6.3×, PPL).
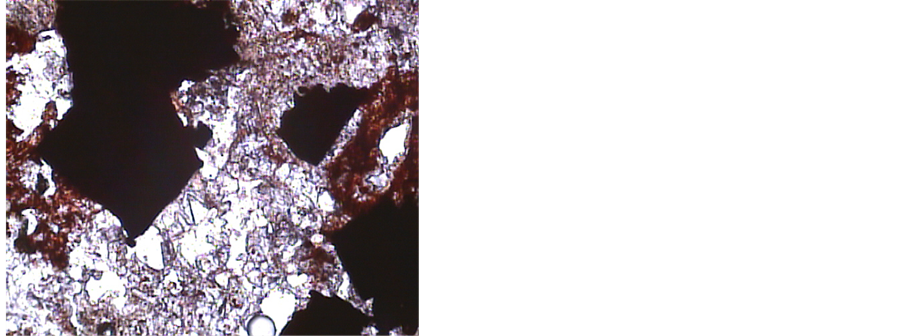
Figure 5. Carbonates with Fe-oxides in silica veinlet (6.3×, PPL).
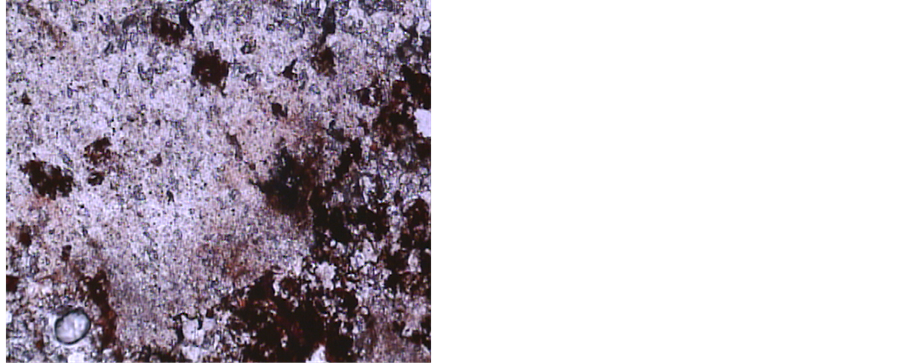
Figure 6. Coexistence of barite (BaSO4), celestine (SrSO4) and Fe-oxides, indicating paragenetic association of sulfide minerals (Fe-oxides are remainders of primary pyrite (FeS2) and magnetite (Fe3O4)) in ore-formation at the Robat Pb-Zn deposit (6.3×, PPL).
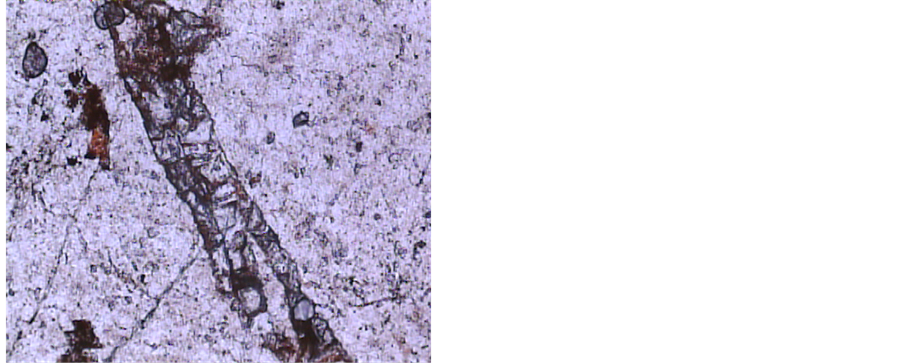
Figure 7. Silica veinlet containing Fe-oxides within weakly dolomitized limestone (6.3×, PPL).
Common in most samples, galena forms euhedral crystals which have been replaced with cerussite (Figure 8), also sphalerite forming disseminated subhedral crystals being replaced with smithsonite (Figure 9), besides anglesite with colloform texture surrounding galena crystals and presence of chalcopyrite inclusions within galena crystals (Figure 10, Figure 11).
Images in Figure 12, Figure 13 and Figure 14 clearly render paragenetic relation of both the first mineralization stage at Robat Pb-Zn deposit, consisted of galena, sphalerite, pyrite and magnetite, and the second stage which are galena, sphalerite, chalcopyrite and hematite.
Results of mineralographic study indicate the mineral paragenesis to be: galena, sphalerite, pyrite and magnetite as the first mineralization stage, and galena, sphalerite, chalcopyrite, hematite, barite and malachite as the second stage of mineralization at the Robat Pb-Zn deposit.

Figure 8. Galena (PbS) crystal being replaced with cerussite (PbCO3) on fracture rims (10×, XPL).
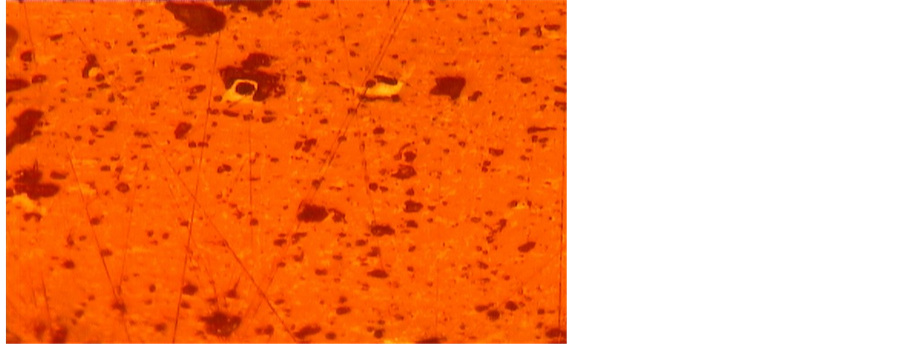
Figure 9. Sphalerite ((Zn, Fe)S) crystal being replaced with smithsonite (ZnCO3) on fracture rims (10×, XPL). This sample rendered 3.4 ppm Au, 7.3 ppm Ag, 0.76% Pb, 2.3% Zn and 109 ppm Cd by ICP-MS analysis.
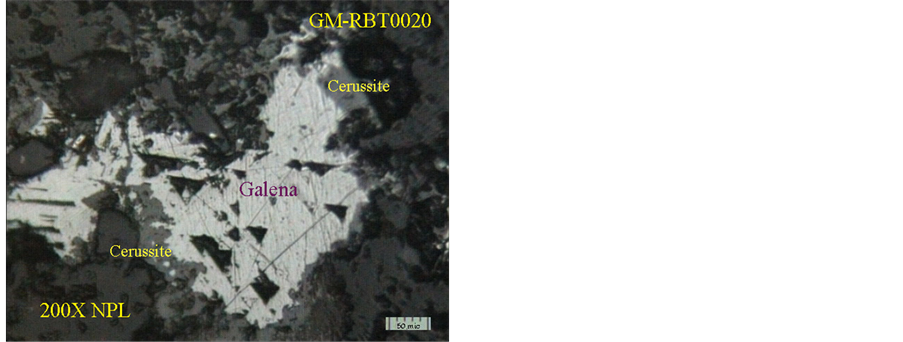
Figure 10. Galena (PbS) crystals with typical triangular pits being replaced with cerussite (PbCO3) from edges. The background is affected by secondary Fe-oxide alteration (200×, XPL).
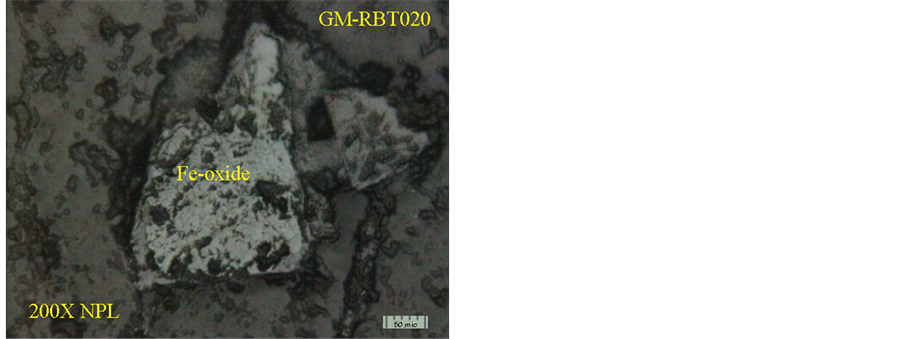
Figure 11. Iron-oxides resulted from complete oxidation of pyrite and magnetite crystals within silica (200×, XPL).
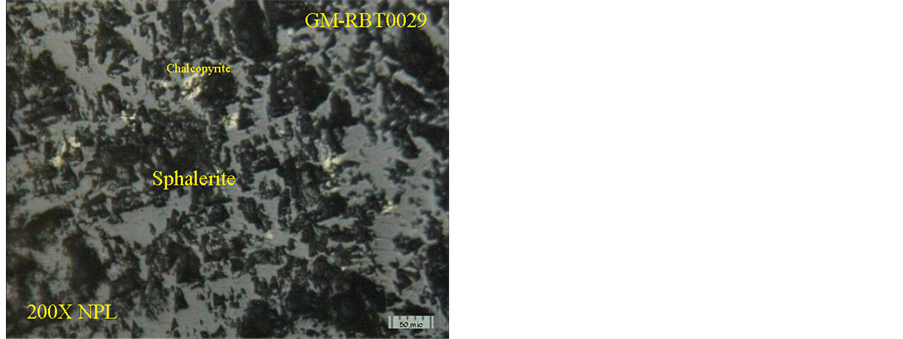
Figure 12. Interweaved sphalerite ((Zn, Fe)S), chalcopyrite (CuFeS2) and galena (PbS) crystals within silica veinlet, representing the second mineralization stage (200×, XPL).
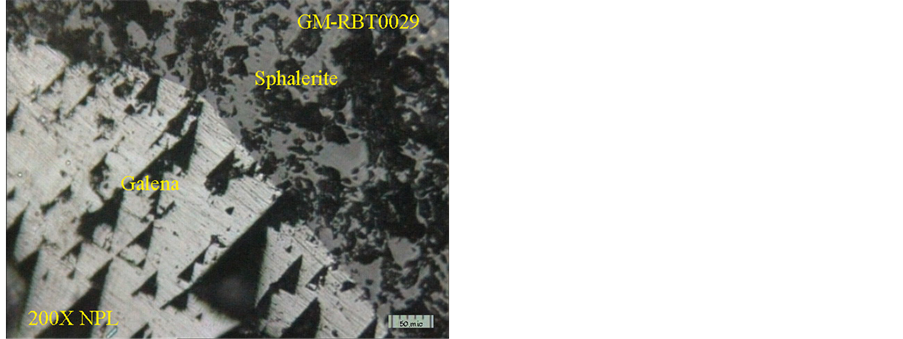
Figure 13. Contact of galena (PbS) with typical triangle pits from the first mineralization stage with interweaved sphalerite ((Zn, Fe)S), chalcopyrite (CuFeS2) and galena crystals within silica veinlet representing the second mineralization stage, which indicates multiphase mineralization event at the Robat Pb-Zn deposit (200×, XPL).
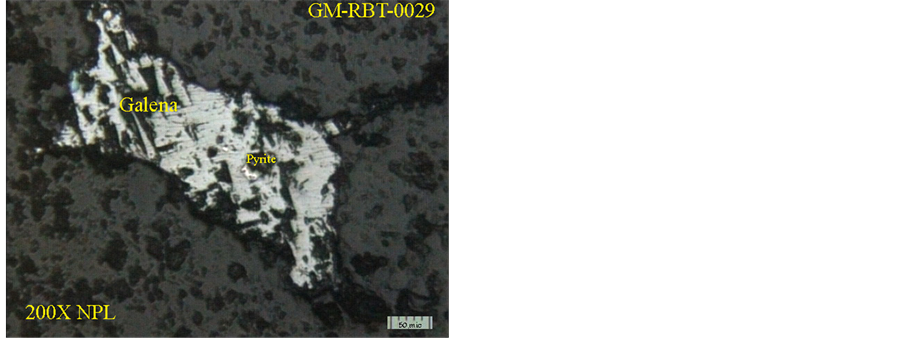
Figure 14. A galena (PbS) crystal with typical triangle pits and pyrite (FeS2) inclusion within from the first mineralization stage in a background of interweaved sphalerite ((Zn, Fe)S), chalcopyrite (CuFeS2) and galena crystals within silica veinlet from the second mineralization stage, which indicates multiphase mineralization event at the Robat Pb-Zn deposit (200×, XPL).
2.2. Geochemical Study
Geochemistry of major, minor and rare elements, within Pb-Zn ore-mineralization of the Robat Pb-Zn deposit have been investigated separately, making it capable to compare results within the population of samples collected.
2.2.1. Variation of Elements versus Pb and Zn Grade at the Robat Pb-Zn Deposit
Besides the two major ore forming elements of Pb and Zn which have strong positive correlation with each other, their grade distribution frequency (shown by histograms) besides their correlation with minor elements are also investigated. Illustrated by histogram of PbO for 18 samples, the average PbO grade is 3.45%, which in most samples the grade is over 1% (Figure 15). Variations of minor elements are compared to the Pb grade at the Robat deposit. Statistical analysis indicates that Pb has positive correlation with all minor elements in Pb-Zn ore (Sb, Ag, Cu, Bi, Sn, Fe, U, Th, W, V, Zr, Y) in samples collected from mineralized veins at the Robat Pb-Zn deposit. As rendered in histogram of ZnO grades of 20 samples (Figure 16), average ZnO grade is 4.44%, which in most samples is higher than 1%. Statistical analysis shows that the minor elements in Pb-Zn ore, show positive correlation with Zn as well.
2.2.2. Trend of Rare Earth Elements (REE’s) Variation in the Robat Pb-Zn Deposit
The REE’s which are totally 17 elements constitute the 15 elements of the Lanthanide group within the periodic table of elements (La to Lu) plus Sc and Y. The first 7 elements of the Lanthanide group after La (Ce, Pr, Nd, Pm, Sm, Eu, Gd) are the Light Rare Earth Elements (LREE’s) and the following subsequent 7 elements (Tb, Dy, Ho, Er, Tm, Yb, Lu) are the Heavy Rare Earth Elements (HREE’s) [5] . The spider diagram of REE’s normalized values to CI-condrite meteorite (Figure 17) illustrates that mineralized veins hosted by carbonates at the Robat Pb-Zn deposit have an enrichment of LREE’s
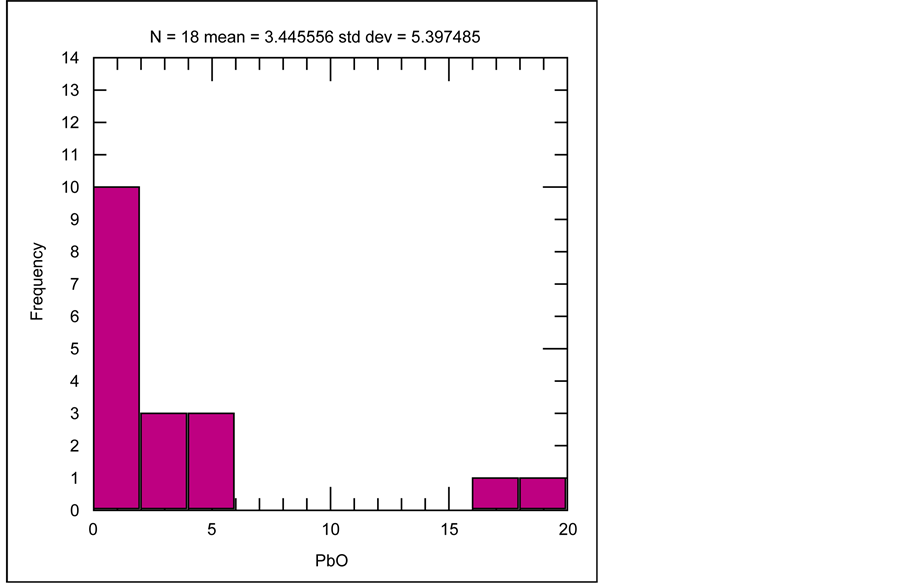
Figure 15. Histogram of PbO grade distribution, among 18 samples collected from mineralized veins, at the Robat Pb-Zn deposit.
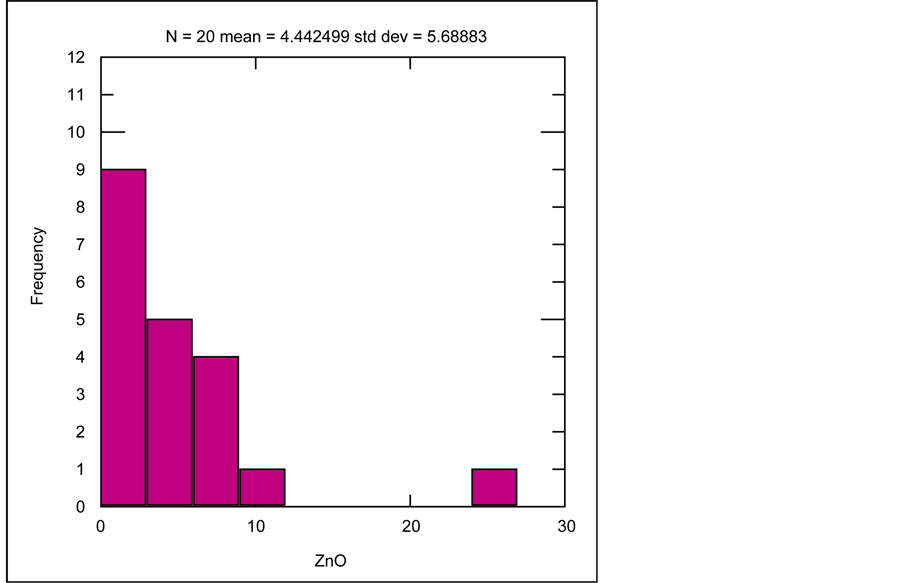
Figure 16. Histogram of ZnO grade distribution, among 20 samples collected from mineralized veins, at the Robat Pb-Zn deposit.
relative to HREE’s. The distribution also indicates values are variable in the range of 0.1 to 10 times from the CI-condrite values as well. The REE’s were also normalized to the North American Shale Composite (NASC) [6] and plotted as a spider diagram (Figure 18), which renders patterns of variation from this standard in the range of 0.1 to more than 1, and once again indicates enrichment of LREE’s in compare to HREE’s in samples from mineralized veins at the Robat deposit.
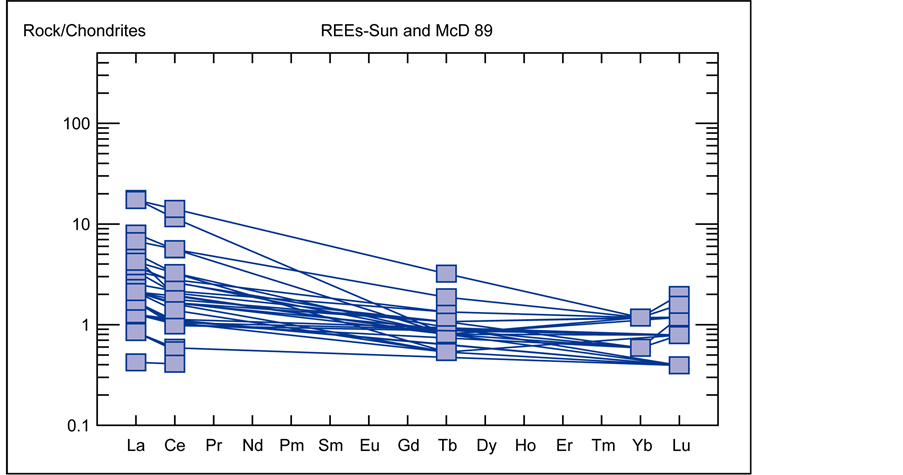
Figure 17. Distribution pattern of Rare Earth Elements (REE’s) of samples from the Robat Pb-Zn deposit, normalized to CI-condrite meteorite composition (Sun and McDonough, 1989).
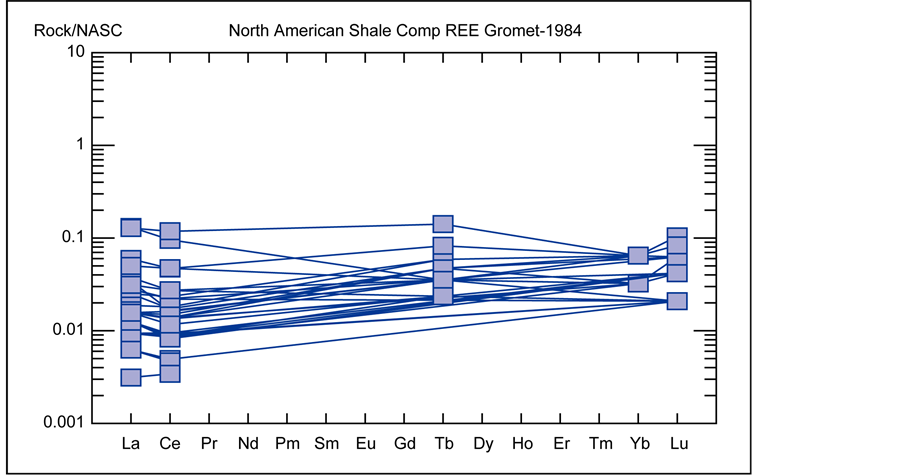
Figure 18. Distribution pattern of Rare Earth Elements (REE’s) in comparison to average content in shale of North America [6] .
2.3. Study of Fluid Inclusions
Totally 10 double-polished samples collected from mineralized veins of the Robat Pb- Zn deposit have been selected for fluid inclusion studies, by applying the THMS600 Linkam heating-freezing stage with an assembled Zeiss microscope. The heating- freezing stage range is −196 to +600˚C, besides having two thermal controllers of TP94 and LNP for heat and freezing respectively. Calibrating the heating-freezing stage permits achieving accuracy of ±0.6˚C, by using cesium-nitrate at the melting point of 414˚C, besides applying the n-Hexane compound for freezing calibration, at the melting point of −94.3˚C.
Besides shape and size of fluid inclusions, their genetic category (primary, secondary, pseudo-secondary), their content (Liquid; Vapor; Solid) and the Vapor/Liquid ratio, type of daughter crystals (considering crystal form and morphological appearance), and other features such as “leakage” and “necking-down” are detected; which thermal study of the last two features could only be reliable under very specific conditions. For detailed study of features in fluid inclusions, they have been studied under 500, 625 and 800x magnification.
2.3.1. Appearance of Fluid Inclusions
Most fluid inclusions in samples collected from mineralized veins at the Robat Pb-Zn deposit are primary in origin and in the range of 5 to 20 microns in diameter, which are considered small to medium size. Primary fluid inclusions are mostly larger than secondary fluid inclusions which are much less in number. In general shape of fluid inclusions are different and are mainly controlled by crystallization system of hosting minerals. In samples from the Robat deposit, shape of fluid inclusions could be classified in two groups of elongated and irregular polygon shaped inclusions.
Different classifications of phase constituents of fluid inclusions have been provided, which the 5 class category provided by Nash and Theodor, 1971, is a practical procedure of classification as follows: 1) Liquid + Vapor (L+V); 2) Vapor + Liquid (V+L); 3) Liquid + Vapor + Solid (L+V+S); 4) Liquid + Vapor + Daughter Mineral (L+V+DM); 5) CO2 Liquid + Vapor (CO2 L+V). In the fluid inclusions collected from the Robat Pb-Zn deposit, two types of fluid inclusions have been detected: L+V and CO2 L+V. Practically the second type of fluid inclusions are divided into two subclasses of: aqueous CO2 Liquid with CO2 vapor (which appears while freezing) and aqueous Liquid with CO2 vapor.
2.3.2. Freezing
For aqueous H2O-NaCl systems of fluid-inclusions, best procedure to determine salinity of fluid inclusions is freezing, because freezing points below of that for pure water directly indicates the amount of salinity of salt (NaCl equivalent) dissolved within the liquid. Generally the term freezing is applied for temperature of a fluid inclusion reduced from standard room temperature (25˚C at 1bar pressure) up to the limit that first crystals of ice would be observed. Afterwards the completely frozen liquid is re-heated until the first signs of melting appears which is the temperature of freeze melt (Tfm) and subsequently the temperature that the last remainders of ice melts and turns into liquid is the temperature of melting ice (Tm-ice). For determination of salinity within the fluid inclusion, the Tm-ice is applied for the double-graph of H2O-NaCl fluid inclusion systems, provided by Edwin Roedder, 1984 (Figure 19).
In Figure 19, salinity (measured by weight percent of NaCl equivalent) and temperature of melting ice (Tm-ice), measured by degrees centigrade, are plotted on the horizontal and vertical axes respectively. When the temperature is reduced by the heating-freezing stage, at 10% NaCl salinity (for presentation on the graph, Figure 19), first crystals of ice crystallize, in point “C” which is the eutectic-point a mixture of ice and hydro-halite forms. Actually, this phase could be considered the threshold for crystallization and transfer of heat within the fluid. The first crystallization temperature of ice (Tfm) and final melting of the ice crystal (Tm-ice) are measured while heating the sample after freezing; relevant salinities are measured and plotted on the phase-diagram of the H2O-NaCl system as well.
In the histogram illustrated in Figure 20, frequency of salinity values measured in fluid inclusions from samples of the Robat deposit render salinities mainly bounded between 5 to 10 wt% NaCl eq.
High salinity of some fluid inclusions resemble their magmatic origin, which such fluids have migrated from to shallower depths and mixed with meteoric waters penetrating from the surface. In some cases low salinities reflect pre-boiling conditions of fluids, as well as moderate salinities that could resemble conditions of remaining fluids after un-adiabatic boiling in an open system, which represent conditions of entrapments of coexisting fluid inclusions with various salinities in a single crystal. However, when fluid inclusions with various salinities are present in a single sample, usually both fluids from magmatic and meteoric origin are responsible for ore-mineralization [8] .

Figure 19. Phase diagram of H2O-NaCl systems of fluid inclusions [7] .
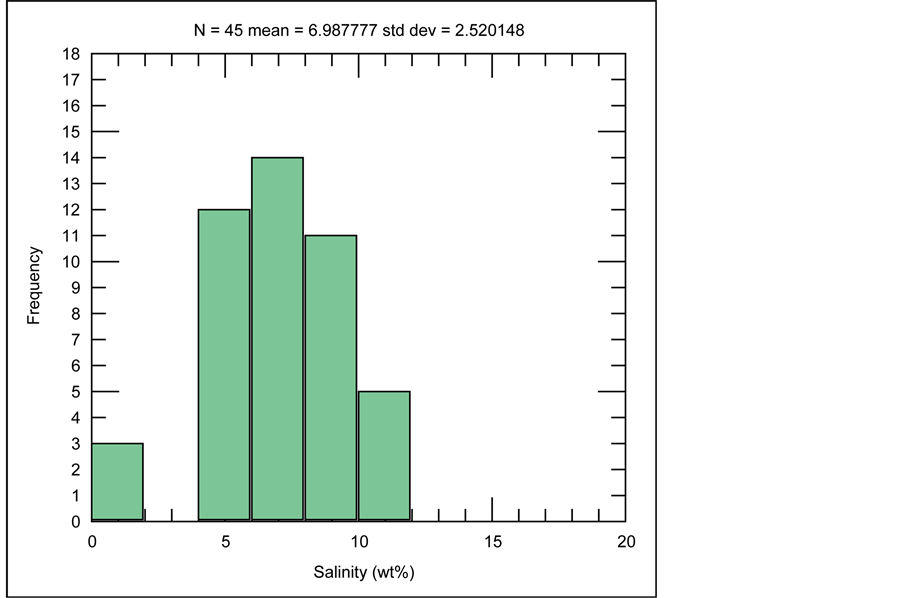
Figure 20. Histogram for distribution of salinity values in fluid inclusions of samples from Robat Pb-Zn deposit.
At the freezing stage, by measuring the temperature that freezing begins, salinity could be determined, which the histogram of Tm-ice variations is also plotted (Figure 21). When heating the frozen liquid, for most samples of the Robat deposit, the temperature of −10˚C has been determined as the Tm-ice temperature.
By increase of salinity the Freezing Point increases as well, as illustrated in the Tm-ice- salinity graph of Figure 22.
2.3.3. Fluid Density
Density of fluids in fluid inclusions of samples from the Robat Pb-Zn deposit varies in the 0.5 to 0.8 gr/cm3 range. Variation in fluid density effects homogenization temperature which has an inverse relation with salinity and in turn precipitation of geochemical legend forming the ore mineralization. Gas-escape from the fluid in the form of bubbles causes increase in the fluid density of the remaining fluid, known as the condensation process [9] . Situation of fluid density in fluid inclusions of Robat samples are provided in Figure 23.
2.3.4. Calculation of Fluid Pressure
By measuring the temperature that halite crystals dissolve in the liquid, besides measuring the temperature that L and V phases homogenize (Th), for different samples from the Robat deposit, these values have been plotted over the salinity versus homogenization temperature (Th) graph for determination of pressure (depth) of fluid inclusions
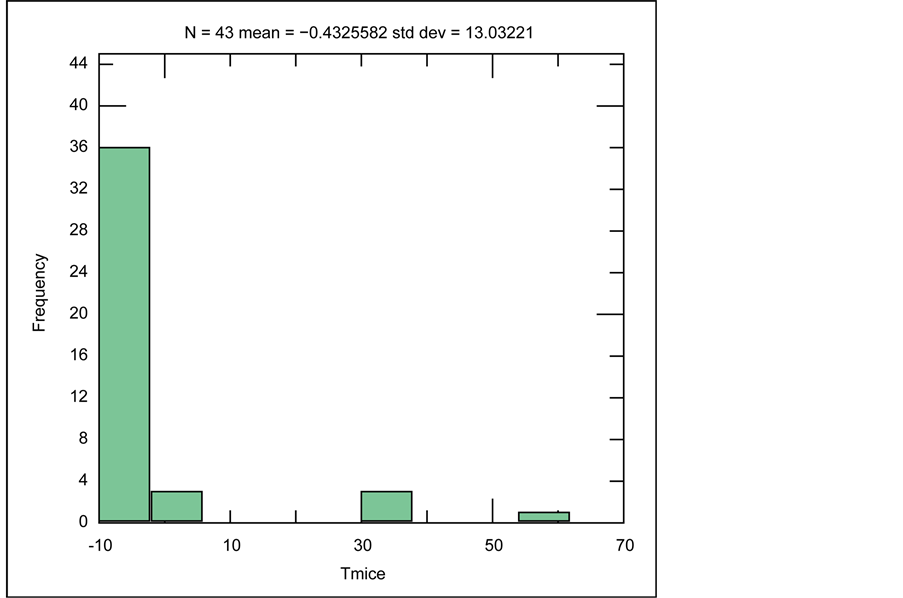
Figure 21. Histogram of distribution of Ice Melting Point (Tm-ice) in fluid inclusions of samples from Robat Pb-Zn deposit.
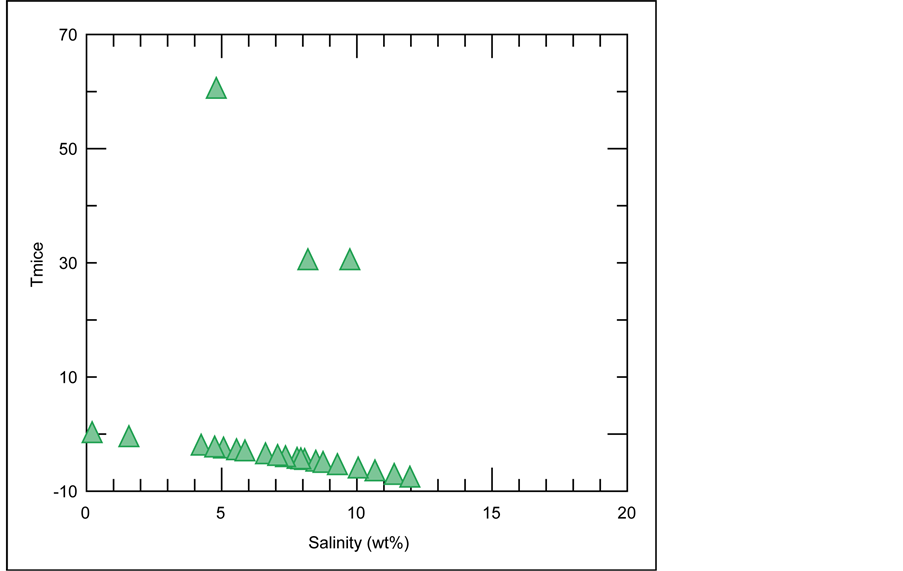
Figure 22. Tm versus Salinity graph for fluid inclusion samples from Robat Pb-Zn deposit.
[7] - [10] . Accumulation of plotted points in a certain area over this graph indicates that precipitation of ore-forming Pb-Zn mineralization at the Robat deposit has occurred mainly at less than 50 bars pressure, resembling less that 200 m paleo-depth (Figure 24).
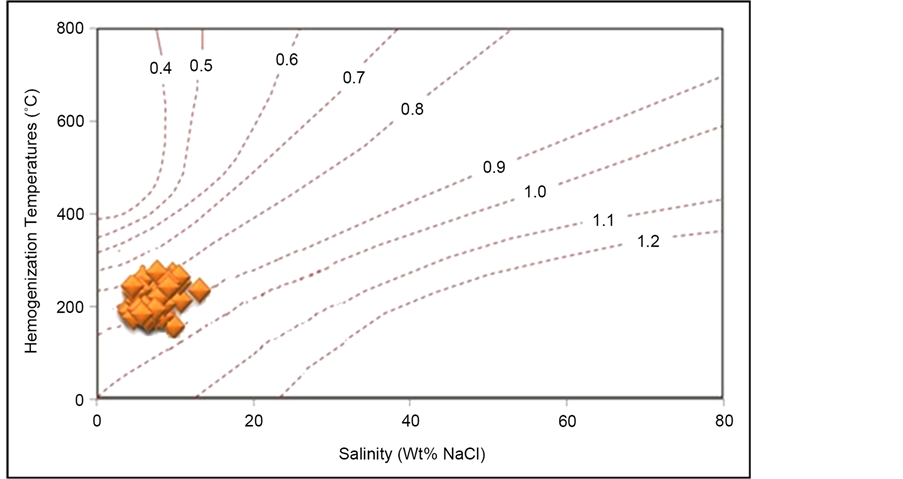
Figure 23. Temperature of homogenization (Th) versus salinity graph for fluid inclusions, in samples from the Robat Pb-Zn deposit.
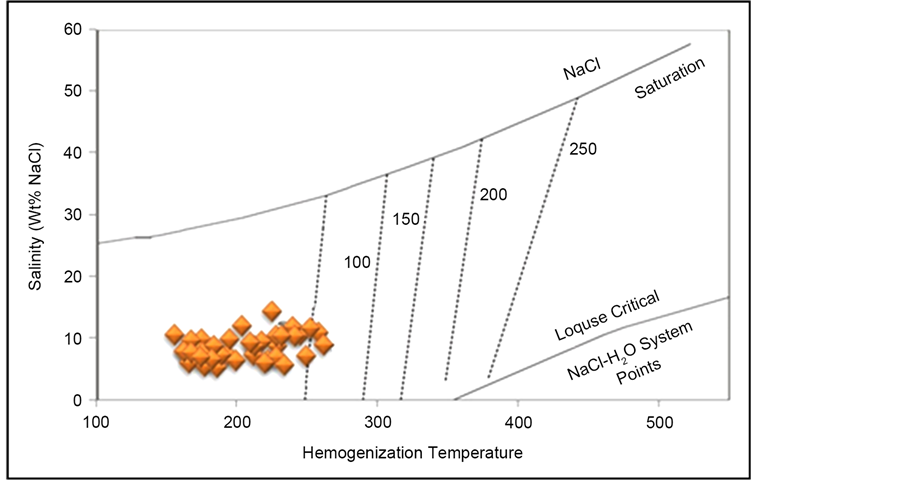
Figure 24. Determination of pressure (depth) via the salinity versus homogenization temperature (Th) graph for fluid inclusions (Roeder, 1984), indicating that precipitation of ore-forming Pb-Zn mineralization at the Robat deposit has occurred at less than 50bars pressure, resembling less that 200 m paleo-depth.
3. Conclusions
Results of field surveys, sampling, petrographic and mineralographic study of samples, besides study of fluid inclusions collected from silicified veins of the Robat Pb-Zn deposit indicate that this deposit shares many characteristics in common with other Pb-Zn deposits located in the Pb-Zn metallogenic belt of Malayer-Isfahan. Some of other well-studied Pb-Zn deposits within this metallogenic belt are Ahangaran, Emarat, Muchan, Kelisheh, Haft-Savaran, Lakan, Hossein-Abad, which all cases strata-bound Pb-Zn veins are hosted by limestones of Cretaceous age, which in the vicinity of some of these deposits, there are intrusive bodies/stocks that could have assisted ore-concentration by acting as a heat-source reflected in their higher grades and reserves. However, no evidence of intrusive bodies has been detected in the vicinity of the Robat deposit.
Associated with mineralized veins at Robat, silicification, carbonitization, argillization and hematitization are present. The ore-mineralization has vein-veinlet, fracture- filling and replacement textures. Mineralographic and fluid-inclusion studies of samples render evidence of at-least two types of mineralizing fluids, representing multiphase mineralization events in this deposit. Characteristics of two preliminary-type fluids have been determined via fluid-inclusions, one having two phases of L and V, and the other being enriched in CO2. The temperature of homogeneity (Th) of fluid-in- clusions is within the 160˚C to 270˚C range, having the most frequency from 180˚C to 190˚C and an average salinity of 5 to 10 wt% NaCl equivalent. The salinity could be explained by mixture with meteoric waters. Based on the salinity versus temperature of homogenization (Th) graph for determination of pressure (depth) of fluid inclusions, it is understood that mineralization at the Robat deposit occurs at less than 50 bars pressure, resembling paleo-depths less than 200 m, which coincides with conditions of Mississippi Valley Type (MVT) Pb-Zn deposit type.
Acknowledgements
The authors hereby appreciate financial and technical assistance of Iranian Mines and Mining Industries Development and Renovation Organization (IMIDRO) granted to this study as a PhD thesis of Economic Geology. Special acknowledgement is presented to Mr. AliReza Babakhani from Pichab Kansar Consulting Engineers Company for providing documentation from the active exploration project at the Robat Pb-Zn deposit.
Cite this paper
Mahdavi, G., Khakzad, A. and Lotfi, M. (2016) Conditions of Ore-Mineralization and Geochemical Correlation of Rare-Elements at the Robat Pb-Zn Deposit, West of Khomein, Central Iran. Open Journal of Geology, 6, 1118-1136. http://dx.doi.org/10.4236/ojg.2016.69083
References
- 1. Stocklin, J. (1968) Structural History and Tectonics of Iran: A Review. American Association of Petroleum Geologists Bulletin, 52, 1229-1258.
- 2. MolaeiBiragani, A. (1989) Prospecting Plan for Pb-Zn Deposits in Robat Area (South of Arak Province). Report No. 18, Geological Survey of Iran (GSI).
- 3. Pichab Kansar Consulting Engineers Company (2012) Exploration Report of Robat Lead-Zinc Deposit (West of Khomein). Unpublished Internal Company Report.
- 4. Mahdavi, F., Khakzad, A., Nezafati, N. and Vousughi Abedini, M. (2015) Geochemical Characteristics of the Kal-e Kafi Cu-Mo-Au Porphyry Deposit, Central Iran. Arabian Journal of Geosciences, 8, 10739-10758.
http://dx.doi.org/10.1007/s12517-015-1893-5 - 5. Khakzad, A. (2008) Metallogeny and Exploration of Special Metals. Pelk Publications, Iran, 215 p. (In Persian)
- 6. Gromet, L.P., Dymek, R.F., Haskin, L.A. and Korotev, R.L. (1984) The “North American Shale Composite”: Its Compilation, Major and Trace Element Characteristics. Geochimica et Cosmochimica Acta, 48, 2469-2482.
http://dx.doi.org/10.1016/0016-7037(84)90298-9 - 7. Roedder, E. (1984) Fluid Inclusions. Reviews in Mineralogy, Vol. 12, Mineralogical Society of America, 644 p.
- 8. Hass, J.I. (1971) The Effect of Salinity on the Maximum Thermal Gradient of a Hydrothermal System at Hydrostatic Pressure. Economic Geology, 66, 940-946.
http://dx.doi.org/10.2113/gsecongeo.66.6.940 - 9. Wilkinson, J.J. (2001) Fluid Inclusions in Hydrothermal Ore Deposits. Lithos, 55, 229-272.
http://dx.doi.org/10.1016/S0024-4937(00)00047-5 - 10. Berberian, M. and King, G.C.P. (1981) Towards a Palaeogeography and Tectonic Evolution of Iran. Canadian Journal of Earth Sciences, 18, 210-265.
http://dx.doi.org/10.1139/e81-019