Optics and Photonics Journal
Vol. 3 No. 2 (2013) , Article ID: 32868 , 10 pages DOI:10.4236/opj.2013.32032
Stress Sensing by an Optical Fiber Sensor: Method and Process for the Characterization of the Sensor Response Depending on Several Designs
1Volumion Company SAS, Mulhouse, France
2Research Unit for Industrial Technologies URTI/CSC, Annaba University, Annaba, Algeria
3Icube Laboratory, Strasbourg University, Strasbourg, France
Email: remouche@yahoo.fr
Copyright © 2013 Mustapha Remouche et al. This is an open access article distributed under the Creative Commons Attribution License, which permits unrestricted use, distribution, and reproduction in any medium, provided the original work is properly cited.
Received February 27, 2013; revised March 19, 2013; accepted March 28, 2013
Keywords: Optical Waveguide; Optical Fiber; Sensor; Force; Stress; Strain; Microbending
ABSTRACT
In this paper we propose an analyzing of the response of a stress optical fiber sensor of which we proposed several design. We show that an optical fiber sensor with these designs can covenanting allow the measuring the force/stress applied to a mechanical structure or which it is linked, by optimizing the uses of appropriate materials for constituting the sensor support. The experiment that we introduce to validate our approach based in principles includes design with a support bearing a multimode optical fiber organized in such a way that the transmitted light is attenuated when the fiber-bending angle coming from stitching in holes of the support is modified by the effects of the force/stress applied to the optical fiber sensor realized in this way. The tests realized concern the most relevant parameters that define the performances of the stress sensor that we propose. We present the problems that we to solved for the optimization of the sensor for selecting the more efficient material for the optical fiber sensor support related to a relevant choice of optical fibers.
1. Introduction
Macrobend and microbend losses in optical waveground, have been discussed for a large set of optical fiber sensors in related publications. These sensors were used to measure: temperature, pressure, chemical species, strain, moisture, force, displacement, acceleration, etc. [1-11]. Optical fiber, microbend sensors are based on the control and the analysis of the couplings and the leakages of modes that are propagating in a deformed microbend optical fiber [11-14] by fiber output light energy measurement. Some previous studies have discussed the losses due to the macrobending of the microbend optical fiber axis. These studies did not take into account the effects coming from the mechanical specificities of the material support that is bearing by a fiber stitching in a holes network the microbented optical fiber sensor, on the microbent optical fiber sensor response. These supports have high and low stress zones when they are bent.
Our purpose is to characterize the effects of some mechanical specificities of the support bearing on microbent optical fiber sensor. This support has a periodic array of holes inside which the optical fiber is threaded to constitute the optical fiber stress sensor. The period of the fiber microbending is resulting of the threading constant, The perforations are located only in the support high stress zones.
2. Background: Basic Principles of a Microbent Optical Fiber Sensor for Constraints Analyses and Measures
The refractive index profile distribution in the optical fiber is described by the following equation:
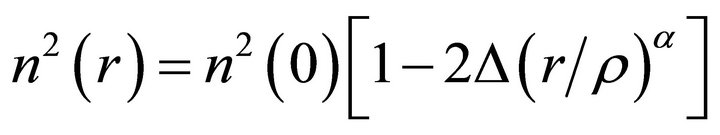 (1)
(1)
where 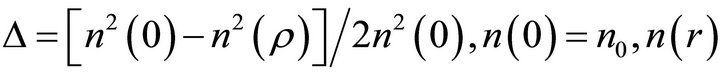 and
and  are respectively the refractive indices at distances 0, r and
  from the fiber axis and
  is the core radius it includes both parabolic
  and step
  profiles. The modes propagating in an optical fiber with the core index described by Equation (1) may be associated into mode groups having a principal mode number m and a longitudinal propagation constant
  given by the Equation (2) (WKBJ approximation method) [12-14]:
 (2)
(2)
where  is the wave vector module,
 ![]() is the optical wavelength, and
is the optical wavelength, and  is the total number of guided modes propagating inside the fiber,
![]() (3)
(3)
The spacing between two adjacent mode groups ![]() and
and  is given by the following equation:
 (4)
(4)
If there is a mechanical dynamic perturbation applied to the microbent fiber having a spatial wavelength of  such that:
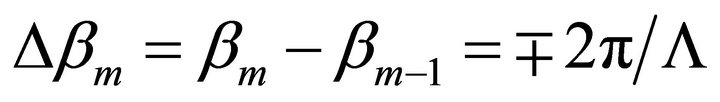 (5)
(5)
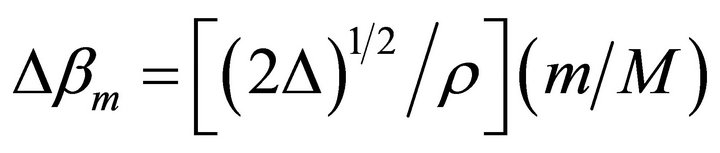
It may couple two modes groups by satisfying the selection rule that induce the coupling to the nearest neighbor.
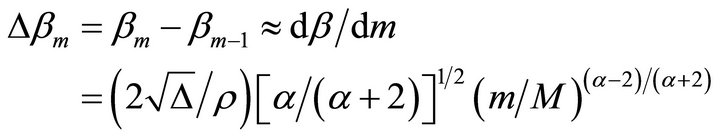
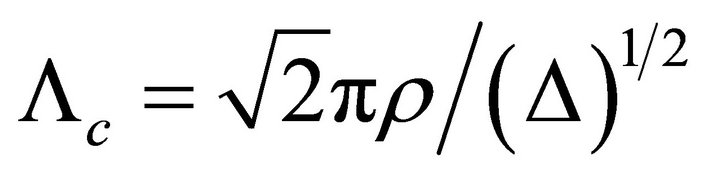
With a parabolic index profile for the microbent optical fiber, adjacent mode groups are separated by a critical constant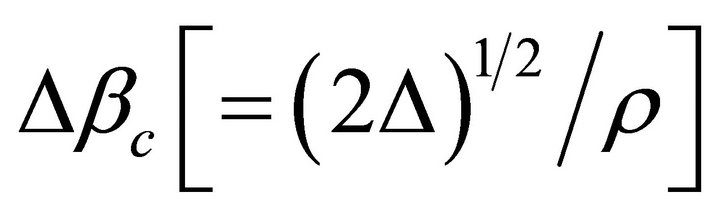 ; A modification of the spatial wavelength
  can couple all the neighboring mode groups:
 (6)
(6)
With a step-index profile of the optical fiber, the spacing  is defined by Equation (4) with
![]() ,
,
 (7)
(7)
and
 (8)
(8)
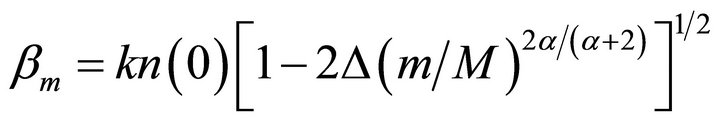
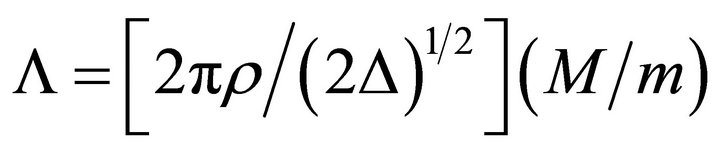
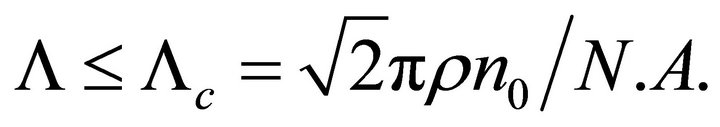
where , There are
  possible values of Λ to couple the modes. The (m/M) ratio corresponds to the normalized order of the group of modes. The upper limit corresponds to the highest pair of guided modes (
 total coupling of modes). For an optical fiber having mode-independent intrinsic loss, the guided light power must be coupled across this highest
  to reach the radiation spectrum. A significant loss would appear for the following distortion of the periodicity of bent:
 (9)
(9)
3. Experimental Set-Up
The experimental setup is showed in Figure 1.
3.1. Optical Fiber System
The bent optical fiber by stitching that will constitute the sensor is integrated in a mechanical fiber holding structure that builds up the whole force/stress sensor as shown in Figures 1 and 2. The holding support of the fiber with microbends that constitute the sensor consists of a flexible support, typically a piece of rubber, on which a multimode optical fiber is woven with a period Λ (Figure 2).
Light propagates from one end of the optical fiber (light input) to the other end of the optical fiber (light output) trough series of microbending by stitching the
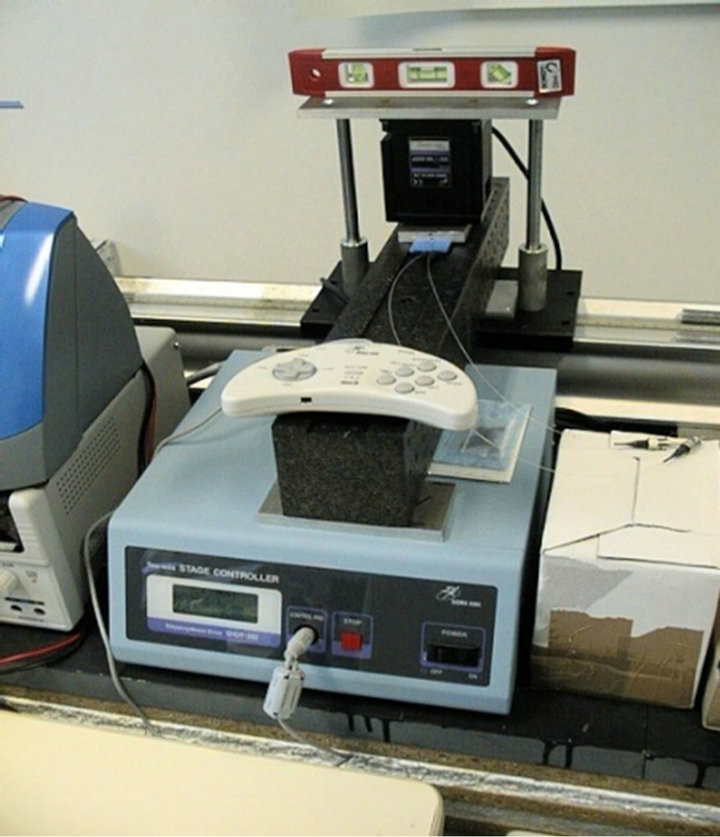
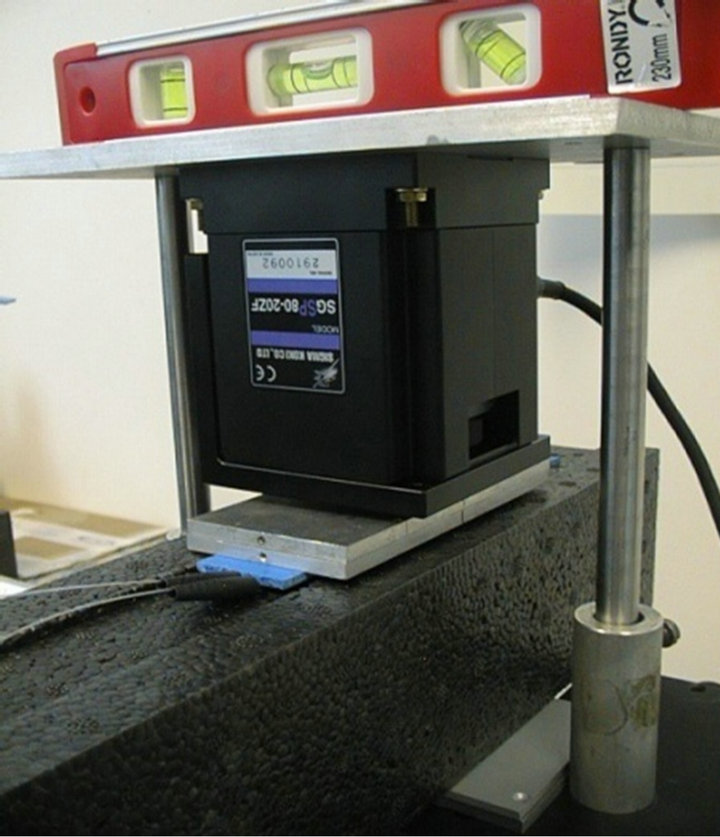
Figure 1. Experimental set up.
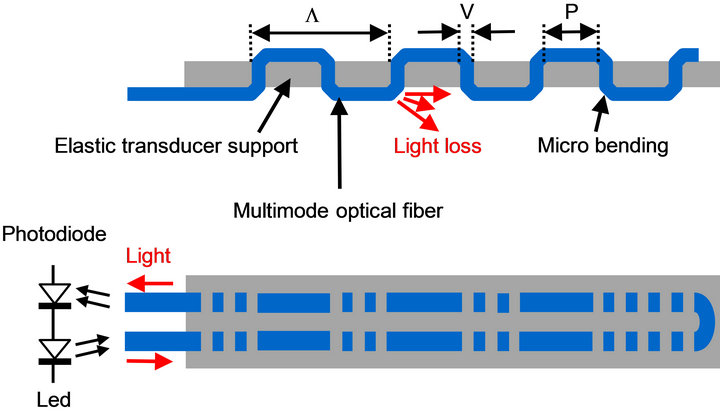
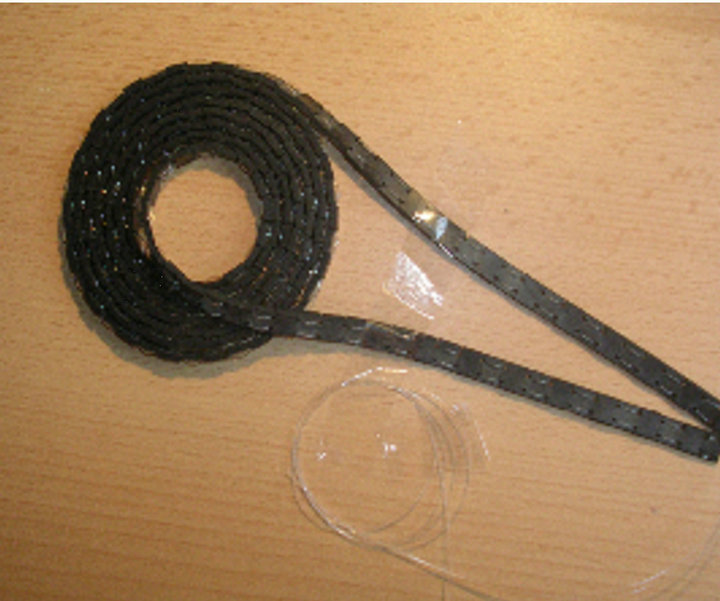
Figure 2. Schematic diagram of the proposed microbend optical fiber sensor design. Λ: mechanical wavelength of the periodic perturbation, V: perforated length zone, P: nonperforated zone.
optical fiber into the holes of support. At each bend (located in a support hole) along the optical fiber, some optical power “leaks” out of the optical fiber and so induces an optical energy loss of the light propagating inside the fiber. The magnitude of the optical loss depends mainly on the microbending mechanical wavelength (distance between support holes) and to some extend of the radius of curvature and the length of the microbent segment.
As it can be seen in Figure 3, the force/stress sensor is sandwiched between a front plate and a back support or between a deformable upper plate (e.g. in PVC) and a back piece of foam. If a force F is applied to the front plate, the thickness of the sensor decreases and thus the microbending period it also diminished. As the period decreases, the optical loss increases. As a result, the measurement of the attenuation of the light that propagates along the microbent segments at the output of the fiber yields to a direct measurement of the force/stress applied through an analysis of the sensor optical energy modulations response at its output.
3.2. The Temperature Chamber Used for the Experimental Tests of the Sensor
In order to run a temperature test of the response of the sensor to temperature modulations, a programmable temperature chamber that provides temperature modulation data to the computer through a RS-232 serial interface that can also allow to control the temperature modulation of the chamber (Figure 4). The temperature modulation was programmed to run temperature pre-defined cycles, the response to the stress of the optical fiber sensor located in the chamber was forwarded and recorded by the computer.
3.3. Step Motor Used for the Experimental Test
To apply the force, we use a step motor that has a 50 nm resolution, a 20 mm course and can move a load of 150 N maximum. It is driven via a GPIB interface by a PC computer. So repeatedly the step motor applies an effort (a calibrated force) to bent optical fiber the transducer. This set up can be also used to apply a torque.
A Labview software drives the motor according to the
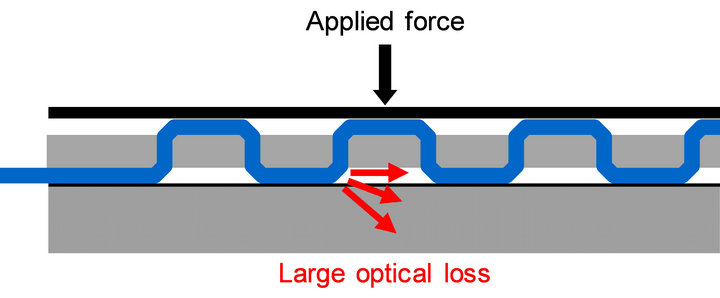
Figure 3. Optical fiber force sensor sandwiched between a deformable front plates.
chosen test process. The user first defines the successive absolute positions that the motor has to reach. He defines this way a displacement cycle. The steps of this cycle are:
• A single displacement cycle;
• A finite number of displacement cycles;
• Continuous and repeated cycles until the user stop the execution.
3.4. Standard Force Sensor
A commercial force sensor with a dynamic range of 50 N is inserted in the chamber with the step motor to measure as a reference the actual effort applied to the sensor (Figure 5).
The analog signal from the reference is amplified and directly recorded by the acquisition system. To test correctly the proposed sensor, we need first to calibrate it. The calibration consists in setting several weights between 0 and 60 N applied to the sensor, and to measure the sensor light output as the voltage from a photoconverter (Figure 6).
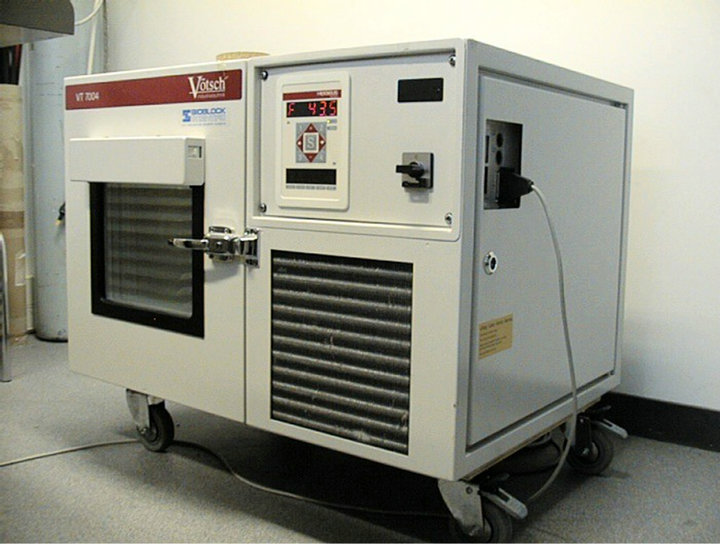
Figure 4. Temperature chamber.
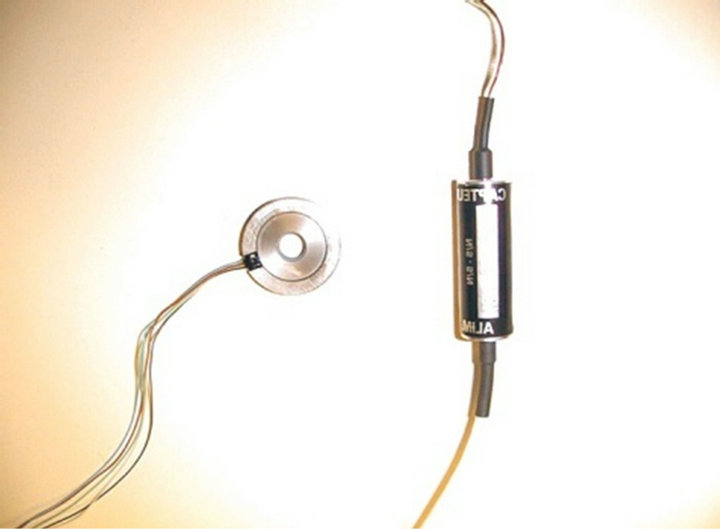
Figure 5. Commercial force sensor used.
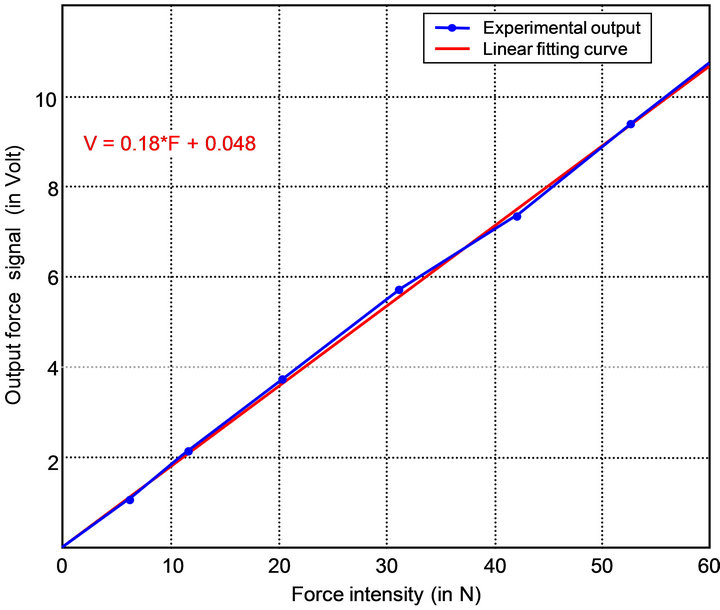
Figure 6. Standard reference force sensor response.
We observe that the response is almost linear with small fluctuations. These fluctuations are recorded during a 24 hours test (see Figure 7).
During 24 hours the reference sensor fluctuations can be neglected, (0.07% of FS) (Figure 7). A hysteresis phenomenon was also observed (Figure 8) that can be neglected. We conclude that we do not need to take in account these fluctuations for our evaluation tests.
4. Investigations with the Experimental Set Up
Two different fibers have been implemented in sensor prototypes in order to determine among them the bestsuited fiber for the force/stress intrinsic optical fiber sensor.
4.1. Step Index Optical Fiber: Silica Core/Hard Polymer Cladding Fiber (HCS200/230/500)
The core, cladding and coating diameters of the optical fibers we used are respectively 200 µm, 230 µm, 500 µm. These fibers were selected for their good mechanical behavior. When a fiber has to react to the actions of a network of microbendings of period Λ, the condition of coupling between the guided modes and the radiant modes is given by Equation (9) with :
:
 (10)
(10)
where  and
and . What gives for the period:
  Every optical fiber has a mechanical critical curvature radius RC for which the fiber will get broken [14]. Hence, the space requirement of the stress optical fiber sensor that we propose is imposed by this minimum. The lifetime of the proposed optical fiber sensor will be shorter if the bend diameter of an optical fiber bend of this sensor is close to this critical
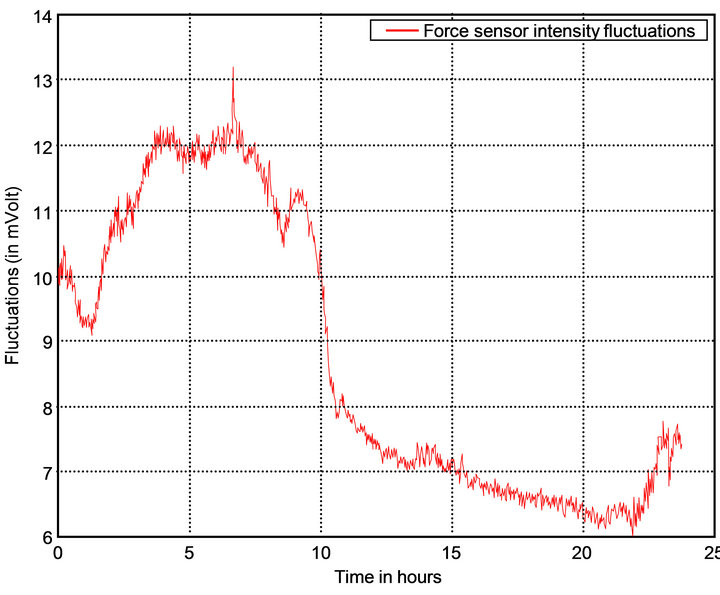
Figure 7. Reference force sensor fluctuations.
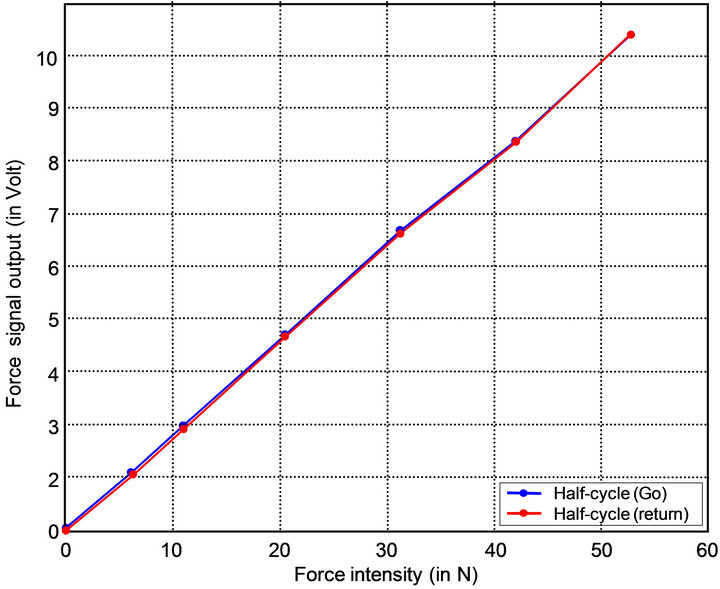
Figure 8. Calibration force sensor response (go/return cycle).
fracture diameter.
For reasons linked to the mechanical limits of the optical fiber constituting the sensor that we propose and the significant light energy losses of the signal, associated with extreme bending of the optical fiber it is obvious that we cannot select a period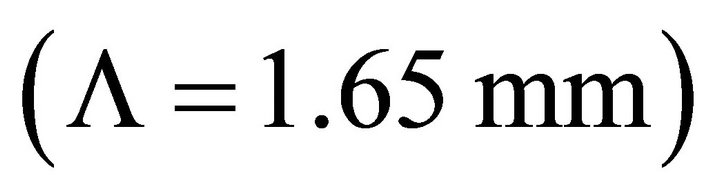 . Close to the bending limit there is a critical bending range, which results from a phenomenon of energy exchange between modes, even if the inequality (Equation (10)) is not respected, that has to be avoided.
We chose periods that are multiple of Λ, with a duty cycle (ratio of dimensions between not perforated zone and perforated zone) that take into account the conditions (that are mentioned in Table 1).
The holes networks used to stitch the optical fiber were engraved for evaluation on two different materials: the first one in EPDM (rulber) with a thickness of 2 mm and the second one in PVC with a thickness of 1.5 mm.
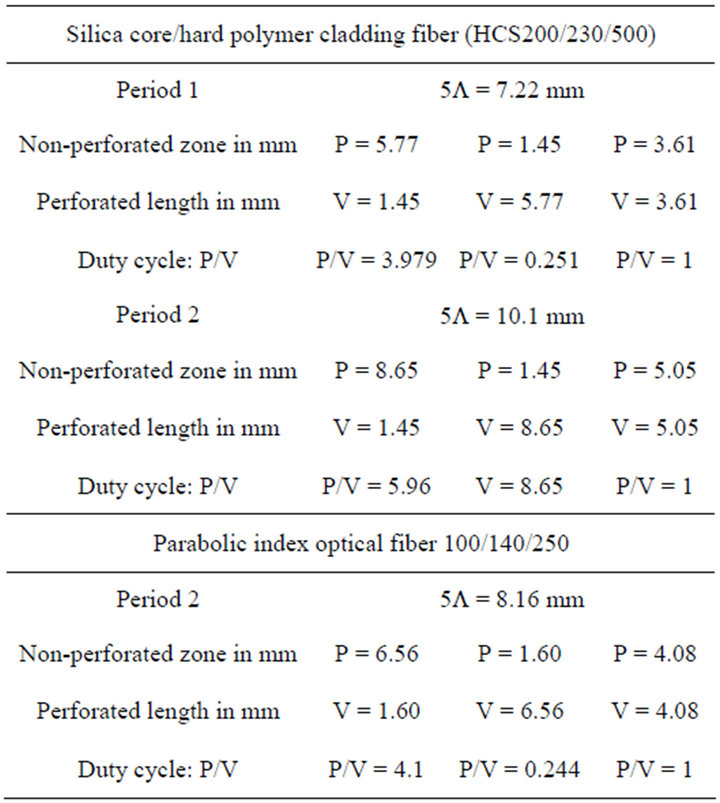
Table 1. Stitched networks mechanical parameters.
We have selected four hardness for each material: “Shore A50”, “Shore A60”, “Shore A65” and “Shore A75”.
The losses induced by a fiber bend curvature of radius R can be approached by the following expression [4]:
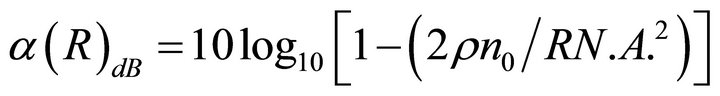 (11)
(11)
This expression shows that the fiber holes related organization parameters should be adjusted to obtain the best sensitivity for the sensor. That we, in our case RC is defined by the thickness of the support, the period and the duty cycle of the network of microbending.
4.2. Parabolic Index Optical Fiber 100/140/250 with Acrylate Coating Material
The core, cladding and coating diameters are 100 µm, 140 µm, 250 µm respectively. This fiber is chosen for its higher sensitivity, to stress by microbending. A network of bending induced by holes of, with a period Λ will determine the coupling conditions between guided modes and radiated modes it is given by Equation (6) with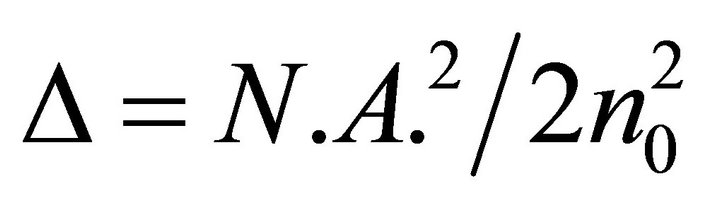 :
:
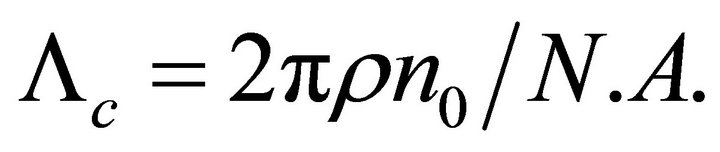 (12)
(12)
where  and
and . What gives for the period:
This relation remains valid when we choose the multiples of the period  it is the contrary with the step index fiber.
5. Discussions about Experimental Results
The experimental work consists in characterizing the sensor according to the force/stress and to the temperature and the support material used depending on the fiber characteristics.
5.1. Sensor Made with a Parabolic Index Optical Fiber 100/140/250
5.1.1. Effect of the Applied Force on the Response of the Sensor
The curves in Figure 9 show a good sensitivity of the sensor to the applied force when the condition concerning the critical period is respected ( , where
  is the critical period). This sensitivity decreases quickly when the period is going away from the critical period. The hard materials for the support which are the best suited to meet the range of forces that we used (30 N to 60 N) are the ones that correspond to the index “Shore A50”. By choosing a high value for the period for the microbending of the optical fiber (for example Λ = 9.8 mm) or a lower hardness (“Shore A45” or “Shore A40”) or a lower thickness (1 to 1.5 mm), we obtain a larger range of response.
5.1.2. Temperature Effects on the Responses of the Sensor
The study of the behavior of the sensor during a temperature cycle between 50˚C and +65˚C shows that the temperature variation effect on the light energy at the output of the fiber represents about 30% of the total light energy output with the presence of a hysteresis phenomenon (Figure 10). With some optical fiber, when it is very strongly curved, the sensor is not very sensitive to the temperature. This is very probably due to some movements of the EPDM support resulting from a heating effect. The test cycle has lasted a short time (2 × 30 minutes.)
What can explain the hysteresis. It is possible to also explain it by the fact that the fiber is bended in way that can induce it to be sensitive to the small movements of the support providing a too important sensitivity to the sensor. So we have in this way some possibilities to improve the stability of the response of the sensor with the temperature evolutions. Another possibility remains to be choice of a more stable material as a support.
5.2. Sensor Realized with Step Index Optical Fiber Hcs-200/230/500
5.2.1. Effect of the Force on the Response of the Sensor
This fiber was used for the stress sensor that we propose for the interest it presents related to the sensor production costs. From a sensitivity point of view, it appears that it
Figure 9. Response of optical fiber sensor with networks microbending of period Λ = 8.16 mm on a parabolic index optical fiber 100/140/250 (ON = 0.28) with duty cycles on supports in EPDM of thickness 2 mm, and with A50, A60, A65 and A75 of hardness. The force application length: 60 mm.
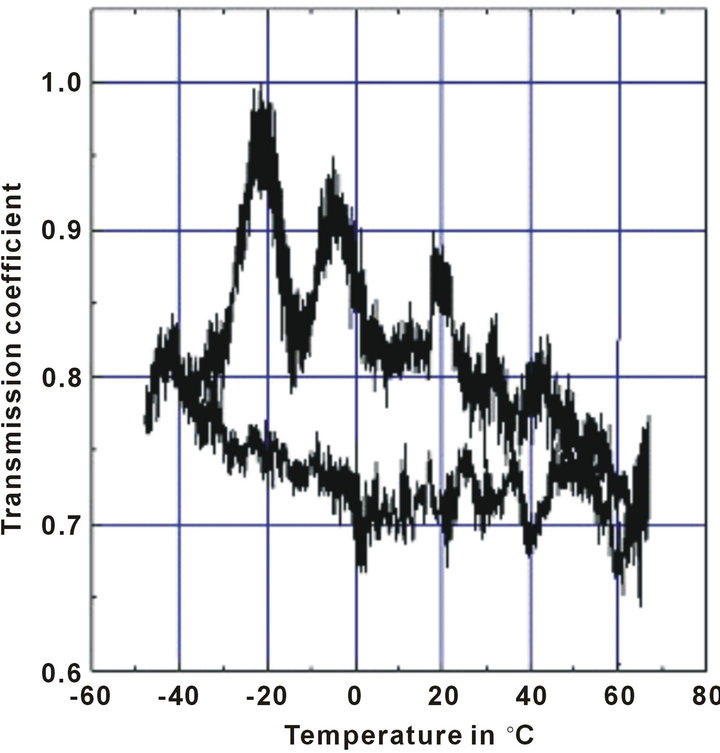
Figure 10. Behavior of the sensor as a function of the temperature. A parabolic index optical fiber 100/140/250 is woven with a microbending per hole on a network of holes having a period Λ = 8.16 mm on a support in EPDM thickness 2 mm and Shore hardness A50.
is the network having a 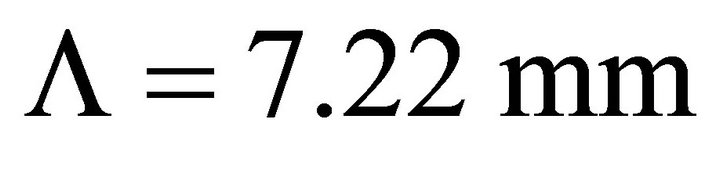 which gives the best results on a support in EPDM having a thickness of 2 mm and a Shore hardness: A75 (Figures 11 and 12). It should be noted that the dispersion of the sensor responses according to the parameters of the networks and according to the hardness of the support materials.
Another significant point has to be discussed when we compare the responses obtained by using two different materials the EPDM and PVC with identical networks design of microbending structure (Figure 13). The sensors using the PVC supports have very low sensitivities, we can suppose that the compression ratio of this material is much lower than the one of the EPDM. This difference makes us rejects the choice of such a material. It does not enable us to make a comparative study between two different thicknesses (1.5 mm and 2 mm) because it will not be relevant.
5.2.2. Effect of the Length or Which Forces Are Applied Surfaces
Another experiment consists to apply the same force to several lengths/surfaces what induce variations of the applied pressure. The results obtained are summarized in the Figure 14. They show, that, when the lengths/surface of the applied forces decreases, the sensitivity is better first, and then decreases quickly when the applied force increases. That is explained by the fact that the material is initially stiff and then becomes deformed and then reaches quickly a compression stationary phase, which limits the sensitivity.
For the important lengths/surfaces of forces application, with the same applied force, this stationary phase is not reached and the losses are added over several periods of microbending a better sensitivity results of that. So, we choose a material having a compression ratio propor-
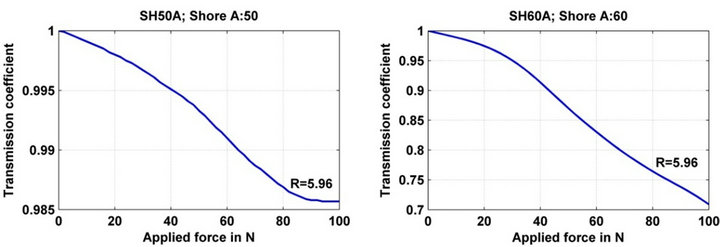
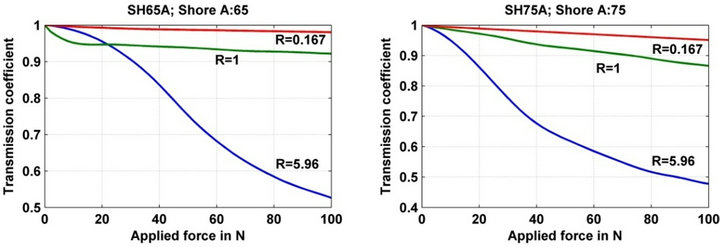
Figure 11. Responses of sensors realized with networks of hole microbending of period Λ = 1.01 mm on a step index optical with a hard cladding fiber 200/230/500 (ON = 0.39) with several duty cycles. The supports are made out of EPDM with a thickness of 2 mm, and a hardness value of A50, A60, A65 and A75. The force application length is: 60 mm.
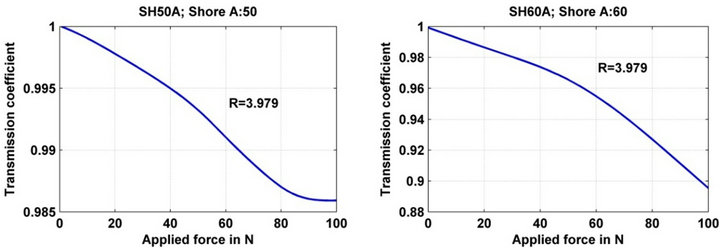
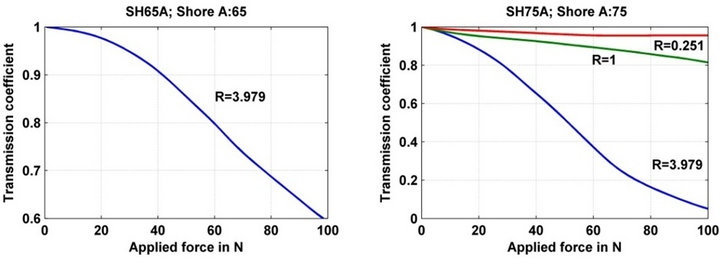
Figure 12. Response of sensors realized with network of hole with fiber microbending, the period is Λ = 7.22 mm a step index optical fiber used is: 200/230/500 (ON = 0.39) with a hard cladding with several duty cycles on supports made out of EPDM having a thickness of 2 mm, and a hardness of A50, A60, A65 and A75. The force application length is 60 mm.
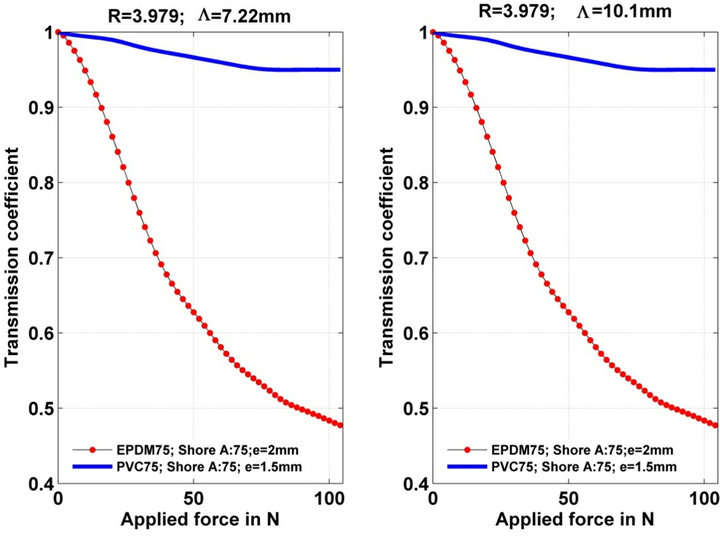
Figure 13. Response of sensor with networks of microbended optical fiber having periods Λ = 7.22 mm and Λ = 1.01 mm. The optical fiber has a hard cladding. They were step index optical fiber 200/230/500 (ON = 0.39) on a support made out of EPDM having a thickness of 2 mm. The PVC one has a thickness of 1.5 mm and a hardness Shore of a A75, the force was applicated on a length of 60 mm.
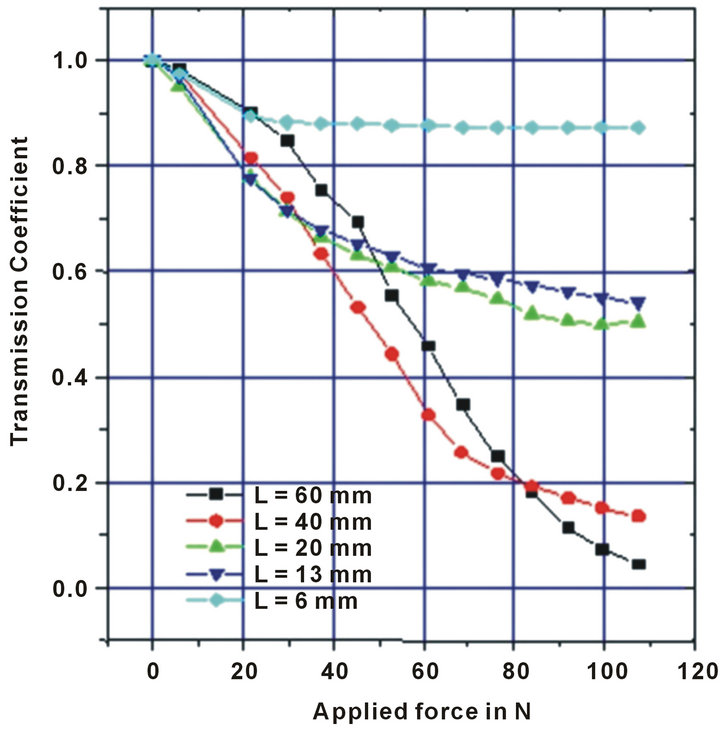
Figure 14. Influence of the length of application of the forces. The networks of microbending has periods of Λ = 7.22 mm a hard cladding optical fiber is used 200/230/500 (ON = 0.39) on supports made out of EPDM having a thickness of 2 mm and the PVC is thickness 1.5 mm. Shore hardness is A75, with several lengths of the force application: 60 mm; 40 mm; 19.5 mm; 13 mm and 6 mm.
tional to the applied force in the range 0 - 100 N. The use of a fiber coating harder than the support, will also allow the deformation over a more important length. Moreover, it seems that the sensor responses will become uniform as soon as we exceed a limiting lengths/surfaces of contact threshold that will depend on the compression ratio of the support material.
The use a hard coating, segmented over adapted lengths should, in theory improve, notably the uniformity of the sensor response. A threshold detector can be considered in this case the therefore, the threshold signal is reached for the lower stress.
5.2.3. Effect of the Temperature on the Sensor Response
The sensor, without a coating material on the optical fiber, was placed in a climatic room to a weight of 6 N was used to cause the stress. Jointly a cycle of temperature between −50˚C and +100˚C was applied to the sensor (Figure 15).
We observed a variation of about 30% of the response signal with a hysteresis phenomenon. This effect has two reasons, the first reason comes from the fact that an optical fiber when it is curved becomes sensitive to the temperature (Figure 16), the second one is related to support material (hysteresis), but with a smaller effect to coming from the size (0.5 mm) and of the rigidity of fiber. It should be noted that these variation present a good degree of linearity which could allow an easy compensation.
6. Conclusions
We have identified the most important parameters in the optical fiber stress sensor realized with the technology that we proposed which plays a part on the performances of the sensor such as: the choice of fiber, the choice of
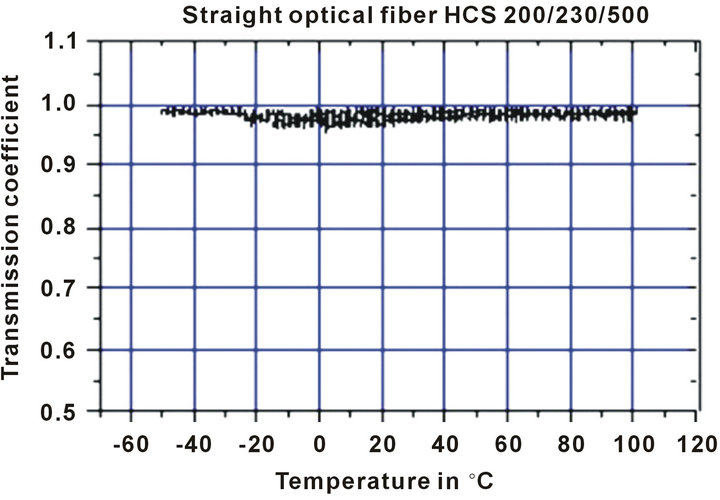
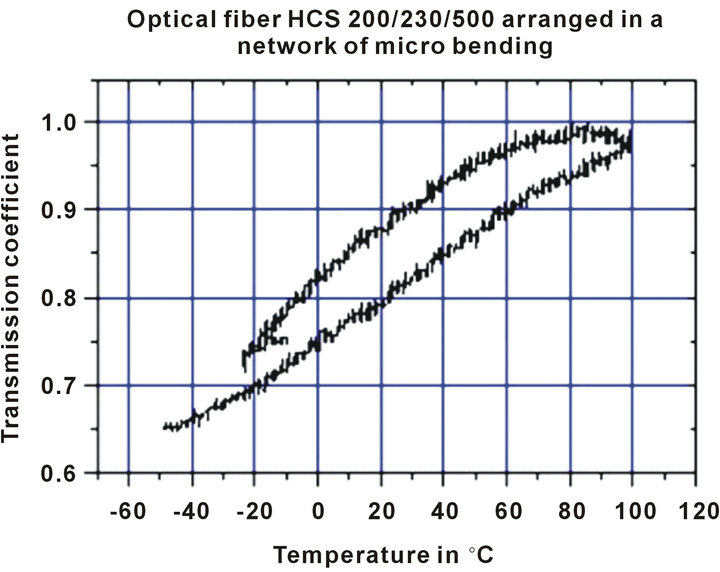
Figure 15. Response of the sensor as a function of the temperatures top: behavior of a sensor with a straight hardclad step index fiber profile 200/230/500 (ON = 0.39) bottom: the same fiber woven on a network of holes to form microbendings having a Λ = 7.22 mm period on a support in EPDM having a thickness 2 mm and shore hardness A7.5.
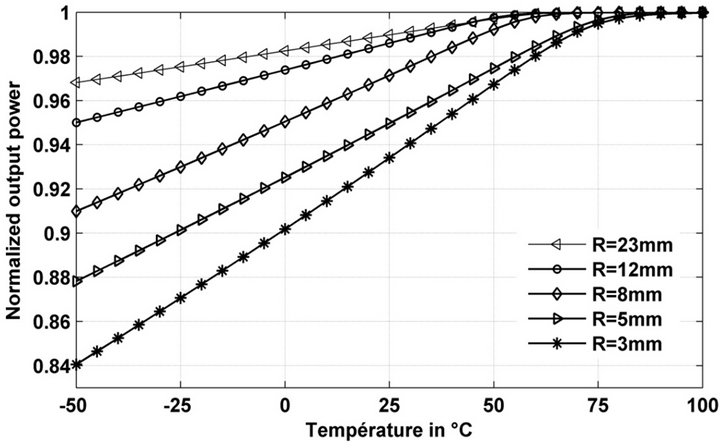
Figure 16. Behavior of the hard-clad optical fiber 200/230/ 500 (ON = 0.39) according to the temperature variations with different radii of curvatures.
the network of microbending induced by holes in a support and the choice of the material for the support. It was made possible to identify work of optimization, which remains to be done. First prototypes of validation were investigated with two fibers optics were associated with two different materials for constituting support:
1) HCS-200/230/500 optical fiber was associated with a support in EPDM having a hardness ranging of from 80 to 85 and a thickness of 1.5 mm.
2) The graded index fiber was associated with a support made out of EPDM with a hardness of 45 and a thickness of 1 mm.
There is still some optimization work to achieve for having a very good reproducibility of the sensor response for an applied force that stay local and then throughout the length of the sensor. Evaluation of the response times remains also to be made, it will depend on the choice of the design for support and coating.
REFERENCES
- M. Remouche, R. Mokdad and A. Chakari, “Intrinsic Integrated Optical Sensor Based on Waveguide Bend Loss,” Optics & Laser Technology, Vol. 39, No 7, 2007, pp. 1454-1460. doi:10.1016/j.optlastec.2006.09.015
- M. Remouche, R. Mokdad and M. Lahrashe, “Intrinsic Optical Fiber Temperature Sensor Operating by Modulation of the Local Numerical Aperture,” Optical Engineering, Vol. 46, No. 2, 2007, Article ID: 024401. doi:10.1117/1.2709854
- M. Remouche, F. Georges and P. Meyrueis, “Flexible Optical Waveguide Bent Loss Attenuation Effects Analysis and Modeling Application to an Intrinsic Optical Fiber Temperature Sensor,” Optics and Photonics Journal, Vol. 2, No. 1, 2012, pp. 1-7. doi:10.4236/opj.2012.21001
- A. Tioman, A. Chakari and P. Meyrueis, “Capteur de Température à Fibre Optique par Effet Modal,” Revue Pratique de Contrôle Industriel, Vol. 30, No. 168, 1991, pp. 64-68.
- M. Vaziri and C. Chen, “Optical-Fiber Strain Sensors with Asymmetric Etched Structures,” Applied Optics, Vol. 32, No. 31, 1992, pp. 6399-6406.
- S. Miclos and T. Zisu, “Chalcogenide Fiber Displacement Sensor,” Journal of Optoelectronics and Advanced Materials, Vol. 3, No. 2, 2001, pp. 373-376.
- L. S. Thomas, N. A. Geoge, P. Sureshkumar, et al., “Chemical Sensing with Microbent Optical Fiber,” Optics Letters, Vol. 26, No. 20, 2001, pp. 1541-1543. doi:10.1364/OL.26.001541
- J. B Freal, C. J Zarobila and C. M Davis, “A Microbend Horizontal Accelerometer for Borehole Deployment,” Journal of Lightwave Technology, Vol. LT-5, No. 7, 1987, pp. 993-996.
- S. G. Pierce, A. MacLean and B. Culshaw, “Optical Frequency-Domain Reflectometry for Microbend Sensor Demodulation,” Applied Optics, Vol. 39, No. 25, 2000, pp. 4569-4581. doi:10.1364/AO.39.004569
- D. Yadav and A. K. Nadir, “Transformer Temperature Measurement Using Optical Fiber Microbend Sensor,” Sensors & Transducers Journal, Vol. 84, No. 10, 2007, pp. 1651-1659.
- N. Lagakos, J. H. Cole and J. A. Bucaro, “Microbend Fiber-Optic Sensor,” Applied Optics, Vol. 26, No. 11, 1987, pp. 2171-2180. doi:10.1364/AO.26.002171
- L. Jeunhomme and J. P. Pocholle, “Mode Coupling in a Multimode Optical Fiber with Microbends,” Applied Optics, Vol. 14, No. 4, 1975, pp. 2400-2405. doi:10.1364/AO.14.002400
- R. Olshansky and S. M. Oaks, “Differential Mode Attenuation Measurements in Graded-Index Fibers,” Applied Optics, Vol. 17, No. 11, 1978, pp. 1830-1835. doi:10.1364/AO.17.001830
- R. Olshansky, “Mode Coupling Effects in Graded-Index Optical Fibers,” Applied Optics, Vol. 14, No. 4, 1975, pp. 935-945. doi:10.1364/AO.14.000935