Journal of Electromagnetic Analysis and Applications
Vol.4 No.9(2012), Article ID:22474,4 pages DOI:10.4236/jemaa.2012.49048
An Over-Moded TEM Cell System for in Vivo Exposure at 2.45 GHz
![]()
1Italian Inter-University Centre of Electromagnetic Fields and Bio-Systems, Department of Information Engineering, Electronic and Telecommunication, University of Rome “La Sapienza”, Rome, Italy; 2Italian Inter-University Centre of Electromagnetic Fields and Bio-Systems, Italian National Agency for New Technologies, Energy, and Sustainable Economic Development, Rome, Italy.
Email: *paffi@die.uniroma1.it
Received July 3rd, 2012; revised August 1st, 2012; accepted August 10th, 2012
Keywords: In Vivo Experiments; Exposure System; TEM Cell; WiFi Signal
ABSTRACT
A TEM cell designed to operate at 900 MHz for exposing small-restrained animals (e.g. mice) has been theoretically, numerically and experimentally characterized at 2.45 GHz, which is the central frequency of the WiFi protocol. This study aims at evaluating the influence of higher order modes on the field homogeneity. The results demonstrate the superposition of a tolerable standing wave, due to reflections at the cell terminations, and a slight beat wave due to the interference between different modes. Nevertheless, the final outcome is that the system can still be efficiently used to expose small animals in specific WiFi channels, provided they are properly placed in correspondence to the maxima of the electric field along the guide length.
1. Introduction
The long standing experience of the studies on the biological effects of mobile phone radiations have led to unanimous agreement that investigations on animal models (in vivo) are among the most effective methods for detecting possible health impairments due to microwave electromagnetic (EM) exposure.
Indeed, in vivo experiments have allowed to gain insight into complex biological pathways related to carcinogenesis, genotoxicity, immunological responses or nervous system degenerations [1-3] which are the most studied targets. With the motivation of rigorous risk assessment, the role of the exposure system development has become a crucial issue, leading to the realization of different in vivo setups [4,5]. A very attractive solution to attain an exposure to a uniform plane wave, mimicking the far field condition, is the use of TEM cells [6], which enable controlled exposure, present great versatility, ease of use, quite good efficiency with confined EM field, and low cost. However, the limits of the TEM cells are the necessity of maintaining the cross section of the system small enough to avoid the onset of higher order modes and, as a consequence, the difficulty in exposing a large number of animals, especially as frequency increases. In the past, to overcome one of these limitations, a long TEM cell was designed and used for exposure of up to 12 mice at 900 MHz [7].
Nowadays, due to the huge development of new communication standards (e.g. WiFi, WiMAX, [8]) operating at frequencies from 2 GHz up to even 5 GHz, novel exposure setups are necessary to perform in vivo investigations. However, choosing an EM structure at such frequencies is not an easy task: radiating systems present very poor efficiency and field homogeneity; resonant structures, as Ferris wheels [9], are not suitable because of their narrow frequency band with respect to the wide band required by the new communication protocols. Moreover, they should require a complete new design (plate and rod dimensions) for their use at, say, 2.45 GHz (considering the single central frequency of the WiFi standard [8]), with significant costs. Different solutions, as the use of reverberation chambers, may be taken into account; yet even such choice would be highly expensive and would present an elevated uncertainty of the dose delivered to the animals [10].
Therefore, despite some intrinsic limitations, it seems possible to consider TEM cells as candidates for in vivo exposure, even in the frequency range between 2 and 5 GHz, at least trying to overcome some of their major limits. In particular, if one focuses on the 2.45 GHz frequency, 6 cm is the maximum length for the transversal dimension guaranteeing propagation of the only fundamental mode. This is too small for animal (e.g. mouse) accommodation: hence using an existing TEM cell setup in an over-moded configuration becomes extremely attractive and yet challenging [11,12].
So far, over-moded TEM cells have been scarcely studied in literature in spite of being interesting for EM compatibility applications (radiators calibration, compliance tests); actually only few theoretical analyses have been carried out [13-15], which do not consider the cell used as an exposure apparatus for in vivo experiments.
The aim of this work is to rigorously analyze how the propagation of the higher order modes can influence the field distribution at 2.45 GHz inside the TEM cell proposed in [7], firstly designed to operate at 900 MHz. This is to accurately characterize how such a system can be used for in vivo experiments at the WiFi frequencies (i.e. 2402 - 2483 MHz [8]). The analysis is performed on the empty cell by comparing theoretical, numerical and experimental results. As far it concerns the EM field measurement inside the TEM cell, a well-established procedure is not present in literature. Hence, the second aim of this paper is to set up and test a reliable measurement procedure, with minimum perturbation of the field values inside the cell.
The system characterization must be carried out with and without the exposed animals, which is the fundamental prerequisite before affording any reliable EM dose-response relationship study within the WiFi band. Therefore, as a final step, the influence of small animals on the EM field distribution within the TEM cell in its actual operating conditions is numerically assessed.
The paper is organized as follows: in Section 2, after a basic description of the system, methods used for theoretical, numerical and experimental characterization are described. In Section 3.1 a minimally perturbing EM measurement procedure for TEM cell characterization is provided, while in Sections 3.2 and 3.3 theoretical analysis for cut-off and resonance frequencies evaluation, as well as numerical and experimental system characterization at 2.45 GHz is given. Finally, in Sections 4 and 5, discussion and conclusions are drawn.
2. Materials and Methods
2.1. System Description
The TEM cell geometry is shown in Figure 1 and the main dimensions are reported in Table 1. The cell was built in aluminium with walls and septum 2 and 1 mm thick, respectively [7]. Tapered walls were designed to match the cell with the terminal 50 W coaxial lines. The transition between the septum and the coaxial feed line was performed driving the septum into a metallic cone

Figure 1. Longitudinal section (a) and transversal section (b) of the TEM cell (not in scale); (c) Homogeneous models of a newborn and a young mouse (not in scale). The employed Cartesian reference system is reported.
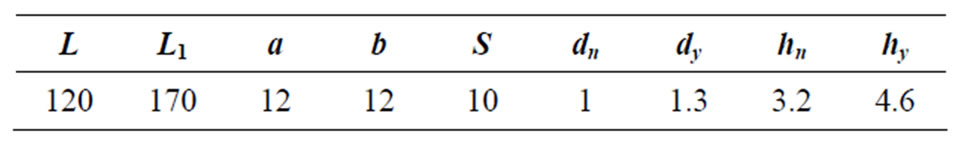
Table 1. Main dimensions (in cm) of the TEM cell and the homogeneous mouse models.
towards the N-termination adapter. The cell has removable walls: one of them is gridded (dimension of the grid 5 mm) to assure the air flow during the in vivo experiments, another one (lateral) is provided with a longitudinal slot (1.3 cm width and 115 cm long), to insert the probes for the electric field (E field) and magnetic field (H field) measurements (Figure 1(a)). The slot is positioned 3 cm away from the longitudinal symmetry plane of the wall, so that it can be used to measure the fields in points placed 3 cm over or under the TEM cell septum (Figure 1(a)).
2.2. Theoretical Analysis for the Evaluation of Cut-Off and Resonance Frequencies
To calculate cut-off frequencies of the higher order modes existent within the considered TEM cell at the WiFi frequencies (2402 - 2483 MHz [8]), a software procedure, using MatlabTM’s routines, was implemented, according to a recent work of Chen [15]. The used solution exploits the complete formulation firstly reported in [13] for a specific b/a ratio and is successively confirmed by simplified approximations derived in [14] also for other b/a values. At the same time, the theoretical procedure proposed in [16] for symmetrical square TEM cells was used to calculate (using the MatlabTM environment) the resonance frequencies corresponding to each higher order mode propagating within the TEM cell. Resonances are always unwanted when using the TEM cell as exposure system since they perturb the desired homogeneity of the field distribution. However in the frequency windows between resonances the TEM cell usage is still valid maintaining its classical propagating behaviour [17]. Hence, predicting these resonances and the associated windows is fundamental for the TEM cell application as an exposure apparatus in the WiFi band.
2.3. Numerical Simulations
The TEM cell was modelled, using CST Microwave Studio 2012, in a realistic way, with walls and septum in aluminium with conductivity (s) equal to 5 ´ 107 S/m. The tapered transitions were accurately modelled as the actual ones. Two waveguide ports terminated the structure, one for the feeding signal (1 W of input power) and the other used as a 50 W-matched load. Mesh properties were set to 30 lines per wavelength (total number of cells: 11 ´ 106).
At first, the system was numerically solved at the frequency of 500 MHz, where only the fundamental TEM mode propagates in order to validate the numerical model itself and the employed EM field measurement procedures. Then, simulations at 2.45 GHz were performed in order to get the EM field distributions in the guide. E and H field distributions were considered on cut planes and along longitudinal and transversal lines to evaluate the field homogeneity inside the exposure system. Moreover, in order to quantify the single contribution of each excited mode on the field distributions in the cell, a structure corresponding to the central part of the system (length L), without the transitions, was solved by exciting all the permitted modes. In this way, it was also possible to isolate the effect of the modes from that of the mismatch with the feeding coaxial cable.
To further assess the variability of the EM distribution in the real TEM cell configuration, eight small dielectric phantoms, mimicking the mice presence and filled with an equivalent biological medium (relative permittivity of 41.08 and conductivity of 1.57 (S/m) at 2.45 GHz) with geometry and dimensions reported in Figure 1(c) and Table 1, were inserted into the system. Two sets of dimensions were considered for the phantoms referring to newborns and young animals, respectively (Figure 1(c)) [11]. The phantoms were positioned in the homogeneity region of the E field assessed by the simulations of the empty structure. Specifically two groups of four mice, one for each zone of maximum E field, were positioned inside the TEM cell. For each group two mice were placed under the cell septum and two mice over this structure. In this case, a mesh size of 25 lines per wavelength was used.
2.4. Electric and Magnetic Field Measurements within the TEM Cell
E and H field measurements were performed in the cell by inserting the E and H field probes through the slot previously described (Section 2.1).
Firstly, measurements at 500 MHz were carried out, as a reference condition when only the TEM mode is excited, then the system behaviour was characterized at 2.45 GHz.
The EM signals were generated by a Sweep Oscillator (HP 8350B) connected to an RF Plug-in (HP 83525A) and successively amplified using a HUGES mod. 8020- H01F000 2 - 4 GHz at 2.45 GHz and a RF Power Labs 200 - 500 MHz at 500 MHz. The input power was driven towards one termination of the TEM cell by a bidirectional coupler (NARDA 3022). The other termination was closed on a 50 W load. Isotropic miniaturized probes were used for E (ET3DV5R, SPEAG Schmid & Partner) and H field (H3DV6, SPEAG Schmid & Partner) measurements. The uncertainty of the E and H field probes was estimated to be 13.2% and 6.8% respectively with a cover factor k = 2. The probes were connected to a digital voltmeter (HP 3457A) for the voltage acquisitions. Input and reflected powers were continuously monitored using a power meter (Agilent E4419B). An accurate probe positioning inside the cell was achieved by means of a 3D scanning system aligned with the TEM cell. Several measurements were performed, with step of 1 cm, along different longitudinal and transversal lines.
3. Results
3.1. Setup and Validation of the Electric and Magnetic Field Measurement Procedure
In order to evaluate the best measurement conditions in terms of probe positioning and orientation with respect to the field direction, two different configurations were considered at 500 MHz: the slot in the lateral wall, with the probe parallel to the septum and orthogonal to the E field, and the slot in the top wall, more similar to the standard configuration used for the slotted line [18], with the probe orthogonal to the septum but parallel to the E field. This latter configuration can be achieved by simply rotating by 90 degrees the septum with respect to the outer structure of the cell. In both cases, the slot is minimally radiating [18] since the surface currents on the walls are substantially parallel to the axial direction of the TEM cell operating in the fundamental mode. Measurements along the same longitudinal line were performed in the two configurations.
Results in Figure 2 show that, when the probe is parallel to the E field (black solid line) there is a coupling with the sensor resulting in an offset of the measured quantities, with a mean value of 140 V/m versus 120 V/m in the other case (black dashed line). Therefore, the configuration with the sensor perpendicular to the E field must be used in the field measurements within the TEM
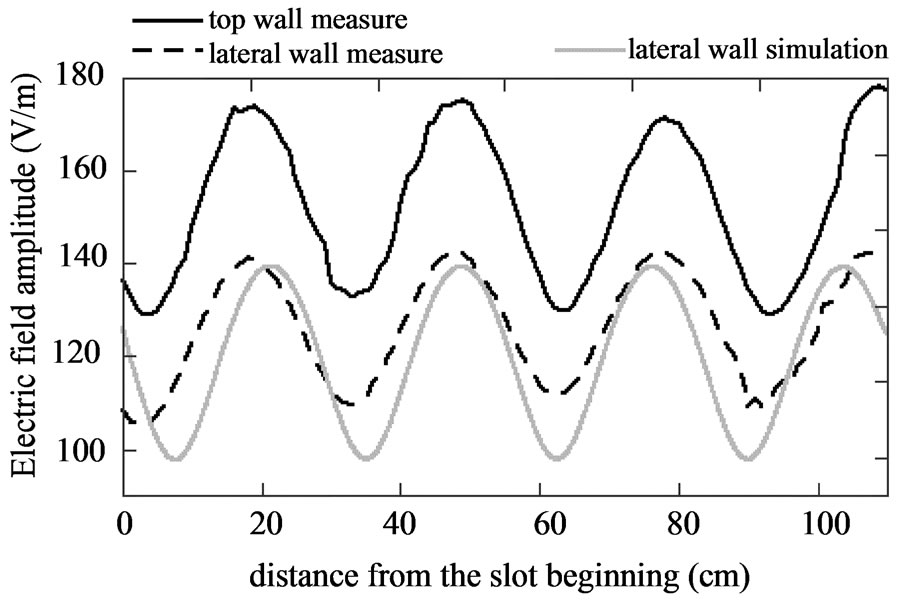
Figure 2. E field measured (black solid and dashed lines) and simulated (gray solid line) along a longitudinal line inside the TEM cell at 500 MHz, with the sensor inserted through a slot on the top wall or on the lateral wall.
cell. The validity of this latter configuration is further confirmed by the good agreement found between the measured values and the numerical E field data along the same longitudinal line as shown in Figure 2 (gray solid line).
The slight variations between measurement and simulation can be mainly ascribed to the limited accuracy in the probe positioning during the measurements procedures as well as to simplifications in EM simulations, which did not take into account the field probe presence within the EM guide.
3.2. Theoretical Evaluation of Cut-Off and Resonance Frequencies
Theoretical cut-off frequencies calculations (Section 2.2) provide three TE modes propagating within the cell: the TE01, TE10, and the TE11 with values reported in Table 2. Such values are in good agreement with those graphically determined as in [13], with maximum variations of nearly 2%. The resonance frequencies correspondent to each of these higher order modes are infinite; hence we calculated and reported in Table 2 only those appearing within the WiFi band (2403 - 2483 MHz) [17].
In particular, as evident from Table 2, the central WiFi frequency of 2.45 GHz is between the TE01 and the TE11 resonance frequencies (10 MHz apart from both). Therefore the numerical and experimental characterization of the TEM cell can be well performed at this frequency.
3.3. Numerical and Experimental TEM Cell Characterization at 2.45 GHz
3.3.1. Results on Transversal TEM Cell Planes
It is known from theory [14] that the TE10 mode tends to destroy the E field symmetry with respect to the septum whereas the TE01 affects the symmetry between left and right parts of the structure.
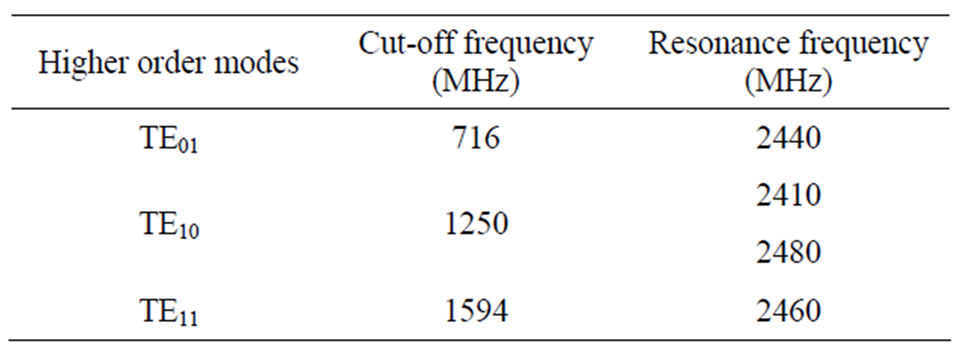
Table 2. TEM cell cut-off frequencies for the three higher order modes propagating in the WiFi band (2403 - 2483 MHz), with the correspondent resonance frequencies in the same band.
The TE11 does not significantly perturb the E field distribution on a transversal section.
In Figure 3(a), the simulated map of  is shown on a transversal section placed at the centre of the guide (z = 60 cm) outlining a maintenance of the field symmetry with respect to the cell septum, thus suggesting a higher contribution of the TE11 mode with respect to the others. According to the measurements procedure decided in the Section 3.1, the measurements at 2.45 GHz within the cell were carried out with the sensor laterally inserted spanning only one half of the system, along the dotted lines shown in Figure 3(a); this is to reduce the field perturbation due to a deeper probe insertion through the lateral slot. This configuration also permits to scan the fields along transversal lines. Comparison between the measured values, over and under the septum, is shown in Figure 3(b). Differences are always below 20%, confirming the substantial field symmetry. A good accordance with the numerical field values is also achieved (see Figures 3(a) and (b)).
Moreover, the  field distribution due to the only higher order modes was isolated and calculated; the correspondent percentage of the total
  field has been reported in Figure 4(a) for the central section of the guide. Low differences (always less than 20%) due to the presence of the higher order modes are visible within the exposure zone (Figure 4(a)), which corresponds to the two symmetrical regions immediately under and over the TEM cell septum. Therefore the triggering of the higher order modes definitely does not significantly perturb the transversal E field symmetry which can be explained by a small contribution of the TE01 and TE10 modes at 2.45 GHz along the different transversal TEM cell planes.
Analogue results were further obtained for the  field on the same transversal section (see Figure 4(b)) with maximum contribution by the higher order modes of nearly 10%. In addition, variations in
  field values between measured and simulated data were estimated around 10%.
3.3.2. Results on Longitudinal TEM Cell Planes
The  and
and  field distributions along the TEM cell
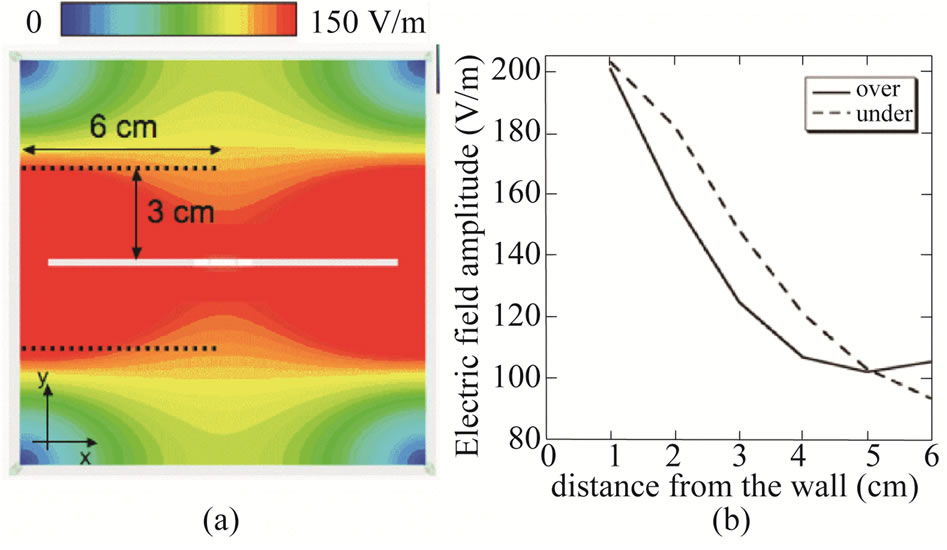
Figure 3. (a) Simulated E field distribution on a transversal plane at z = 60 cm; (b) Measured E field values along two segments 3 cm over and under the septum. Values are to be compared with the E field behaviour along the dotted segments highlighted in panel (a). Input power of 1 W at 2.45 GHz.
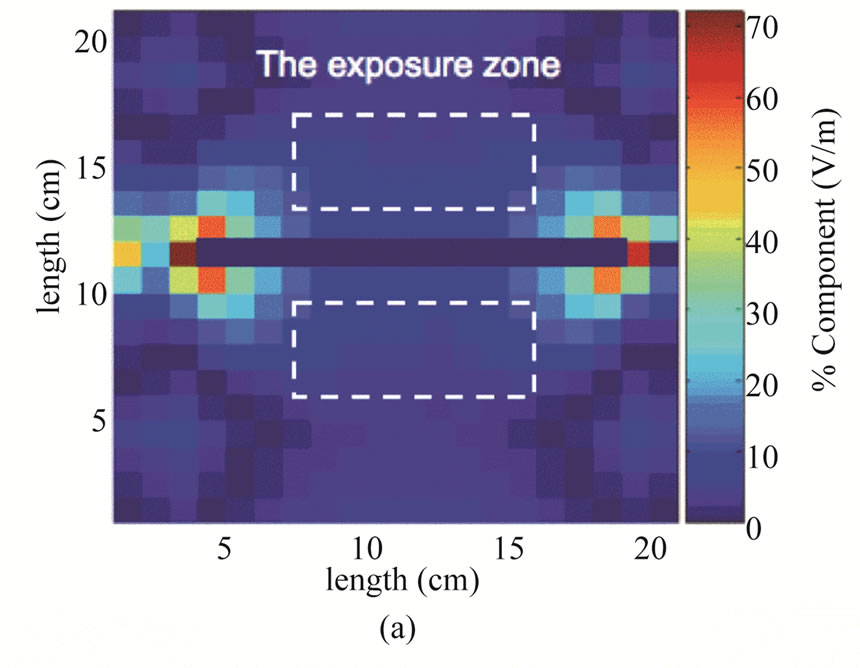

Figure 4. Percentage of contributions by the E (a) and H (b) fields due only to the higher order modes at the central transversal section (z = 60 cm) of the guide.
were also calculated and measured. Figure 5(a) shows the simulated E field amplitude on a longitudinal cut plane; Figure 5(b) shows a comparison between measured and simulated values over the septum, along the dotted line highlighted in Figure 5(a). The mean difference between measurements and simulations is about
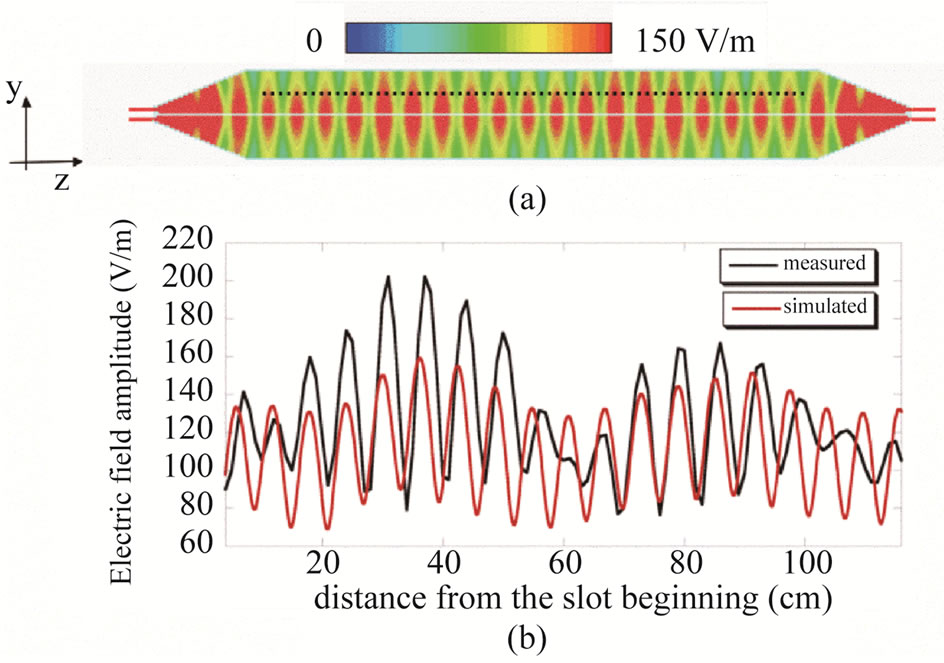
Figure 5. (a) Simulated E field distribution on a longitudinal plane through the centre of the structure; (b) Measured (black) and simulated (red) E field values along the dotted line at y = 3 cm highlighted in panel (a). Input power of 1 W at 2.45 GHz.
10%, but measures show attenuated values between the feeding and the load, probably due to losses related to the slot that are not accounted for by simulations. However, both measurements and simulations indicate a standing wave (max measured VSWR = 2.5) with a wavelength of 6.12 cm, equal to l/2 at 2.45 GHz, due to the impedance mismatch between the feeding cable and the structure. This is mainly due to the fact that the tapered transitions were designed at the operating frequency of 900 MHz. Moreover, a comparable superposed amplitude modulation is present, which can be attributed to a sort of beat wave arising from the interference of modes travelling in the guide with different bz. This effect is confirmed by theoretical calculations and by the simulated modal analysis of the structure without transitions. Values of propagation constant and wave impedance of Table 3 suggest that such a “beat wave” is mainly due to the combination of TEM and TE11 modes. Similar results were achieved for the  field, as noted from the modulation of the field distribution reported in Figure 6(a). Moreover, in order to quantify the effect of the TE modes with respect to the TEM one, the z component of the H field was also numerically calculated. It is mostly concentrated in the tapered transitions and is about four orders of magnitude below |H| as observable comparing the field distributions reported in Figures 6(a) and (b) for the two cases respectively.
3.3.3. Simulating the Mice Presence inside the TEM Cell
Finally, in Figures 7 (a) and (b), the simulated  field distributions considering the mice presence (new born and young models respectively) are reported on a longitudinal plane across the centre of the mouse phantoms at 2 cm (along the x axis) from the centre of the guide.
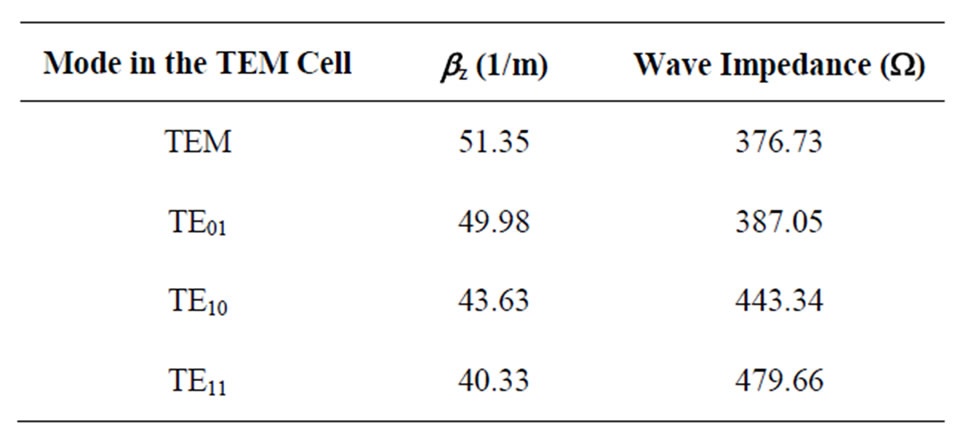
Table 3. Propagation constant and wave impedance of the modes in the TEM cell, calculated through numerical simulations.
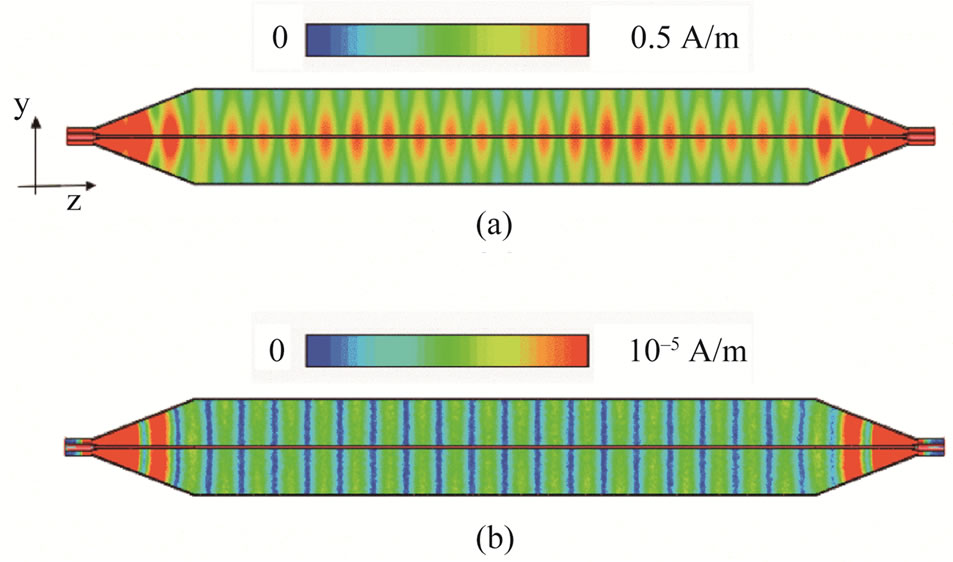
Figure 6. (a) Simulated modulus of the H field distribution on a longitudinal plane passing through the centre of the structure; (b) Simulated z component of the H field along a longitudinal plane passing trough the centre of the structure.
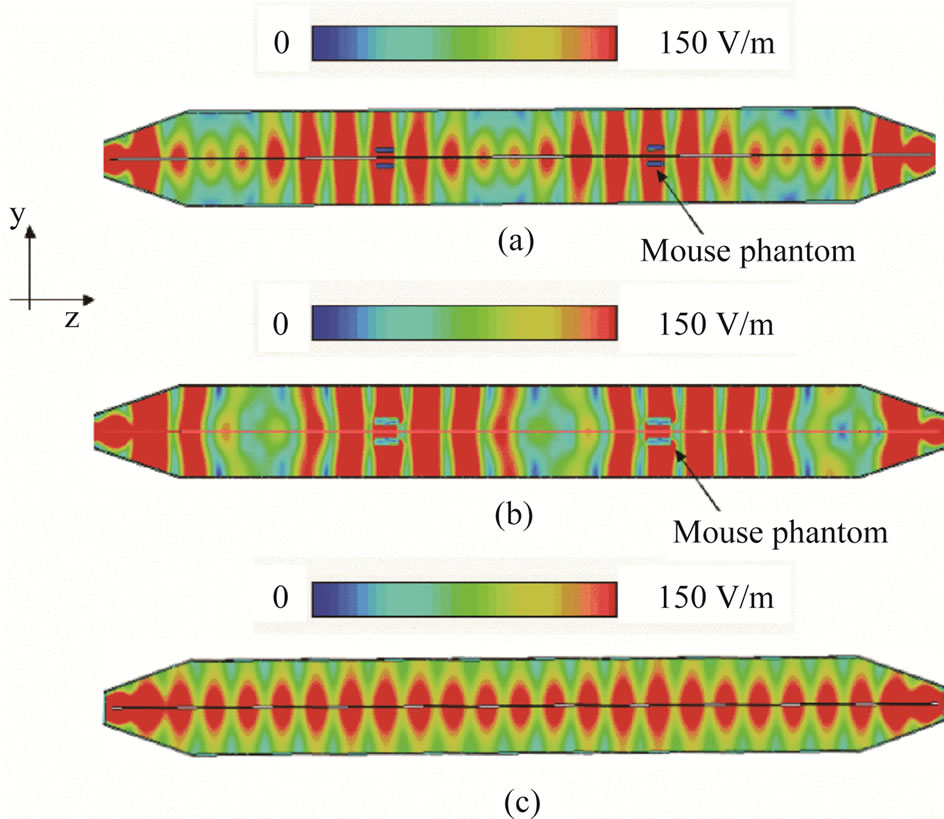
Figure 7. Simulated |E| field distribution on a longitudinal plane passing through the centre of the mouse phantoms at 2 cm from the centre of the guide. Eight newborn (a) or young (b) mice were positioned in the homogeneity regions of the E field estimated on the basis of the empty structure (c) simulations. Specifically two groups of four mice, one for each zone of maximum E field, were positioned inside the TEM cell. For each group two mice were placed under the cell septum and two mice over this structure.
Comparison with the  field distribution on the same planes of the empty structure is also reported in the panel (c) of the same figure. As noticeable, the presence of the newborn mouse phantoms (Figure 7(a)) slightly alters the
  field distribution around the maximum field zones as outlined comparing the field distribution of the empty configuration in proximity of the field maxima (Figure 7(c)). Only, a wider variability of the distribution of the
  field around the maximum values can be detected for the bigger phantoms (comparing Figure 7(b) and (c)). Interestingly, in both situations, the phantom presence determines an enhancement of the field homogeneity region in their proximity with further increase in the
  field values when the young mice model are considered. Therefore, from this analysis, it emerges that there aren’t contraindications to the insertion of the mice within the cell provided that a well-controlled positioning is achieved. Hence, we can substantially confirm the possibility of getting controlled exposures even in an over-moded TEM cell configuration when an optimized sample placement, in correspondence to the maximum values of the
  field values in the empty structure, is employed.
4. Discussion
Aim of this work was to evaluate the influence on the field distributions of the higher order modes propagating in an exposure system based on a TEM cell (design frequency 900 MHz), in order to assess its suitable use at the frequency of 2.45 GHz and in the whole WiFi band. As a first step for the full system characterization, a reliable procedure for the E and H fields’ measurement was developed. This procedure consisted of inserting the probe perpendicular to the field lines, since when the probe is parallel to the field, a strong coupling with the measurement device is produced with an overestimation of about 20% on the average field values along the cell. Theoretical and numerical calculations predicted the presence of three TE modes, besides the fundamental one, and the correspondent resonance frequencies were carefully estimated using Matlabtm routines in accordance with literature formulations [16]. On the basis of such analysis, it results that the current TEM cell [7] can be fed with a CW signal in the WiFi range, provided the frequency is at least 10 MHz apart from resonances. However, the cell can be also used with the WiFi signal without incurring in unwanted resonances for the channels 3 to 4 (2411 - 2438 MHz). Moreover, the higher order modes do not significantly affect the  and
and  field distributions on transversal sections of the guide, as shown by numerical and experimental results at 2.45 GHz. On the contrary, looking at the
  and
and  fields along a longitudinal section, one can see the superposition of a standing wave, attributable to the mismatch with the feeding and the load, and a slower amplitude modulation caused by the modes interference. This field configuration has to be taken into account when placing the animals inside for the experiments. Thus, despite the presence of the higher order modes, experiments on small animals as newborn or young mice (up to 5 g of weight and 5 cm of length), can still be carried out with the proposed TEM cell if the samples are correctly positioned within the structure. In order to have the highest absorbed dose, with the best homogeneity, no more than two groups of four animals (two under and two over the septum) can be placed, along z, in correspondence to the E field maxima of the beat wave as further confirmed by the numerical analysis performed on the TEM cell loaded with mouse phantoms of different sizes. In this way, the system can be efficiently used also at 2.45 GHz, overcoming the limitation imposed by the reduced dimensions (6 cm side) of a TEM cell specially designed at such a frequency, which does not permit in vivo exposure.
5. Conclusion
The outcomes of this study confirm the TEM cell as a good candidate for obtaining well-controlled and quite high efficient exposures on a considerable number of mice in an over-moded operational configuration. The efficiency (of the order of 1 (W/kg)/W for the lowest case of newborn mice [11]) is comparable to the ones reported for resonant Ferris wheel structures (0.9 (W/kg)/W) [9], while it is well above the values reported for reverberation chambers (between 0.02 and 0.5 (W/kg)/W) [10], [19]. In a future perspective, these results also enable the design of new systems to be employed even at higher frequencies (e.g. 5 GHz) due to the possibility of using less restrictive dimensions for the transversal guide sections, which is the fundamental requirement for animals positioning.
REFERENCES
- J. Juutilainen, A. Hoyto, T. Kumlin and J. Naarala, “Review of Possibile Modulated-Dependent Biological Effects of RF Fields,” Bioelectromagnetics, Vol. 32, No. 7, 2011, pp. 511-534. doi:10.1002/bem.20652
- L. Verschaeve, J. Juutilainen, I. Lagroye, J. Miyakoshi, R. Saunders, R. de Seze, T. Tendford, E. van Rongen, B. Veyret and Z. Xu, “In Vitro and in Vivo Genotoxicity of Radiofrequency Fields,” Mutagenesis Research, Vol. 705, No. 3, 2010, pp. 252-268.
- N. Desai, K. K. Kesari and A. Agarwal, “Pathophysiology of Cell Phone Radiation: Oxidative Stress and Carcinogenesis with Focus on Male Reproductive System,” Reproductive Biology and Endocrinology, Vol. 7, 2009, p. 114.
- A. Paffi, F. Apollonio, G. A. Lovisolo, C. Marino and M. Liberti, “Exposure Systems for Bioelectromagnetic Investigations in the Radiofrequency Range: Classification and Emerging Trends,” Proceedings of the 5th European Conference on Antennas and Propagation, Rome, 2011, pp. 3159-3163.
- T. Samaras, N. Kuster and S. Negovetic, “Scientific Report: Workshop on EMF Health Risk Research Lessons Learned and Recommendation for the Future,” Centro Stefano Franscini, Monte Verità Switzerland, Deliverables D36-D37, EMF-NET Project, 2005. http://web.jrc.ec.europa.eu/emf-net/reports.cfm
- M. L. Crawford, “Generation of Standard EM Field Using TEM Transmission Cells,” IEEE Transactions on Electromagnetic Compatibility, Vol. EMC-16, No. 4, 1974, pp. 189-195. doi:10.1109/TEMC.1974.303364
- L. Ardoino, V. Lopresto, S. Mancini, C. Marino, R. Pinto and G. A. Lovisolo, “A Radio-Frequency System for in Vivo Pilot Experiments Aimed at the Studies on Biological Effects of Electromagnetic Fields,” Physics in Medicine and Biology, Vol. 50, No. 15, 2005, pp. 3643- 3654. doi:10.1088/0031-9155/50/15/011
- Wireless LAN Medium Access Control (MAC) and Physical Layer (PHY) Specification, “Higher-Speed Physical Layer Extension to 54 Mbps,” 2003.
- Q. Balzano, C. Chou, R. Cicchetti, A. Faraone and R. Y. Tay, “An Efficient RF Exposure System with Precise Whole-Body Average SAR Determination for in Vivo Animal Studies at 900 MHz,” IEEE Transactions on Microwave Theory and Techniques, Vol. 48, No. 11, 2000, pp. 2040-2049. doi:10.1109/22.884193
- T. Wu, A. Hadjem, M. Wong, A. Gati, O. Picon and J. Wiart, “Whole-Body New-Born and Young Rats’ Exposure Assessment in a Reverberating Chamber Operating at 2.45 GHz,” Physics in Medicine and Biology, Vol. 55, No. 6, 2010, pp. 1619-1630. doi:10.1088/0031-9155/55/6/006
- R. Pinto, V. Lopresto, P. Galloni, C. Marino, S. Mancini, R. Lodato, C. Pioli and G. A. Lovisolo, “Dosimetry of a SetUp for the Exposure of Newborn Mice to 2.45 GHz WiFi Frequencies,” Radiation Protection Dosimetry, Vol. 140, No. 4, 2010, pp. 326-332. doi:10.1093/rpd/ncq129
- A. Paffi, C. Merla, M. Liberti, F. Fratta, R. Pinto, G. A. Lovisolo and F. Apollonio, “A TEM Cell System for in Vivo Exposure at 2.45 GHz,” Proceedings of the 6th European Conference on Antenna and Propagation, Prague, 26- 30 March 2012, pp. 1099-1101.
- L. Gruner, “Higher-Order Modes in Rectangular Coaxial Waveguides,” IEEE Transactions on Microwave Theory and Techniques, Vol. 15, No. 8, 1967, pp. 483-485. doi:10.1109/TMTT.1967.1126510
- M. T. Ma, M. Kanda, M. L. Crawford and E. B. Larsen, “A Review of Electromagnetic Compatibility/Interference Measurement Methodologies,” Proceedings of IEEE, Vol. 73, No. 3, 1985, pp. 388-411. doi:10.1109/PROC.1985.13164
- Z. Chen, “Examinations of Higher Order Mode Cut-Off Frequencies in Symmetrical TEM Cells,” Proceedings of IEEE International Symposium on Electromagnetic Compatibility, Austin, 17-21 August 2009, pp. 6-11. doi:10.1109/ISEMC.2009.5284659
- C. Groh and J. P. Kaerst, “Analytical Calculation of Resonances in Tapered Double-Port TEM Waveguides,” IEEE Transactions on Electromagnetic Compatibility, Vol. 48, No. 2, 2006, pp. 431-435. doi:10.1109/TEMC.2006.874083
- P. Wilson and M. T. Ma, “Simple Approximate Expressions for Higher Order Mode Cut-Off and Resonant Frequencies in TEM Cells,” IEEE Transactions on Electromagnetic Compatibility, Vol. 28, No. 3, 1986, pp. 125- 130. doi:10.1109/TEMC.1986.4307269
- D. Roddy, “Microwave Technology,” Prentice-Hall, Engle- wood Cliffs, 1986.
- P. F. Biagi, L. Castellana, T. Maggipinto, G. Maggipinto, T. Ligonzo, L. Schiavulli and D. Loiacono, “A Reverberation Chamber to Investigate the Possible Effects on ‘in Vivo’ Exposure of Rats to 1.8 GHz Electromagnetic Fields: A Preliminary Study,” Progress in Electromagnetic Research, Vol. 94, 2009, pp. 133-152. doi:10.2528/PIER09061006
NOTES
*Corresponding author.