International Journal of Communications, Network and System Sciences
Vol.11 No.12(2018), Article ID:89359,21 pages
10.4236/ijcns.2018.1112015
Comparison of Vertical Handover Decision-Based Techniques in Heterogeneous Networks
Adada Edia1, Opeyemi Osanaiye2, Folayo Aina3, Olayinka Ogundile4
1Department of Electrical Engineering, University of Cape Town, Cape Town, South Africa
2Department of Telecommunications Engineering, Federal University of Technology, Minna, Nigeria
3Department of Telecommunications Science, University of Ilorin, Ilorin, Nigeria
4Department of Physics and Telecommunications, Tai Solarin University of Education, Ijebu Ode, Nigeria

Copyright © 2018 by authors and Scientific Research Publishing Inc.
This work is licensed under the Creative Commons Attribution International License (CC BY 4.0).
http://creativecommons.org/licenses/by/4.0/


Received: October 11, 2018; Accepted: December 21, 2018; Published: December 24, 2018
ABSTRACT
Industry leaders are currently setting out standards for 5G networks projected for 2020 or even sooner. Future generation networks will be heterogeneous in nature as no single network type will be capable of optimally meeting all the rapid changes in customer demands. With the advent of multi-homed devices and heterogeneous network (HetNet) solution, great concerns arise in the processes involved for successful handover. Active calls that get dropped or cases of poor quality of service experienced by mobile users can be attributed to the phenomenon of delayed handover (HO) or an outright case of an unsuccessful handover procedure. This work compares multiple criteria handover basis to its traditional single relative signal strength (RSS) base counterpart. It analyses the performance of a fuzzy-based VHO algorithm scheme in a Wi-Fi, WiMAX, UMTS and LTE integrated network using OMNeT++ event simulator. The loose coupling network architecture is adopted and simulation results analysed for the two major categories of handover; the multiple and single criteria. Results obtained show a better overall throughput, better call dropped rate and shorter handover time for the multiple criteria based decision method as compared to the single criteria based technique. This work also highlights current research trends, challenges of seamless handover and initiatives for Next Generation HetNet.
Keywords:
Index Terms-Heterogeneous Network, LTE, Radio Access Technology, RSSI, UMTS, Wi-Fi, WiMAX. Vertical Handover

1. Introduction
There is a consensus in the research community that there is an increase in the number of mobile users. At the end of 2017, the number of phone users was pegged at about 2.32 billion as shown in Figure 1 [1] . In the second quarter of 2011, wireless interoperability for microwave transmission (WiMAX) technology broke the 20 million global subscriber mark which is an evidence of the exponential growth of mobile users [2] . Operators therefore need to increase their network capacity to provide efficient network services to meet this growing demand. This may probably be achieved by upgrading the technological facilities to increase spectral efficiency (5G Internet of Things-IoT), frequency reuse (cell splitting), off-loading data traffic through femtocells or wireless fidelity (Wi-Fi) access points. When integrating different radio access technology (RAT) for improved quality of service, consideration should be given to the mobility of users, and the service employed should allow users the choice of RAT which best suits the required multimedia application (user needs); always best connect (ABC).
In the past, existing mobile devices were not equipped to connect to more than one access network simultaneously. However, in recent times, mobile devices are now equipped to physically connect to multiple data links of same or different RATs. With this development, the seamless transfer of active mobile services from one RAT to another becomes a major source of concern, as handover process will occur frequently and simultaneously. To achieve this, the IEEE802.21 standard created a framework designed to support all the protocols required for the seamless handover process; detecting networks within range and executing the handoff. This paper focuses on the performance of the single criterion and multiple criteria methods of handover in heterogeneous wireless networks. The single criterion parameter that is investigated is the traditional relative signal strength indicator (RSS) while the parameters for the multiple criteria are;

Figure 1. Number of smartphone users in the world (in billions) [1] .
relative signal strength indicator (RSSI), available bandwidth, jitter and cell coverage radius also referred to cell area in this work. We aim at preventing degradation of both real-time services (voice/video) and non-real-time services (SMS, MMS and web services) during mobility. This will ultimately translate to good quality of service (QoS) for multiple and single users. In addition, we also:
1) Present insights into the selection of handover (HO) schemes and HO design parameters,
2) Create an environment that will adequately simulate the HO scenario and show how the OMNeT++ Framework suits the simulation of communication networks.
The main contribution of this work is the description of a comparison between the handover approaches identified as traditional and state-of-the-art in the research community. We present a framework that adequately shows superiority in the provision of seamless handover between the two. The functionalities and roles of components of the framework in optimization is also explained. As developed countries gear towards the implementation and deployment of 5G in 2020, developing countries without 5G infrastructure can benefit from this study in the area of adopting effective handover selection scheme. An effective handover selection scheme greatly optimizes network performance. In addition to the above, this study will further assist studies geared towards establishing handover index for vertical handover evaluations.
The rest of the paper is organized as follows: Section 2 presents the fundamental principles, concepts and techniques of HO. In Section 3, we highlight the system model and design methodology adopted. Furthermore, this section gives an insight into the key parameters for HO from the developmental stage to the conclusion stage. Section 4 introduces Fuzzy inference system, defines the universe of discourse and improves the network selection process. Analysis of the simulation results are presented in Section 5 while Section 6 concludes the paper with suggestion of possible research directions.
2. Fundamental Principles of Handover
Handover criteria are the qualities that are taken into consideration or measured with the aim of indicating if handover is necessary. They include; terminal related (e.g. battery power, location information, velocity etc.), user and service related based algorithms (e.g. preferences of choice of network, cost, service capabilities, QOS requirements, residual bandwidth) [3] [4] , parameter aggregation algorithms based on characteristics such as delay, jitter, BER; mathematical algorithms and network related (i.e. Cell coverage, bandwidth, latency, received signal strength (RSS), carrier to interference ratio (CIR), security level, monetary cost etc.). Criteria selections can be further sub grouped into static and dynamic. Parameters such as cost of individual networks and user profile are seen as static criteria, whereas the MTs velocity and RSS are typically considered dynamic criteria. These decision criteria, together with the RSS decision policies highlighted below, help in the determination of the access network to be chosen and where the HO should occur.
RSS: choosing the new Base Station (BS) if RSSnew > RSSold.
RSS with Threshold T: choosing the new BS if RSSnew > RSSold and RSSold < T.
RSS with Hysteresis H: choosing the new BS if RSSnew > RSSold + H.
RSS, Hysteresis and Threshold: choosing the new BS if RSSnew > RSSold + H and RSSold < T.
In HetNet, other parameters such as offered services, monetary cost, network conditions and user preferences must be evaluated for vertical handover decision policy. More criteria are needed to allow the terminal capability to decide the appropriate time to perform the handover as well as for user choice and intervention (user preferences among different access technologies) [5] . In the advent of a combination of all these criteria, we expect complexity in the VHO process, due to their dynamicity.
3. System Model
In this section, we define the problem and our approach. The circumscription, knowledge and goal operations are direct result of understanding the problem. We identified the problem of poor QoS and quality of experience (QoE), which we attribute to the type of handover mechanism implemented in HetNets. Design process presents a mental model for presenting and evaluating systems [6] . Figure 2 shows the general design cycle adopted in this paper, which is similar to the popular design research method described in [7] .
We use the Fuzzy based handover selection technique, together with a simple weighing technique which optimizes the selection process. Fuzzy systems are mathematical means of representing vagueness and imprecise information, it is widely used for inference and control problems compared to other algorithms [8] . The weighing technique is necessary due to the factors the algorithm needs to consider before making a decision to initiate the handover process. We employ

Figure 2. Design cycle [7] .
the rank order centroid (ROC) for the multiple access decision making (MADM) weighing selection because we considered only four handover-based metrics and the ROC is less complex, when compared to other techniques. Fuzzy is an artificial intelligent learning process that mimics human reasoning as closely as possible. It computes based on the “degree of truth” rather than the conventional “true or false” (1 or 0) Boolean logic. The Fuzzy tool box in MATLAB is used to generate the rule base of the linguistic variables defined as Fuzzy sets. The input parameters are fed into the Fuzzifier and a single output is generated by the defuzzfier. This single output value is compared to a pre-set threshold and the handover process is triggered based on the outcome of the comparison. Some requirements need to be met for our simulation to be credible. Firstly, the simulator must be able to handle wired and wireless networks. Furthermore, it must be able to implement multi-modal devices, and accommodate the accepted standards. The key IEEE802.21 handover services include media independent service, media independent command service and media independent information service. IEEE802.21 standard defines how operations, such as network discovery and selection, should work and how information regarding handover is shared to the network selection entity. The Wi-Fi, UMTS, WiMAX and LTE network topology is designed with OMNeT++ in the loose coupling mechanism. OMNeT++ simulation together with MiXiM framework is used for the implementation and simulation of this work because it accounts for the basic requirements mentioned above and it is also user friendly. The development stage starts with the implementation of the Fuzzy logic inference system (FIS), integration of the handover codes generated from the Fuzzy tool box in MATLAB, developing the codes for the HetNet using the inbuilt framework of the simulator and defining all other parameters and constraints experienced in real case scenarios such as obstacles, interference and fading.
Evaluation in Engineering often means a repetitive or iterative number of repetition while adjusting various input variables and holding certain variables constant. In our case, we write codes for the simulation of the two basic handover types as defined in this work (multiple criteria and single criterion), and then execute the simulation run for both handover types for a fixed duration. The event logs are recorded for all the simulation trials to verify the output results and then our conclusions/solutions are based on all the scalar and vector results obtained.
4. Fuzzy Inference System
There are various techniques developed for the process of network selection; however, there are three main issues of great consideration which are fundamental to the various techniques. First is the issue of identifying and selecting the most appropriate parameters. Secondly, the identification of an algorithm which can adequately exploit these identified parameters. Lastly, the application of a weighting technique to weigh each criterion. To achieve this, four main selection techniques widely used in literature are; Utility Theory, Game Theory, Fuzzy logic and Neural Networks, MADM.
Radio signals can be said to be described in a fuzzy manner, thus a handoff algorithm which is capable of making decisions when there is imprecise and incomplete information is most appropriate. The Fuzzy inference system (FIS) is a computing framework based on the concepts of fuzzy set theory, Fuzzy IF-THEN rules and Fuzzy reasoning. The expression below is a generalization to classical set, where defines the membership function of the Fuzzy set A.
(1)
In set theory operations, intersection and union represent “and” and “or” respectively. Similarly, the Fuzzy logic conjunction and disjunction represent “and” and “or” respectively. Various articles have different choices for these operations, however, we will adopt the minimum (min) and maximum (max) to represent the operations. Also, just as in set theory, the intersection of two Fuzzy sets A and B can be expressed as another Fuzzy set C = A AND B with membership functions common to the Fuzzy sets A and B.
(2)
More so, the union of two Fuzzy sets A and B is expressed as a third Fuzzy set C = A OR B.
(3)
The FIS is a system which computes and arrives at a conclusion based on the facts fed into it. We are focusing on ensuring QoS in order to guarantee QoE by the user. To guarantee QoS, the network operators control certain factors such as available bandwidth, delay, jitter etc. During handover, we may expect packet loss, latency and other drawbacks, thus we are compelled to consider the degree of seamlessness of the handover process. It is obvious that assigning an accurate and definite number to this degree of seamlessness in the handover process is not practical. This also is a reason why the Fuzzy based approach is adopted. The selected parameters are useful from a network service and technical point of view. The four (4) input parameters fed into the system operating a Fuzzy based decision handover mechanism are; available bandwidth, RSSI, jitter and cell radius (ranked items). The Mamdani FIS is used because it is known to be suited to human input; it is intuitive and widely accepted. Making decisions entail choosing the best possible alternatives from multiple bases on which the alternatives are judged. It simply means selecting the best possible course of action or option. The MADM process is known to have three fundamental steps;
1) structuring the problem
2) acquiring the preference information
3) aggregation of the acquired preferences.
This aggregation provides a unified value that spans across multiple attributes.
Structuring the problem (decision making) requires identification of the attributes which characterizes the decision-making problem. A structure is therefore determined to be either hierarchical or flat. Next, the multiple attributes (alternatives) are also evaluated with respect to the problem structuring phase, thus yielding attribute values that are subjective or factual judgments. These attribute values, when properly encoded for the purpose of decision analysis, are called preferential data. Lastly, the attribute values are aggregated using some weighing methods or a combination of weighing methods. The Fuzzy based decision algorithm needs to be able to make a selection from a number of candidate networks, in our case LTE ( ), UMTS ( ), Wi-Fi ( ) and WiMAX ( ). Take for instance a mobile device connected to Wi-Fi cell 1 denoted as ( ) which needs to make a choice between five networks Wi-Fi ( ), UMTS ( ), Wi-Fi ( ), WiMAX ( ) and LTE( ) where Wi-Fi ( ) is a Wi-Fi cell outside the domain of Wi-Fi ( ) and the rest three candidate network options are cells with different access technologies as denoted respectively. We also denote the handover criteria jitter, cell radius, available bandwidth and RSSI mentioned earlier by and respectively. It will be reasonable to presume that a handover from to may not necessarily be seamless due to the fact that they are not in the same domain, the decision scenario can be represented in a decision matrix (D) form with the corresponding values of all network parameters as shown in Equation (4). The values have been arrived at, with respect to the implementation of the network topology on the event simulator, playground area, and the respective coverage radii of network technologies etc.
(4)
From (4), it is seen that networks and have high jitter and smaller cell radius compared to and networks. We therefore have to introduce a method through which the system gets to select the best alternative network ( and ) to handover the mobile device in a seamless manner for service continuity. The preference for the handover will be modelled as the weights assigned to the parameters, and the rank order centroid (ROC) is used. This method simply assigns weights to a number of parameters ranked in order of their importance. These ranks are inputs which are converted to weights for each of the parameters required for handover. The conversion for the ranks is performed based on Equation (5).
(5)
where M is defined as the number of network parameters considered for handover, is the weight attributed to the ith parameter.
Take for instance the four network parameters mentioned above, after assigning an order of importance, the item ranked first will be weighted as , the second parameter in the ordered list of importance will weigh , the third parameter will weigh
and the last parameter will have its weight as .
We choose the ROC weighing method because it is not as cumbersome as Analytic Hierarchy Process (AHP) and Technique for Order of Preference by Similarity to Ideal Solutions (TOPSIS). Also, since the number of parameters are few, ROC or simple additive weighting (SAW) is probably the most suitable weight attribution method to employ. The crisp input performance matrices are fed to the FIS via the fuzzifier which transforms these crisp inputs into degrees to match some defined linguistic values. The Fuzzy engine operates and generate outputs based on the Fuzzy IF-THEN rules. The output from this Fuzzy engine is fed into the defuzzifier before transforming this inference result into a singular crisp output. In the case where a MN connected to the UMTS network detects a new network, say Wi-Fi, the Mamdani FIS will calculate the handoff factor based on the input parameters been fed into the fuzzifier. The Mamdani FIS has n-inputs but performs operations on these inputs to produce a single output. This single output (handover factor) from the defuzzifier is then used to determine if handover is required, as it is compared to a pre-set threshold of 0.85 (that is if handoff factor from FIS > 0.85 initiate handoff).
Each input parameter fed into the FIS will be attributed to one of the three defined Fuzzy sets: {Strong (S), Medium (M) and Weak (W)}. For example, the performance metrics RSS set value will consist of the linguistic terms S, M and W. Each of these sets is then mapped to a corresponding Gaussian membership function. Traditionally, the RSSI is usually expressed in decibel with a given range between 0 to −120 dB with 0 been the strongest. RSSI levels less than −80 dB may not be useable depending on the noise level [8] . This has guided our selection of the RSSI universe of discourse. Wi-Fi signal strength is usually expressed as quality in percentage or an RSSI value in decibel. An appropriate correlation between the percentiles and relative signal strength can be described as;
dB ≥ −50 dB = 100% quality or dB ≤ −100 dB = 0% quality (6)
In this paper, we define the universe of discourse for parameter 1, the RSSI is −78 dBm to −66 dBm with the maximum RSS as −66 dBm. This RSSI range describes the relation between received power and transmitted power with respect to the distance between the nodes.
(7)
where is the received power, is transmitted power, d is distance between the nodes and n is the transmission factor which depends on the propagation environment. Ten times the logarithm of both sides yields;
(8)
The transmitted power expression is converted to dBm and written as;
(9)
The value of A and n determine the relationship between the strength of received signals and distance of transmission. Based on this underlying principle and the playground area of the internetwork, we arrived at the RSSI range. Research generally agrees that acceptable signal strengths −30 dBm is the maximum achievable signal strength and is not typical in the real world. A signal strength of −67 dBm is classified as very good as it is seen to be the minimum signal strength for applications that require timely delivery of data packets and reliability [9] . Signal strength of −70 dBm is also okay for services such as email and web services; −80 dBm and delivery may be unreliable. At 90 dBm, it is known that we are approaching or drowning in the noise floor and functionality is unlikely.
For parameter 2, the available bandwidth has a universe of discourse defined from 0 to 80 kbps. The network jitter has its universe of discourse defined between 0 to 10. Lastly, the cell coverage radius which is used interchangeably with cell network coverage area in this paper has an area between 1 m to 300 m defined as its universe of discourse for both the UMTS and Wi-Fi networks. Table 1 to Table 5 define the membership functions and mappings to corresponding ranges in the universe of discourse as implemented in the simulation.
We thereafter define the five handover factor ranges for the one output handoff factor, as shown in Table 5. The maximum number of Fuzzy rules generated is because we have four input parameters fed into the FIS and three

Table 1. RSSI (dBm).
Table 2. Available Bandwidth. Universe of discourse 0 - 80 kbps.
Table 3. Cell Coverage. Universe of discourse 1 m - 300 m.
Table 4. Jitter. Universe of discourse 0 - 10.
Table 5. Handover Factor
Fuzzy membership sets for each variable. A few of the rules generated include:
If RSSI is weak and Ntw.coverage is weak and Jitter is weak and AvailableBW is weak, then H/O.Factor is lower (1)
If RSSI is weak and Ntw.coverage is medium and jitter is medium and AvailableBW is weak, then H/O.Factor is low (1)
If RSSI is strong and Ntw.coverage is strong and jitter is medium and AvailableBW is strong, then H/O.Factor is higher (1).
Note that all the rules are assigned the same weight 1. Now, considering a mobile node currently serviced by the Wi-Fi access network; as it moves to a region where other access networks are available, the multi-modal device starts receiving pointers about the entire input variables for the network interface (available bandwidth, RSS, coverage area and network jitter). As these crisp input variables are fed into the FIS, its output is compared to the network performance of the current serving access network and then a decision is made on whether handoff is required. The Fuzzy system aggregates the Fuzzy output with the union set operator and the max of the membership function is expressed in the relationship;
(10)
Various defuzzification methods exist and literature has it that the most common and accurate technique is the centre of area (centroid) defuzzification; a technique developed by Sugeno in 1985 as stated by T. J. Ross.
(11)
from the above equation is the defuzzified output and the aggregated membership function is the desired threshold . The only setback with this technique, as stated in [10] , is the difficulty associated with a case of complex membership function. The overall Fuzzy system designed for this work is represented in a functional block diagram having three main sections; the collection block, processing block and the assignment block as shown in Figure 3. The collection section basically listens and collects data for the attributes, to assess the impact of the network parameters on the network QoS. The processing block comprises of the Fuzzy inference system, the ROC and the network average index (NAI). The data stored from the collection block is processed by the fuzzy inference system while the ROC receives these data to classify the most adequate network in the environment. The mobile device is based on the weights of the parameters.
This weight attribute assigned is with respect to the type of traffic or application running. The known traffic types are the real-time traffic (audio, video) and the non-real-time traffic (MMS, SMS). For the real-time traffic, the Fuzzy system works with the widely accepted and know threshold for transmission of voice traffic (VoIP) which emphasizes that the delay and jitter should be considerably less than 300 ms and 150 ms respectively; while packet loss must be less than 1% and 3% for video and voice, to avoid sound ineligibility to the human ear [11] . This threshold setting, also serves as the basis for the classification of the linguist variables (strong, medium and weak) defined earlier in this work and the outcome generated by the Mamdani triangular membership function. The score of each network is informed by the output of the Fuzzy system (defuzzification) and the output from the ROC from each criterion, bearing in mind the weights are based on the importance of the parameter with respect to the type of traffic. Take for instance, the mobile user has voice and file download applications running; the network preference is modelled as weights for the handover criteria Wv
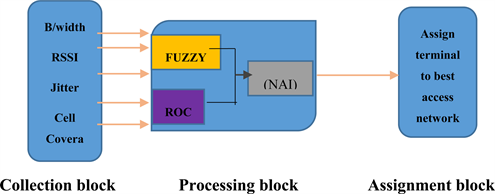
Figure 3. Fuzzy, ROC architecture.
and Wf. The model is in such a way that the summation on each criterion equals the numerical value one. Wv = [weak, medium, strong], Wf = [medium, medium, strong].
5. Simulation Performance and Results
In any communication network system, the commonly transmitted traffic types are video, voice and data. The performance evaluation of these traffic types does not only depend on the traffic, but also on the technologies, the overall structure of the network (wireless or wired) and other factors such as the distance/speed of the user equipment from the base station. OMNeT++ provides different CODEC types; we select the G.711 CODEC scheme which supports pulse code modulation (PCM) and has a compression/decompression delay of 0.02 seconds each. The type of service used for the VoIP call is the interactive voice. We set the start time with an offset of “60” + start time (seconds) so that the establishment of the VoIP call application is repeated until the simulation runtime is completed. In OMNeT++, the packet delay variation (PDV) is arrived at by computing the variance of the packet delay and the end-to-end of the total voice packet delay calculated as
(12)
where and represent network, decoding, decompression and encoding delays respectively. PDV is key in the analysis of any network performance because it affects the user’s perceptual quality. With a relatively high PDV, congestion of packet occurs, therefore resulting in network overhead which can also lead to packet loss. For those communication applications involving digital continuous media (interactive and non-interactive applications), to achieve acceptable quality for animated images and sound, a bound on the delay and jitter is required. As earlier stated, a jitter of less than 150 ms for one way or overall of less than 300 ms is recommended by the International Telecommunications Union (ITU), while packet loss must not exceed 3% [12] [13] , otherwise the sound is illegible to the human ear. In the case where the jitter is more than the above-mentioned time limits, a notification is generated to activate techniques that prevent VoIP jitter [14] . Such techniques include; prioritizing VoIP traffic over the network, reserving more bandwidth for real-time conversations and optimizing packet size and jitter buffering. Table 6 shows the network parameters used for the simulation.
We employ the OMNeT++ event simulation framework because it simulates and optimizes WSN nodes, the node is split into modules modelled separately [15] . After launching the simulator, we activated an event log recording to provide us with inputs for the sequence chart for the length of simulation time (that is, as the mobile nodes switch from one access point to another in the course of its movement). A number of handoff decision algorithms have been proposed in literature, there is still a lack of performance comparisons between schemes [16] . For the purpose of comparison, we look at the single case scenario. The integrated network is designed such that there is an overlap of the access technologies employed throughout the playground area.
Furthermore, Figure 4 shows the topology for a single terminal node. The handover network statistics of a single node is analysed to show details captured by the simulator during the handover process. The statistics of the mobile node (0) is captured during the handover of the terminal from the Wi-Fi to the UMTS network and it shows that node (0) records no packet loss or dropped packets during the transmission /transfer of service. This statistic is gotten at a random time during the simulation run at a constant speed by the mobile node (0).
The RSSI based script defines two different thresholds; upper ( ) and lower ( ) thresholds. The instantaneous RSSI value recorded by the mobile terminal of the interface x is compared to these values. The generic subscript x is
Table 6. Simulation environment parameters.

Figure 4. Single terminal node scenario.
used to represent either of UMTS, Wi-Fi, LTE or WiMAX interface; that is is used to establish when the RSSI is insufficient to guarantee a good or stable connection while is used to determine if the RSSI of the interface x is sufficient for a stable connection ( ). Hence, a situation where , handover is initiated and the connection on that interface is torn down. The establishment of the upper and lower thresholds is considered as the first step towards avoiding the ping pong effect. The cell boundaries are critical since the share signal reception from multiple cells, this may cause the MT to connect back and forth between the multiple cells [17] [18] . In a situation where all networks are available, priority will be given to the WiMAX network since it is known to have a better data rate.. Other ways of significantly reducing the ping pong effect includes using fixed hysteresis, mentioned earlier as an RSS decision policy. A higher value ensures that the handoff time will result in more delays. However, this paper is restricted to RSS with Threshold as explained above.
Consider two base transmission stations BTS1 and BTS2 at a distance D meters; a mobile node moving away from BTS1 towards BTS2 at a certain speed will receive signal levels from the two BTS’s according to (13) and (14)
(13)
(14)
where and are the received signals from BTS1and BTS2. and are the shadow fading due to the path loss while and represent two independent zero mean stationary Gaussian process [19] . With these relationships, handover occurs from BTS1 ® BTS2 or BTS2 ® BTS1 depending on the RSSI value, when compared to the threshold. In a situation where the RSSI of both BTS’s is below the minimum power value for which a call is possible, then there is a call failure or call dropped as expressed by the equations below
(15)
-Q-Function. and if then
(16)
We also ran a simulation script for the RSSI based handover algorithm to compare throughput performances of both techniques shown in Figure 5. Network throughput is simply the average rate of messages delivered successfully through the communication channel (with the delivery channel either a logical or physical link).
(17)
The simulation plots shown in Figure 5 clearly show that the Fuzzy based

Figure 5. Throughput performance of Fuzzy-based/RSSI-based handover Algorithm.
handover algorithm has better overall throughput compared to its traditional RSSI based counterpart. We can also infer from the throughput that the average end-to-end delay for the Fuzzy based handover is lesser when compared to that of the RSSI based. Figure 5 is obtained with the transmission of VoIP traffic for the two considered algorithms. It shows the elapsed time since the start of the run and the corresponding throughput in kbps. The throughput for the two techniques allows us to easily see the QoS. Up to about t = 56 seconds, we observe that the two HO based algorithms display an approximately equal throughput but as the mobile device moves further away, the throughput relative to the handover process between the access technologies for the RSSI based algorithm further degrades, when compared to that of the Fuzzy based mechanism. When the VHO manager selects a preferred network, the MT disconnects from its current serving network. In some instances, this disconnection process is automatic (in cases where the remote authentication server keeps the authentication state for a certain period).
As the mobile user continues to move while a traffic session is active, the network response time is captured in Figure 6. At the beginning of transition, an initial value of zero is recorded as the latency. At the simulation time of about 15 to 20 seconds, the UMTS network experience a steady increase from 0.25 s to 0.327 s. In this same time interval, the Wi-Fi time delay increase from 0.13 s to approximately 0.17 s and falls back to 0.13 s. The WiMAX exhibits a response time of 0.06 s with a maximum delay of 0.08 s and later drops to 0.07 s delay.

Figure 6. WiMAX and Wi-Fi Delays.
The Wi-Fi network shows a better response time when compared to the UMTS network which has a wider coverage area while the WiMAX shows a better response time due to its higher data rates when compared to both. LTE, due to its high data rates, records no delay when the Fuzzy algorithm is applied to the nodes thereby providing a stable QoS for the running service of the traffic type. This simulation results show that the Fuzzy based technique considered the handover factor as recorded by all the access points that the mobile nodes receive signals from before selecting the best network. From the plot of the delays experienced by the various networks, we see that the WiMAX network exhibits an average delay variation of about 0.08 s, UMTS has a larger delay variation average of about 0.26 s while the Wi-Fi exhibits a delay variation average of 0.14 s. One of the most important performance metrics in VoIP analysis is Packet end-to-end delay, since it is known that voice streams should be transmitted timely. Packet-end-end delay is the time it takes for a packet to be transmitted from source to destination encompassing the other delays mentioned earlier. The ITU standards stipulates that the average end-to-end delay should be less than 50 ms.
As shown in Figure 6, the average delay in WiMAX appears steady as compared to that exhibited by UMTS and Wi-Fi showing a maximum average end-to-end delay of approximately 0.9 seconds, which is less than the average delay in UMTS (<50%). From the simulation results, LTE and WiMAX network provides better VoIP services in terms of packet delay (end to end) which can be directly linked to their higher data rates and all-IP network type unlike UMTS which comprises of packet switched and circuit switched technologies. As shown in Figure 6, the LTE network has no delay. Besides its traditional characteristics of high data rates, another contributing factor to the perfect performance of LTE in this simulation include the choice of network design and the earlier assumptions made to reduce simulation complexity. In a UMTS network, VoIP call must go through a selection process to choose either the packet or circuit switched technology which adds to the overall end-to-end delay of the network. The back-off delay, as earlier mentioned, prevents the ping-pong effect. With the same network selection mechanism applied to all users, it is expected that in situations where one access network is particularly excellent, all the users will try to handover to that network within a short interval. Depending on the link capacity availability, link quality will drop considerably and again, users will be forced to perform handover. A means of arriving at or computing this back-off delay is to estimate the benefits of handing over to preferred network compared to staying on the serving network. According to [20] , the bigger this quality difference, the lesser the delay. Figure 7 is a chart showing the sent packets network statistics for the different access technologies employed in the implementation of the HetNet.
This gives us a view on the VoIP traffic behaviour of the network in terms of congestion before the multiple criteria is applied at the interface. Figure 8 shows the sent packet data for the same node with the multi criteria methodology applied. We can see that there is a significant improvement in the data rates. An average of above 50% is recorded on the simulator for the best performing RAT.
We must bear in mind that the statistics is recorded at different distances from the access points and different time variations in both cases. It further shows that when adopted, seamless vertical handover decision algorithm (VHDA) greatly contributes to achieving the goal of maximizing the use of free data quota from the cellular system by selecting the most suitable network. The successful handover probabilities recorded thus minimizes data drop rates. A comparison of the Sent data Packet_Net statistics of before and after the application of VHDA
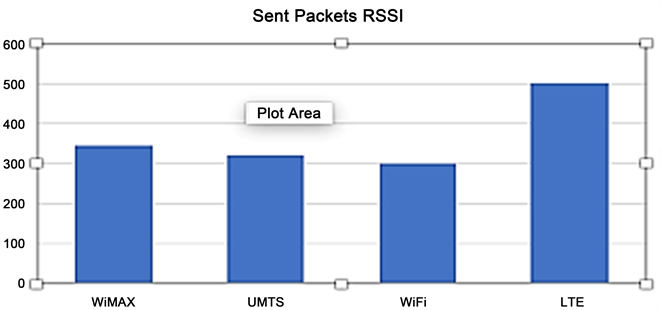
Figure 7. Sent Packet_NET Statistics for Node 1.
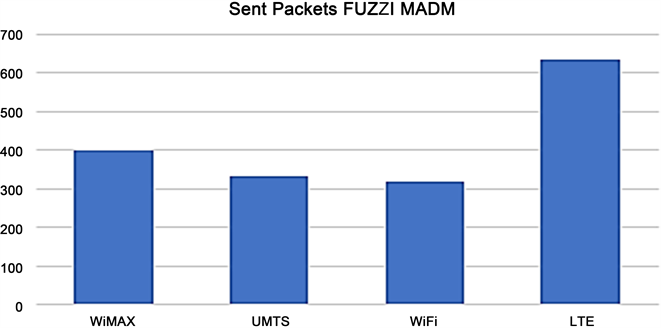
Figure 8. Sent data Packets_Net Statistics for Node 1.
(RSSI and FUZZY MADM) shows that the data sent for VoIP was less with RSSI and substantially greater after MADM’s application to the node interfaces. This variation from the two statistics can be used to arrive at the amount of data dropped for the running VoIP application. Figure 9 shows a scattered plot of the activity of the ten mobile nodes used in the simulation at randomly selected time and distance. The plot is a capture of the sent packet status of the mobile devices as they transit the network playground. Sent packet rates are important because they have direct consequences on the end-2-end delay, which in turn affects the average throughput. This is so because in cellular networks, packets are transmitted via several network links, typically in segments before reconstruction takes place at the receiver end. Mechanisms like ARQ are employed to retransmit corrupted data automatically. This is the main reason for the packet delay, which ultimately influences the end-2-end delay mentioned above. During the simulation, we observed that packets arrive the destination in bursts and the inter-packet arrival time showed that these bursts or clusters arrive at a time difference of approximately 13 ms interval. A plot of the individual inter-packet arrival time of each of the network will show the time differences of packet delivery in the different access technologies. The scattered plot for the bandwidth usage shows node 1 has the highest usage of about 82 kbps and each of nodes 0, 3, 6, 8 and 9 have a consistent average value of 51 kbps.
Figure 10 shows the handover probabilities of the HetNet at different locations during the event simulation. It can be seen that from the beginning of our simulation observation, the access technology providing services to the mobile user measures good QoS parameters. It shows that all the mobile users in that region serviced by either of the three radio access technologies experience good QoE, thus there is no need for a handover procedure to be initiated during that time phase. As the event simulation runs and some of the network parameters change, there is a change in the throughput of the various networks and subsequent degradation of network services and thus the probability of handing over arises.

Figure 9. Nodes[0-9] SentPkT_Bandwidth Analysis.

Figure 10. Handover Probability at random distances.
6. Conclusions
This paper has attempted to analyse the multi criterion and single criteria basis of vertical handover techniques by implementing the Fuzzy based technique with respect to HetNets. We have carried out simulations that evaluate performance of single based criterion (traditional RSSI) and multiple based criteria methodology and results show that intelligent handover decision methods are essential to selection in HetNet’s. We have also analyzed KPI like end-2-end delay, PDV, throughput and jitter to show superiority of Fuzzy MADM when applied to network selection process. LTE and WiMAX networks outscore Wi-Fi and UMTS, with LTE technology performing best in this handover simulation procedure. From our discussion of vertical handover, HetNet and intelligent selection process, it is clear that HetNet is still an evolving technology.
Future work will focus on further enhancement of intelligence in the network selection mechanisms (artificial intelligence, augmented reality).
Acknowledgements
The authors acknowledge the contributions of A/Prof Olabisi Falowo (Department of Electrical Engineering, University of Cape Town, South Africa) towards this research work.
Conflicts of Interest
The authors declare no conflicts of interest regarding the publication of this paper.
Cite this paper
Edia, A., Osanaiye, O., Aina, F. and Ogundile, O. (2018) Comparison of Vertical Handover Decision-Based Techniques in Heterogeneous Networks. Int. J. Communications, Network and System Sciences, 11, 239-259. https://doi.org/10.4236/ijcns.2018.1112015
References
- 1. Duncan, M. (2017) Number of Smart Phone Users Worldwide. http://www.statista.com/statistics/330695/
- 2. Beaverton (2011) WiMAX Forecast. http://www.wimaxforum.org/
- 3. Calvagna, A. and Di Modica, G. (2004) A User-Centric Analysis of Vertical Handover. Proceedings of the 2nd ACM International Workshop on Wireless Mobile Applications and Services on WLAN Hotspots, Philadelphia, 1 October 2004, 137-146. https://doi.org/10.1145/1024733.1024751
- 4. Omond, O., Muntean, G. and Murphy, J. (2007) Dynamic Network Selection in Wireless LAN/MAN HetNets in Mobile WiMAX. Towards Broadband Wireless Metropolitan Area Networks. CRC Press, Boca Raton.
- 5. Li, M., Claypool, M. and Kinicki, R. (2008) Wbest: A Band Width Estimation Tool for IEEE802.11 Wireless Networks. IEEE Conference on Local Computer Networks (LCN), Montreal, October, 374-381.
- 6. Peffers, K., Tuunanen, T., Rothenberger, M.A. and Chatterjee, S. (2007) A Design Science Research Methodology for Information Systems Research. Journal of Management Information Systems, 24, 45-77. https://doi.org/10.2753/MIS0742-1222240302
- 7. Vaishnavi, V. Kuechler. B. and Petter, S. (2004) Design Science Research in Information Systems. Computer Information Systems Department, Georgia State University. Distant Production House University (DPHU). http://www.dphu.org/uploads/attachements/books/books_3407_0.pdf
- 8. Mathiyarasi, S. and Mohanapriya, R. (1966) Vertical Handoff Based on Fuzzy Logic Method for WiMAX/WLAN Networks. International Journal for Future Innovative science and Engineering Research, 1, 8-16.
- 9. Tamea, G., Vegni, A., Inzerilli, T. and Cusani, R. (2009) A Probability Based Vertical Handover Approach to Prevent Ping-Pong Effect. 6th International Symposium on Wireless Communication Systems, Tuscany, 7-10 2009. https://doi.org/10.1109/ISWCS.2009.5285308
- 10. http://www.voip-info.org/users/view/tenarys
- 11. Monfort, J. (2003) Basic Requirements to Quality of Service (IP Centric). Workshop on Standardization in E-Health, Geneva, 23-25 May 2003, France Telecom T &I/R&D ITU-T SG 12 2012.
- 12. Pan, J. (2008) A Survey of Network Simulation Tools: Current Status and Feature Developments. A Project Report Written under the Guidance of Prof. Raj Jain. https://s3.amazonaws.com/academia.edu.documents/41418203/simtools.pdf?AWSAccessKeyId=AKIAIWOWYYGZ2Y53UL3A&Expires=1544282911&Signature=I0td7EWUYDoazhV9xdwfB0nh9Yo%3D&response-content-disposition=inline%3B%20filename%3DA_Survey_of_Network_Simulation_Tools_Cur.pdf
- 13. Yoo, S.J., Cypher, D. and Golmie, N. (2007) LMS Predictive Link Triggering for Seamless Handovers in Heterogeneous Wireless Networks. Proceedings of Military Communications Conference (MILCOM), Orlando, 29-31 October 2007. https://doi.org/10.1109/MILCOM.2007.4455128
- 14. Ribadeneira, A.F. (2007) An Analysis of the MOS under Conditions of Delay, Jitter and Packet Loss and an Analysis of the Impact of Introducing Piggybacking and Reed Solomon FEC for VOIP. Thesis, Georgia State University, Atlanta.
- 15. Varga, A. (2001) The OMNeT++ Discrete Event Simulation System User Manual. European Simulation Multi-Conference (ESM’2001), Parague, Czech Republic.
- 16. Stevens-Navarro, E. and Wong, V.W.S. (2006) Comparison between Vertical Handoff Decision Algorithms for Heterogeneous Wireless Networks. IEEE 63rd Vehicular Technology Conference, Melbourne, 7-10 May 2006.
- 17. Naeem, B., Nagh, R. and Hashim, S. (2018) Reduction in Ping-Pong Effect in Heterogeneous Networks Using Fuzzy Logic. Soft Computing, 1-15. https://doi.org/10.1007/s00500-018-3246-2
- 18. Dhar, S. and Ray, A. (2010) Design and Simulation of Vertical Handoff Algorithm for Vehicular Communication. International Journal of Engineering Science and Technology, 2, 5509-5525.
- 19. Vijender, S. and Gill, S. (2014) Signal Strength Estimation of Wireless Communication System. International Journal of Advanced Research in Computer Engineering & Technology (IJARCET), 3, Issue 8.
- 20. Khan, M., Din, S., et al. (2017) Enabling Multimedia Aware Vertical Handover Management in Internet of Things Based Heterogeneous Wireless Networks. Multimedia Tools and Applications, 76, 25919-25941. https://doi.org/10.1007/s11042-017-4736-4