International Journal of Communications, Network and System Sciences
Vol.10 No.03(2017), Article ID:75656,28 pages
10.4236/ijcns.2017.103003
Big Data Analysis in Smart Manufacturing: A Review
Kevin Nagorny1, Pedro Lima-Monteiro2, Jose Barata2, Armando Walter Colombo3
1ATB―Institute for Applied Systems Technology Bremen GmbH Wiener Straße, Bremen, Germany
2Uninova-Instituto Desenvolvimento de Novas Tecnologias, Faculdade de Ciências e Tecnologia, Caparica, Portugal
3Institute for Industrial Informatics, Automation and Robotics of the University of Applied Sciences Emden/Leer Constantiaplatz, Emden, Germany

Copyright © 2017 by authors and Scientific Research Publishing Inc.
This work is licensed under the Creative Commons Attribution International License (CC BY 4.0).
http://creativecommons.org/licenses/by/4.0/


Received: February 14, 2017; Accepted: March 28, 2017; Published: March 31, 2017
ABSTRACT
The technological evolution emerges a unified (Industrial) Internet of Things network, where loosely coupled smart manufacturing devices build smart manufacturing systems and enable comprehensive collaboration possibilities that increase the dynamic and volatility of their ecosystems. On the one hand, this evolution generates a huge field for exploitation, but on the other hand also increases complexity including new challenges and requirements demanding for new approaches in several issues. One challenge is the analysis of such systems that generate huge amounts of (continuously generated) data, potentially containing valuable information useful for several use cases, such as knowledge generation, key performance indicator (KPI) optimization, diagnosis, predication, feedback to design or decision support. This work presents a review of Big Data analysis in smart manufacturing systems. It includes the status quo in research, innovation and development, next challenges, and a comprehensive list of potential use cases and exploitation possibilities.
Keywords:
Big Data Analysis, Smart Manufacturing Systems, Data Mining, Decision Support, Cyber-Physical Systems

1. Introduction
Keywords such as service-oriented architectures (SoA), Internet of Things (IoT), systems of systems (SoS), big data analysis, autonomous units, adaptive and predictive control, complex event processing, or forecasting of complex scenarios, are some words used for explaining smart manufacturing systems, which emerged from the (often called) fourth industrial revolution [1] .
Smart manufacturing systems are no longer hierarchical physical and logical capsulated systems, but heterogeneous, loosely coupled, non-hierarchical structured, cyber-physical systems of systems with event-based communication, collaborating in unified networks [2] . Collectively seen, such new ecosystems generate new technological possibilities potentially suitable to satisfy sophisticated customer demands, expectations and desires. This means e.g. new KPIs (e.g. eco-efficiency), production flexibility, product and production visibility, or waste efficiency; as well as new (kinds of) influencing factors as customizable products, dynamic marked trends, social media feedback, supply chain adaptations, ambient conditions, or changes in product-, system- or order life-cycles.
The complexity of smart manufacturing systems generates new challenges for research, innovation and development activities. New approaches, even partly for traditional applications as for control, monitoring, observation or optimisation are needed, to handle such new systems in an effective and efficient way. This work will focus on the analysis of such systems, based on Big Data, produced by them.
Smart Manufacturing systems are producing a variety of data; combine mixed and aggregated with data from interconnected systems, potentially located in several layers and domains. Finding new associations, influencing factors and patterns in these data; and observing such findings through Big Data stream observation (also in real time), is one of the main objectives of big data analysis in smart manufacturing. It potentially
・ enables the generation of knowledge in huge amounts of continuously changing data (streams) e.g. as basis for decision support;
・ enables the observation of value streams, based on such associations and patterns e.g. for simple monitoring, or for the detection of anomalies;
・ increases the visibility of such systems e.g. useful for model optimization as basis for prediction of happenings;
・ enables new kinds of diagnosis possibilities;
・ supports KPI optimization;
・ etc.
The exploitation of these use cases will potentially innovate business fields through improved maintenance services (e.g. anomaly/failure detection/pre- diction, system observation); pattern observation e.g. for hacker detections; extended manufacturing system reports; KPI improvements/monitoring; customer demands identification based on Big Data analysis; or virtual model improvements of physical components and processes for simulation. This was just a small range of potential possibilities for exploiting Big Data analysis in the domain of smart manufacturing and should provide an initial impression of the potential in this topic.
In general, Big Data analysis is strongly connected with classical data analysis and mining approaches, applied on large amounts of data. Data usually comes from a variety of sources and needs to undergo a series of procedures such as sampling and querying [3] . Related to Smart Manufacturing, further considerations need to be made, such as huge amounts of multi-characteristic data, architectures, and mining in dynamic streamed data or (historical) data buckets [3] .
The methodology for the structure of this paper about Big Data analysis in smart manufacturing follows a top down structure as shown in Figure 1. The paper starts with an overview on European research in the addressed area (section 2.1). Analysed were selected European research roadmaps to identify research activities, challenges and aimed goals of different institutions cooperation’s or programs. Based on outcomes of this analysis were identified and analysed a range of projects (section 2.2) which are contributing to analysed research roadmaps. After the identification and analysis of related research projects is provided a State of the Art (SotA) (section 3) of research topics and technologies addressed by these roadmaps and projects. After the SotA, the paper provides a range of potential use cases and exploitation potentials (section 4) for Big Data analysis in smart manufacturing. The paper ends with open research challenges (section 5) based on gaps between SotA and Use Cases and introduces two future projects (section 6) which are partly addressing some of the identified gaps.
2. Roadmaps and Related Research Activities
This chapter provides an insight on selected European research roadmaps (see section 2.1) [4] , relevant for big data analysis in (smart) manufacturing to identify the perceived value of this topic, and to identify plans for research, innovation, development and exploitation. Section 2.2 describes European research and/or innovation projects related to Big Data analysis in (smart) manufacturing, their (already delivered/planned) contributions and identified important sub-topics, and section 2.3 tries to synthesise and summarize the current activities related to Big Data analysis in (smart) manufacturing.
2.1. European Research Roadmaps
This section shows a selection of the most important research roadmaps in Europe concerning Big Data analysis in relation to (smart) manufacturing listed and summarized in Table 1.
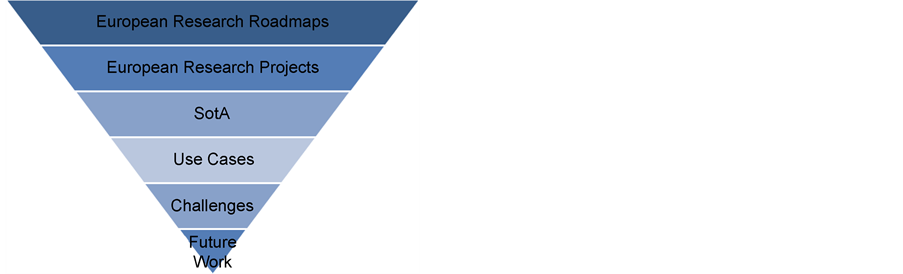
Figure 1. Structure of this article.
2.2. European Research Projects
Table 2 shows a list of selected European research, innovation and/or development

Table 1. European research roadmaps.
Table 2. A selection of European research, innovation and/or development projects.
projects that have contributed, or are contributing to the area of Big Data analysis in (smart) manufacturing. Other projects can be found with the CORDIS service of the European Commission (http://cordis.europa.eu/).
2.3. Synthesis of Research Activities
From sections 2.1 and 2.2, it can be synthesised that Europe is getting more and more interested in Big Data (analysis). Considering the new approaches towards IoT and the increasing amounts of data present in production lines, it is a logical consequence to categorize Big Data as an important topic through the growing high potential value in it.
In this sense, there are several initiated, ongoing and past European projects, which already scratch on the surface of this challenge. These projects attempt to use Big Data concepts for product management, consumer feedback or optimisation, and include often topics related to classical data analysis, data mining and machine learning adapted to Big Data.
Summarizing up, Big Data analysis in smart manufacturing has several use cases with a huge field for potential exploitation, and is an important topic for the future.
3. State-of-the-Art
This chapter provides a State of the Art (SotA) of selected important topics related to Big Data analysis in smart manufacturing.
Figure 2 shows the structure of this chapter. 1st, the infrastructures of Smart Manufacturing systems including requirements and examples, to get an overview and a better understanding of Smart Manufacturing ecosystems, will be described. 2nd, Big Data in Smart Manufacturing environments will be presented, to show which sort of data is available in these systems. 3rd, a SotA of Big Data analysis methodologies and approaches will be presented; and finally (4th), will be presented a SotA of technologies, which are already available or under development.
3.1. Smart Manufacturing Infrastructures
The so-called fourth industrial revolution describes mainly the exploitation of the trend that electronics are getting smaller, faster, cheaper and mobile; and
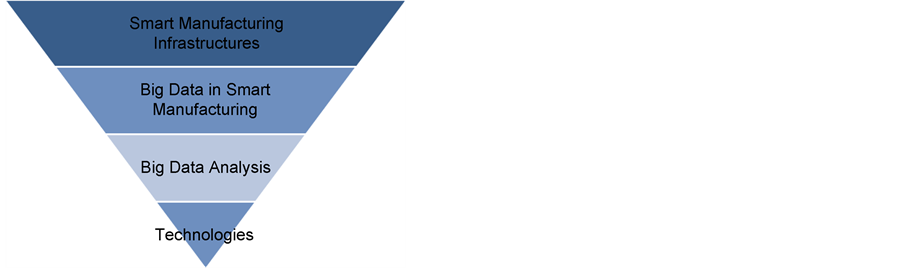
Figure 2. Structure of the SotA chapter.
that the IT infrastructure (WLAN, LAN, MAN, WAN, etc. including connected servers, databases, application software) is expanding worldwide, becoming fas- ter and enable electronics to connect to this infrastructure.
Achievements of the third revolution as GPS, high precise robots, new kinds of highly precise sensors and actors, etc. are the basis for the fourth industrial revolution. Examples therefore are for instance, emerging third platform technologies with inter-dependencies between social media, mobile and cloud computing, and (big) data analysis [19] to unlock potentials of conventional IT technologies; or the deployment of innovation accelerators as IoT, 3D printing, and robotics, coupled with the integration of operation technologies (OT) [20] .
Future smart manufacturing infrastructures have to enable the exploitation of these new opportunities. Even today, people are surrounded by interconnected digital environments continuously generating more synergies with connected devices and software. Such an evolution happens also in the manufacturing domain. Future Smart Manufacturing infrastructures are confronted with the digitalisation and virtualisation of (physical) objects enhanced with sensors, processors, memory and communication devices, able to communicate coactively and to exchange information independently through a reactive, predictive, social, self-aware and/or autonomous behaviour [21] [22] . A used term for such intelligent physical objects is Cyber-Physical System (CPS) which are communicating in (Industrial) Internet of Things ((I)IoT) networks.
To exploit these new opportunities, specific requirements in this domain as real-time, security or safety have to be considered. Figure 3 shows a selection of sub-topics and is the basis for the structure of this section. Figure 4 shows a division of a smart manufacturing infrastructure into five different layers, described bottom-up in the following.
3.1.1. Network Technologies
Smart Manufacturing infrastructures have to be based on network technolo-
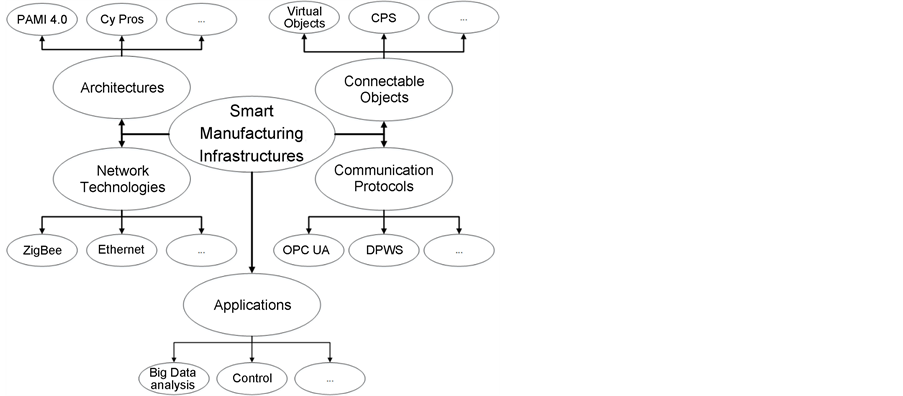
Figure 3. Sub-topics of this chapter related to smart manufacturing infrastructures.

Figure 4. Layers of a smart manufacturing infrastructure.
gies which enable a secure (encryption, authentication, robustness, safety), vertical and horizontal cross-domain and cross-layer communication between stationary and mobile objects (as virtual objects, sensors, actors, devices, things or systems). Network technologies have to comply with specific requirements related to e.g. real-time, safety, security, data amounts, wired or wireless, passive or active, etc. [23] . Lower field-levels require time frame abilities of seconds or milliseconds for response, reliability, resolution, and repair (e.g. control, or real- time statistics of the process), whereas higher levels only require time frames of weeks or months (e.g. for production planning or accounting) [23] .
Potential suitable technologies are e.g. ZigBee, (Industrial) Ethernet, 6LowPan, ZigBee, Wi-Fi or Bluetooth.
3.1.2. Communication Protocols
Communication protocols in smart manufacturing should enable a robust, loosely coupled, time-synchronized, secured, and semantically based communication.
It is hardly possible in smart manufacturing infrastructures, where thousands of communicating objects are reachable from everywhere, to exchange information traditionally loop based (e.g. on field level (ISA-95 levels 1 - 2) via a bus in a defined frequency to enable a deterministic information exchange). That generates a need for new approaches to reduce the traffic in networks whilst holding on to all requirements. Such a new approach is e.g. the paradigm “service-ori- ented architectures (SOA)”. SOA describes an architectural pattern in which functionalities and features of systems, components, applications, etc., are provided as a service in a network where all services can be found and accessed using publish and subscribe mechanisms in form of complex event processing as an alternative for control loops and to reduce traffic in the network. Services are “logical representations of a repeatable business activity that has a specified outcome (e.g. check customer credit, provide weather data, consolidate drilling reports), is self-contained, may be composed of other services and is a ‘black box’ to consumers of the service [24] ”.
Potential suitable technologies are e.g. implemented DPWS specifications or OPC UA.
3.1.3. Architectures
Architectures, in general, are describing combinations of components/modules and their interaction, and should provide a unified structure and wording for used terms. An architecture should include a logical, a development, a process and a validation view, and should provide scenarios for a validation as proposed by Philippe Kruchten in his 4+1 architectural view model [25] . A smart manufacturing architecture should also provide a unified structure and wording covering mandatory aspects in smart manufacturing as product, system or order life cycles, value streams, information flows, or hierarchical layers. Such architectures are currently under development.
Example projects and architectures that contribute to this area are e.g. RAMI 4.0 [26] , Arrowhead [27] , CyPros [28] or Fi-Ware [29] .
3.1.4. Connectable Objects
(Physical) reachable objects inside a smart manufacturing network (e.g. digitalised and virtualised field level devices, systems, material, integrated humans, virtual concepts (e.g. of products in the design phase), etc.), have to fulfil a range of requirements. Objects should communicate using a unified communication protocol, at least at the application level, and should be based on a unified semantic to enable a mutual identifiability and understanding. The object itself should provide its own features as a service (e.g. state information or functionalities), and should be able to provide its own description next to extended information as manuals, specifications or wear information. All these have to be kept next to further requirements related to security, safety or quality of service [26] [30] .
3.1.5. Connectable Applications
Finally, various applications that use services of deployed objects to realise e.g. control systems, systems of systems through service orchestration, or―as focused in this work―Big Data analysis applications can be implemented.
3.2. Big Data in Smart Manufacturing
Figure 5 shows a selection of sub-topics and is the basis for the structure of this
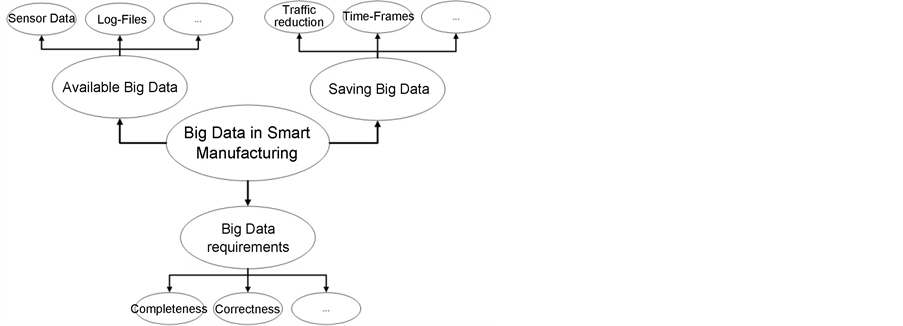
Figure 5. Sub-topics of this chapter related to big data in smart manufacturing.
section.
3.2.1. Available Data
The definition of Big Data is still under discussion and many suggestions were made. Gartner made a proposal in 2011 where he suggested to categorise Big Data through 3Vs (Volume of Data, Variety of Data and Velocity of Data) [31] . This categorization (/definition) is widely accepted. Newer definitions have also added a fourth “V” standing for “veracity” which describes the quality of captured data that can vary and affect the accurate analysis [32] .
Big Data in Smart Manufacturing systems are big amounts of (continuously generated) data produced by machines, ambient sensors (temperature, vibration, humidity, etc.), controllers, (manufacturing) systems, etc. [33] available in a great variety as e.g. in form of signal/information streams, log files, master data, manual entered operator data, etc.
It is also conceivable for Big Data analysis, to include further data sources from the enterprise level systems, supply chains, marketing and sales, Product Lifecycle Management (PLM) systems, social media, website browsing pattern or from business forecasts [34] .
As described in Section 3.1, a smart manufacturing infrastructure should enable data access to nearly all data, available in its environment. Data should be pre-processed and aggregated, and send to receivers/subscribers (e.g. a Big Data analysis system) in an event-based way (see paragraph about “Saving Data” below) e.g. to reduce the amount of traffic in a network. A Big Data analysis system should also save these data to enable a historical analysis for detecting long-term patterns as e.g. related to wear and tear of devices.
3.2.2. Data Requirements
For analysing Big Data in smart manufacturing, it is necessary to have:
・ enough data to make useful analysis.
・ complete data to avoid miss-interpretations [35] .
・ correct data which should describe real processes.
・ available meta-data and data descriptions to simplify the analysis process.
What this means in detail is often dependent on the concrete use case.
3.2.3. Saving Data
Produced Big Data in smart manufacturing systems can be analysed from (real- time) data streams (short term pattern) up to full historical data buckets. However, it is important to think about reducing the data without losing meaningful data. Thousands of sensors cannot send data each millisecond to a data analysis solution through an smart manufacturing infrastructure. Reducing traffic can be done through different combinable approaches:
・ send event-based data (send data only if needed).
・ send data aggregated (averages, sums, etc.).
・ send bigger data packages in form of log files in which (aggregated) data are stored locally.
Data sent to a data analysis system has to be saved in an appropriate database as described in section 3.4.1.
3.3. Big Data Analysis
Big Data analysis is becoming an interesting topic [36] [37] and is a broad interdisciplinary research area which covers the idea to extract implicit, previously unknown, and potentially useful information from data [38] . It includes a range of sub-topics [39] , such as Big Data analysis processes (describing the process of a big data analysis in general), simple Big Data analysis mechanisms (considering the creation of histograms, counting, summarising, etc.), or Data Mining, which includes a range of methodologies for advanced analytics or knowledge extraction. Figure 6 shows a selection of such sub-topics and is the basis for the structure of this section.
3.3.1. Big Data Analysis Processes
The process of making Big Data analysis is often similar to the Cross-Industry Standard Process for Data Mining (CRISP-DM) as shown in Figure 7.
In any case Different experts are needed before a Big Data analysis can start. At least two experts are needed to make the Big Data analysis itself: a data scientist who understands the analysis methodologies and who is able to use the tools; and an IT expert who is able to deploy, configure/administrate databases and computer clusters, needed for the analysis of Big Data [35] .
In addition, two other experts are commonly needed: One expert who has clear expectations of Big Data analysis outcomes, and another expert who has knowledge about the (input) data for the analysis [35] .
In manufacturing this could mean, that a production site expert, who has clear expectations of big data analysis outcomes is needed (as e.g. an optimisation of a KPI); and a manufacturing expert, who knows the production process and the available data needed for the analysis [35] .
In general it is very important, and a big challenge, that all involved experts get a
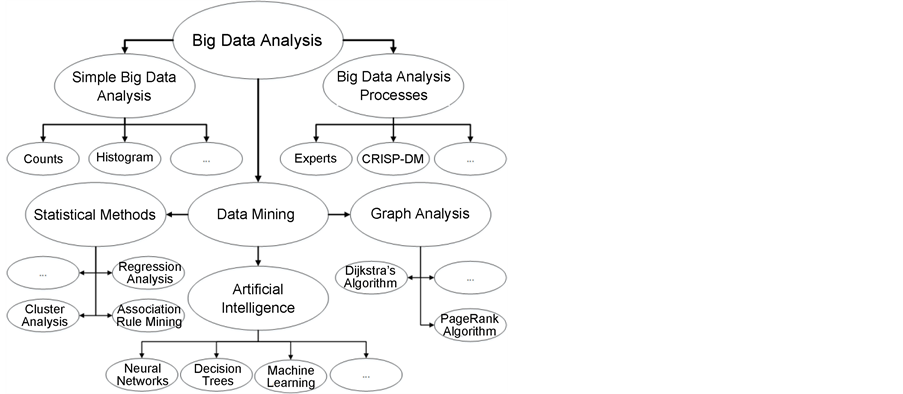
Figure 6. Sub-topics of this chapter related to classical big data analysis.

Figure 7. The cross-industry standard process for data mining (CRISP- DM) (taken from [43] ).
clear common understanding of aimed Big Data analysis expectations/goals [35] .
Coming back to the analysis process itself, as already introduced, a typical analysis process often follows the CRISP-DM standard [40] [41] , which is divided into six phases [42] , as indicated in Figure 7:
Each phase includes different tasks:
1st Phase―Understanding the Business: includes the determination of business objectives, situation assessment, and the determination of Big Data analysis expectations/goals.
2nd Phase―Data Understanding: includes the collection of initial data, exploration and description of data, and the verification of data quality.
3rd Phase―Data Preparation: includes the selection, cleaning, construction, integration and formatting of data.
4th Phase―Modelling: includes the selection of a modelling technique, the generation of a test design, and the building and assess of a model.
5th Phase―Evaluation: includes the evaluation of Big Data analysis results, knowledge discovery and planning of the next steps.
6th Phase―Deployment: includes the exploitation of lessons learned, as for example the use of new knowledge e.g. for predictions, further observations, decision support or automation [35] .
3.3.2. Simple Big Data Analysis
Big Data analysis is a heuristic process. Analysing Big Data compared to related topics as classical Data Mining, requires the consideration of great amounts of data that are not processable through classical data mining approaches. Big Data analysis needs therefore approaches to access and process these amounts of data very fast, and needs therefore scalable, linear and parallelizable algorithms, as well as storage approaches. Simple Big Data analysis includes some methods that fulfil these requirements for fast processing of Big Data.
Interim results coming from simple Big Data analysis are often basis for further data mining to reduce the complexity of Data, preferably without losing valuable information. Simple Big Data analysis results are coming among others from descriptive statistical methods as calculations of averages, shapes of distribution histograms (normal, exponential, Poisson), but can be also sums, minimums and maximums values.
Such simple big data analysis results can be final results, but also interim results for further processing in data mining, artificial intelligence or machine learning approaches.
3.3.3. Data Mining
Statistics, graph analysis, artificial intelligence and machine learning approaches are suitable for data mining in smart manufacturing. A small overview will be provided in the following for each sub-topic indicated in Figure 6.
Statistical methods in Big Data analysis are used e.g. for the identification of clusters in data, the identification of associations, or the analysis of regressions. Meaningful data as the identification of clusters and associations in data, potentially helps to understand how statistical obtained values correlates, and how they affect each other.
Through such information can be derived happenings, behaviours, and relationships of/between smart manufacturing system components, processes and supply chains. Such knowledge is useful to improve virtual models of them, used for simulation and prediction, as basis for several use cases as the improvement of KPIs (performance, efficiency, etc.), or to make regression analysis to enable the determination of system control for real-time adaptions based on the results.
Statistical methods are commonly used in manufacturing for scheduling and diagnosis, but are also regularly used on the Enterprise Resource Planning (ERP) level (s. ISA-95) to establish mathematical correlations between their profits, expenditures and produced goods.
Another approach to get information out of Big Data is graph analysis. In graph analysis data are represented in a graph [44] . Many things can be represented in a graph, as social media networks, power grids, knowledge (in form of ontologies), street maps, etc. In the smart manufacturing domain a graph could e.g. represent IoT interactions, energy flows, processes or supply chains [45] .
The analysis of paths, connectivity, community, or centrality of/between objects inside a graph, are parts of graph analysis [46] . Path analysis is used to proof reachability between two objects in a graph, to find a path with no repeating edge, to find cycles, or to find a shortest path between nodes. Connectivity analysis is used to provide answers of how strong an object is connected with other objects, how robust a graph is, or could provide answers of the similarity of graphs. Community analysis is used to identify objects that are often interacting (communities/clusters) and its evolution. Centrality analysis is used to get information about the importance of nodes (e.g. in case that a node is connected to many other nodes, which could be an indication of a high importance, or a single point of failure). Based on the specific use case in manufacturing (as already said, e.g. representation of IoT interactions, energy flows, processes or supply chains), such analyses can provide meaningful information about the analysed system.
In addition, the Dijkstra algorithm, a popular example in graph analysis, is very useful for finding shortest paths in smart manufacturing systems. A graph could represent a flexible transportations system, where it is necessary to find the shortest path between start and destination. To do so, iterative algorithms, such as Dijkstra’s, perform tasks on an input, over and over again, which leads to expensive and unnecessary reloading of data [47] . In cases such as these, bulk synchronous parallel (BSP) [48] processing of the data constitutes a good alternative. In systems that follow this model, computation is done through successive super steps, where computation occurs simultaneously in each of the participating nodes. Once this is done, a final and global synchronization step is needed.
A potential use case for graph analysis in smart manufacturing could be the optimization of the energy efficiency, through the representation of energy grids or processes as a graph. One approach could be the optimization of processes through the identification of the lowest/highest energy consumption over time (in nodes and edges of the graph). Through this information, and in combination with a parametrized Dijkstra algorithm, the most energy efficient route or control setting for a future similar task can be chosen. Another approach could the optimization of the control. A manufacturing process, represented as a graph, could support the identification and prediction of components, which are not used in a specific period within a manufacturing system. Such information would be used to shut down components, or to turn them into a low consumption/standby mode during this time.
However, graph analysis is a very computing intensive process and mostly limited to hardware performance capabilities, given that classical approaches store the entirety of the graph in memory. To improve this circumstance, it is currently being studied to load smaller partitions into memory and to handle communication at this level. An overall comparison on the several existing Graph models is given in [49] .
Artificial Intelligence (AI) concerns computational heuristic methods. An AI method is considered as such, if it is capable of learning something by its own means. This research field is often materialised in the form of Neural Networks (NN) and Decision Trees (DT) (two of the most intensively researched fields within AI). This field has a variety of applications in an equally wide spectrum of other research and enterprise areas. Concerning manufacturing, both NN and DT are widely used as diagnosis approaches, often as part of other self-learning paradigms. Behind classical manual diagnosis, individual diagnosis solutions are often used for manufacturing systems. Researchers are working on new approaches based on, for instance, automatic (predictive) failure detection through fault tree analysis (FTA) [50] , or self-learning approaches [51] . These approaches handle also systems with a higher complexity (evolvable and emergent systems with changing physical and logical conditions and behaviours). FTA is a methodology for fault detection based on tree composed and linked logical Boolean functions. States which could result in a defined combination to an error, have to be identified through the FTA, and will result on of the top tree level in an error state (e.g. when an unwanted combination of sub-states appears) [52] .
Self-learning approaches are constantly observing systems in order to learn the normal behaviour of a system, and to detect anomalies and failures, based on the knowledge extracted. Deterministic finite automaton (DFA) [53] is one popular research field in this direction where, algorithms observe systems to build deterministic finite automats, which represents a correct behaviour of the system. In case where the system gets into a state which is not covered by the model (generated in the learning phase), a pre-defined reaction will be triggered, e.g., sending an alarm or start a troubleshooting routine [50] . This method also allows to evaluate the progression of a failure. Another research field that has been around for several years and has grown in importance with the current distributed and learning concerns is that of bio-inspired algorithms. These algorithms, e.g. the Artificial Immune Systems ( [54] [55] [56] [57] [58] ), emulate the behaviour of several animals, and even humans, in order to provide machine learning capabilities.
These algorithms depend on their knowledge base. This means that they depend on existing knowledge (data) to obtain new information using their algorithms. Often, the result can be untrustworthy given that the knowledge base is insufficient to obtain conclusive results. For example, to understand what is the best opportunity to put a station on a minimum consumption standby, it is not enough to assess its behaviour twice, but rather for a whole month. By using Big Data (interim results) as source for their algorithms, the obtained results may prove themselves as much more trustworthy. Hence, AI can be used in Big Data analysis to perform, for instance, dynamically AI supported scheduling of the stations in a shop floor.
Machine Learning (ML) is currently described as computational methods that use experience to improve performance, or make accurate predictions [59] . Experience is often nothing more than a knowledge-base of a computational method/algorithm. This knowledge-base allows these algorithms to reason on whether the obtained results are better or worse than the ones previously known. If these results are better, the system’s mechanism can be changed, or not, according to the use cases.
Machine Learning represents a set of algorithms that are being widely used in a vast range of applications and in several use cases as energy analysis [60] [61] . Some of the most important algorithms are C4.5, k-means clustering, support vector machines, Apriori, expectation-maximization, k-nearest neighbours class, Naïve Bayes and CART [62] , used for instance to build decision trees, classification on matrices, identification of frequent item sets, finding of association rules or clustering [63] .
From a Big Data perspective, specially taking into account the smart manufacturing domain, ML is viewed as a mean to obtain better performance results, as in obtaining lower energy consumptions, or obtaining a product faster. On the other hand, ML is also very important to, firstly, understand the processes e.g. which cause more tear and wear to the machines, and secondly, to determine the best alternative to those processes. This introduces another whole importance to ML, since it enables machines in a smart manufacturing environment to diagnose themselves faster and more efficiently [64] .
3.4. Technological Review (Tools)
In the last few years, a range of technologies (tools, frameworks, algorithms) related to Big Data analysis emerged. The most can be gathered into three main subjects:
・ Data Storage―Technologies for storing and accessing massive amounts of Big Data
・ Data Processing―Technologies to provide several features for data analysis and processing
・ Machine Learning―Technologies for machine learning used on top of processed data, in order to extract valuable information and knowledge for further exploitation.
There are several Big Data technologies on the market for analysing poly- structured data sources, which also include background functionalities such as Big Data integration, Big Data storing, Big Data analysis and Big Data evaluation (see Figure 8).
Figure 8 describes the process of how data undergoes from its source to the final evaluation, in a layered manner. Firstly, poly-structured data need to be integrated through ETL (Extract-Transform-Load), or ELT (Extract-Load-Trans- form) strategies [66] , using Big Data frameworks such as Apache Pig. Secondly,

Figure 8. A selection of available big data technologies (compare figure of the BARC in [65] ).
the Big Data needs to be stored using technologies as NoSQL databases, or the Hadoop Distributed File System (HDFS). Thirdly, will be analysed the data through frameworks and tools that provide related features (see Section 3.4.2). Fourthly, results of Big Data analysis will be accessed through interfaces as provided by Apache Hive. Once the results are accessed, they can be evaluated and exploited in several use cases.
Therefore, this section introduces a range of technologies along this process bottom up. Section 3.4.1 is an introduction into data storage technologies. Section 3.4.2 introduces to data processing frameworks, where the MapReduce algorithm and technologies that had its origin in it are focused. Some processing tools such as RapidMiner and the R programming language, are also introduced. Finally, Section 3.4.3 introduces some Machine Learning oriented frameworks and tools, with focus on those that allow developers to build on top of them.
Note: It is important to emphasize that introduced tools are often combining data storage technologies, data processing, or machine learning algorithms, so that a clear deviation into specific topics is not always possible.
3.4.1. Technologies for Data Storage
With the growing amount of available data The former RDBMS centralised and concurrent, became inappropriate to handle huge chunks of Big Data with the growing amount of available data with changed structures [67] .
Hence, to cope with this change of data towards data with Big Data characteristics, a new type of database emerged which is called NoSQL. This new kind of NoSQL databases [68] are suited for distributed systems, parallel access, and fast processing of poly-structed huge amounts of data. Contrary to RDBMS, NoSQL databases are scalable and provide better performance rates on Big Data, whilst allowing the users to benefit from a database where the structure of data is irrelevant. Some widely used technologies are MongoDB [69] , Cassandra [70] and HBase [71] [72] (Figure 9).
3.4.2. Technologies for Data Processing
The majority of data processing tools, frameworks or algorithms use the Google “Map Reduce” algorithm which is a programming model for parallel processing of big data sets [73] . These algorithms consist of two distinct tasks: Map and Reduce. Put simply, the Map task finds different keys (tokens) in the data, whilst the reduce task groups the different entries of data according to the existent
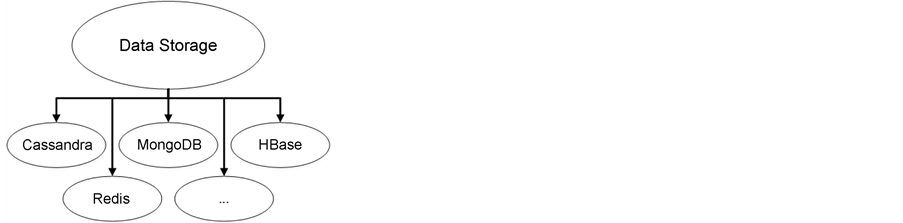
Figure 9. Technologies for data storage.
keys. This algorithm was implemented in the free Apache Hadoop framework, which is one of the older solutions, but up to now a base/core element of many Big Data technologies. Hadoop includes the Hadoop Distributed File System (HDFS) and the Map Reduce Algorithm. Optionally are provided several additional extensions, e.g. for the management of large data sets in a Hadoop-Cluster [74] , Data Warehouse functionalities [75] , real-time functionalities [76] , etc.
Currently several open source data processing tools that provide comprehensive sets of operations to extract knowledge from existing data, are available (see Figure 10). Table 3 presents some of the most widely used free (at least for academic use) or open-source data processing tools. A comparison of these engines can be found in [77] .
Table 4 presents some of the most widely used free (at least for academic use) or open-source Data Processing Engines.
3.4.3. Machine Learning Technologies
Many of the existent frameworks for ML in Big Data are associated with data processing engines [88] , but, the majority of ML frameworks (see Figure 11) can
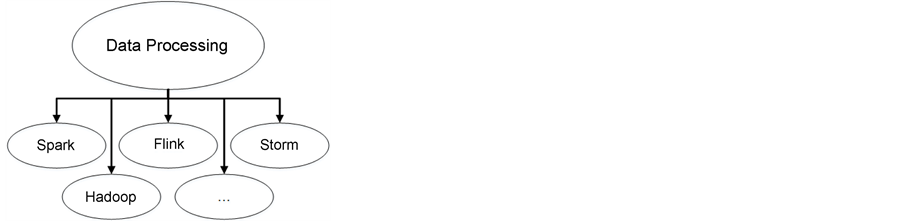
Figure 10. Technologies for data processing.
Table 3. Free or/and open-source data processing tools.
be used with several data processing engines, even though some are limited due to language limitations. Table 5 presents some of the most widely used free (at least for academic use) or open-source Machine Learning frameworks.
Another technology which should be also mentioned is MLbase [92] , which is one of the very first attempts to develop a framework that is, at the same time, both a Data Processing Engine and a Machine Learning Tool.
4. Use Cases and Exploitation
Potential use cases for Big Data analysis in smart manufacturing ranging from simple data analysis (e.g. to find simple dependencies) up to (fully automatic) optimisation of such systems based knowledge about the systems and defines (KPIs or goals). Figure 12 indicates that there are plenty use cases for Big Data analysis in (smart) manufacturing, described in Table 6.
Table 6 describes a selection of potential use cases for Big Data analysis in smart manufacturing.
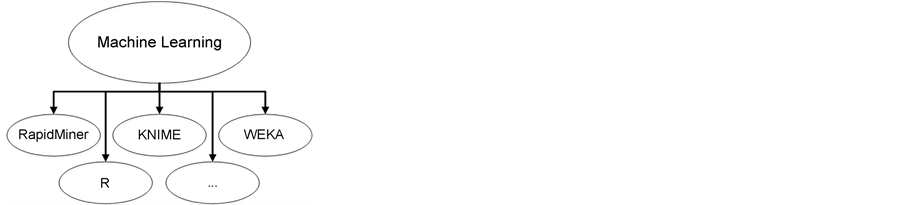
Figure 11. Machine learning frameworks.
Table 4. Data processing engines.
Table 5. Machine learning frameworks.
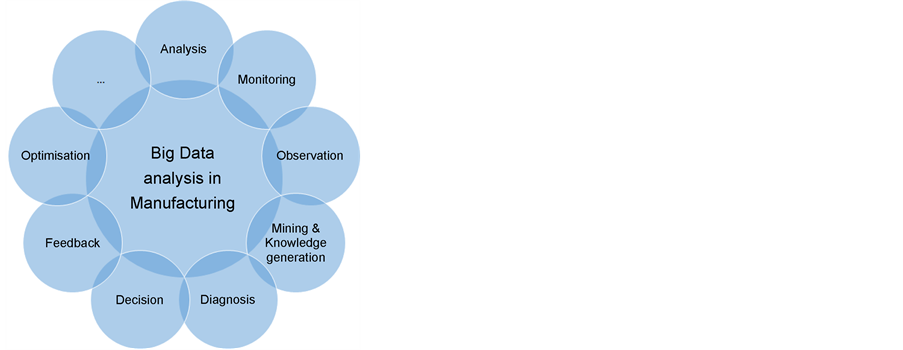
Figure 12. Use cases for big data analysis in smart manufacturing.
Table 6. Big data analysis in manufacturing use cases.
5. Research Challenges
Big Data analysis in smart manufacturing is a newer topic and a list of challenges need to be tackled for a usable realisation of potential Use Cases, as introduced in chapter 4. In the year 2015 Nasser T and Tariq RS described in [93] that there are still several challenges for Big Data analysis in general:
Challenges related to the data: How to handle growing volume, variety and velocity; growing complexity related to veracity (addressing impression, uncertainties, untruths, biases and missing values in the data) and volatility; how to measure the quality of data (completeness, availability, topicality); or, how to discover them in data streams.
Challenges related to processing a Big Data analysis: How to acquire and record data in different data fidelities using smart filters and data reduction techniques; how to extract and clean information through extraction of right data, and put them into a suitable structure for data analysis; how to integrate and aggregate heterogenic data (automatically) in suitable databases; how to process queries, analyse and model heterogeneous, untrustworthy and noisy, inter-related and dynamic data; or, how to interpret and make available analysis outcomes.
Challenges related to the management: How to implement privacy, security and governance requirements.
In addition to these general challenges, in smart manufacturing systems also other challenges occur:
What are useful data sources―Smart manufacturing systems are able to provide several information as described in section 3.2. One challenge is to find methodologies for the identification of useful data for a Big Data analysis. Ways have to be identified that support a data selection.
Real-time Conditions―In these sort of systems, several devices are interacting and emit many sampled data, needed for other connected objects, often in real- time. Therefore, real-time data processing & evaluation is very important also in smart manufacturing systems.
Consideration of Structures―Smart manufacturing systems are logical structures defined in architectures, data models or communication technologies, as described in section 3.1. The consideration of these structures could simplify Big Data analysis processes by methodological support through model-based visualisation, data cluster selection, pattern development, etc. One challenge is to find methodologies and approaches for Big Data analysis tools which provide features considering these structures with a strong support for the data analyst.
6. Future Work
Two upcoming projects are initiated to fill the first parts of the gaps identified in chapter 5. Both works are introduced in in the following two sections.
6.1. Real-Time Big Data Analysis for Industry 4.0
Many manufacturing companies are now trying to take some benefit out of the enormous amount of data they can collect from their production lines with sensors that supervise parameters as heat, speed, energy, product quality, etc. The data collected contains too many potential values, so that they have to be considered. Moreover, the data processing at the shop-floor level needs to be, more than anything else, fast due to real-time requirements of these environments. However, Big Data algorithms may take some time to perform their tasks for assessing the data. This may become an issue when it comes to production lines, where achieving objectives under a certain time span is of the essence. Moreover, existing data analysis algorithms are generic and simply process the data. In order to be able to perform Real-Time Big Data Analysis (RTBDA), one must first define what real-time is, given that it differs according to the field in which it is being applied. Real-time will be regarded to as the “ability to process data as it arrives”, without the need to be stored [94] .
Now that this is set, it is important to state the major issues related with real-time analysis:
1) It is important to guarantee that no bottlenecks occur on the production line or, at least, these are limited to a minimum [95] ―by performing RTBDA, if the analysis of the data is not swift enough, the feedback might not reach the production line when it is required;
2) In order to apply learning methods in RTBDA, the learning mechanisms must be fast enough so that the learned knowledge still makes sense on the current process [96] . Once the knowledge is acquired, it must still be valid in the current context.
Despite the above definition of real-time, data can actually be stored for later analysis. To do so, the access to write/read, to and from a database, needs to be equally as fast. By applying these two concepts, distributed databases with fast Big Data analysis, it may be possible to face real-time issues in a fashionable way.
This section introduces an upcoming work that is set out to solve these issues. An in-depth study needs to be done on the current RTBDA available tools and frameworks, in order to assess its usability in an actual manufacturing environment, where real-time demands are extremely rigorous. However, there is a need; firstly, to determine what real-time is for each of the different sorts of manufacturing out there, given that the result of this study will influence the assessment of the aforementioned frameworks; and secondly, another study that needs to be made, is that of analysing the current data processing algorithms and understanding what alterations need to be made, in order to create algorithms that are suitable for manufacturing environments. These algorithms need to be able to process speed, energy, etc., and provide an output that is comprehensible for the production line.
This project will provide several studies on, namely, RTBDA frameworks, the proper definition of real-time and what frameworks are more fit for smart manufacturing environments and what can/needs to be changed for them to fit in. Moreover, this work aims at creating a generic framework that can be used for any manufacturing area in order to perform RTBDA on their system, also providing optimisation guidelines, along with decent pattern analysis and visualisation. This work is motivated by European funded projects, where the need for an actual Big Data solution for manufacturing is more present than ever.
Contact for this project: Pedro Lima-Monteiro (Author)
6.2. Industry 4.0 Compliant Big Data Observation, Analysis and Diagnosis
Another upcoming project will prove, if SotA Big Data analysis approaches are, in general, useful for observation, analysis and diagnosis of smart manufacturing approaches. It needs to be testified if Big Data analysis methodologies and algorithms are useful in traditional manufacturing approaches; if it is possible to apply traditional Big Data technologies for modular cyber physical manufacturing systems; and if a Big Data analysis implementation is usable in Smart Manufacturing systems based on cyber physical systems, without considering standards.
It is expected that only adapted Big Data analysis approaches are useful for observation, analysis and diagnosis of Smart Manufacturing approaches, if reference architectures covering most important manufacturing standards and architectures, are considered. Further, it is assumed that Big Data analysis methodologies and algorithms are more useful in modular smart manufacturing approaches based on cyber physical components, than in traditional manufacturing systems.
The expected outcome of this work will provide observation, analysis and diagnosis features for smart manufacturing systems based on pattern detection and prediction. Patterns are linkable to pattern matching interpretations as KPIs, wear indicator or maintenance relevant reports, to enable monitoring and predictions useful for further exploitation, as decision support, or as input for self-optimization/aware/maintenance enabled systems. This work will consider proposals from the German strategic program directed towards the year 2020, under the name Industry 4.0 [2] , which aims to enable a horizontal integration of value networks, a vertical integration within a factory, integrated engineering lifecycle management, and to establish the human role as a conductor of a value added network [26] . See more details about this project in [97] .
Contact for this project: Kevin Nagorny (Author).
7. Conclusions
This work presented a review about Big Data analysis in Smart Manufacturing.
Breaking it down, an overall overview about research roadmaps was presented. These roadmaps addressed the topic “Big Data analysis” in Smart Manufacturing. It was also given an emphasis on Europe’s research roadmaps and activities related to this topic which could show that Big Data analysis in Smart Manufacturing is becoming an important topic with a large potential exploitation field.
It was figured out that Big Data analysis in Smart Manufacturing is a big interdisciplinary field covering several topics. The SotA about Smart Manufacturing infrastructures, Big Data (analysis) (in Smart Manufacturing) and technologies could provide insights on involved topics, their current state and outlooks for future activities.
Moreover, it was shown that Big Data analysis in Smart Manufacturing has several use cases with a huge potential exploitation field, but it was also shown that several challenges have still to be addressed for a useful realisation of Big Data analysis solutions in the manufacturing domain, which will partly be tackled in introduced future works.
In summary, it can be said that Big Data is not just a fashion term that will lose its meaning in the next couple of years. The growing amounts of data, the rising complexity of systems, the emerged technological possibilities to analyse big data amounts, and the huge potential value in these data leads to the expectation that Big Data analysis will get more and more in the focus of many areas. Smart Manufacturing is only one of them.
Acknowledgements
This work is partly supported by the ProSEco (Collaborative Environment for Eco-Design of Product-Services and Production Processes Integrating Highly Personalized Innovative Functions) project of European Union’s 7th Framework Program, under the grant agreement No. NMP2-LA-2013-609143. This document does not represent the opinion of the European Community, and the European Community is not responsible for any use that might be made of its content.
Cite this paper
Nagorny, K., Lima-Monteiro, P., Barata, J. and Colombo, A.W. (2017) Big Data Analysis in Smart Manufacturing: A Review. Int. J. Communications, Network and System Sciences, 10, 31-58. https://doi.org/10.4236/ijcns.2017.103003
References
- 1. ECSEL PMB. (2016) 2016 Multi Annual Strategic Research and Innovation Agenda for ECSEL Joint Undertaking.
documents/publications/ECSEL%20MASRIA%202016.pdf>http://www.smart-systems-integration.org/public/
documents/publications/ECSEL%20MASRIA%202016.pdf - 2. Schwab, K. (2016) The Fourth Industrial Revolution. World Economic Forum.
- 3. Chen, M., Mao, S. and Liu, Y. (2014) Big Data: A Survey. Mobile Networks and Applications, 19, 171-209.
https://doi.org/10.1007/s11036-013-0489-0 - 4. Sloman, A. (2007) What’s a Research Roadmap For? Why Do We Need One? How Can We Produce One?
http://www.cs.bham.ac.uk/research/projects/cosy/presentations/munich-roadmap-0701.pdf - 5. ESFRI (2016) ESFRI Roadmap 2016.
http://www.esfri.eu/roadmap-2016 - 6. SPIRE Association (2013) SPIRE ROADMAP.
http://www.spire2030.eu/spire-vision/spire-roadmap - 7. Begeer, R., Berg, A.T., Cohen, A., Colombo, A., Cristau, G., Damm, W., et al. (2016) ARTEMIS Strategic Research Agenda 2016.
https://artemis-ia.eu/publication/download/sra2016.pdf - 8. SPARC (2015) Robotics 2020 Multi-Annual Roadmap—For Robotics in Europe.
-Robotics-Multi-Annual-Roadmap-ICT-2016.pdf>http://sparc-robotics.eu/wp-content/uploads/2014/05/H2020
-Robotics-Multi-Annual-Roadmap-ICT-2016.pdf - 9. EFFRA (2013) FACTORIES OF THE FUTURE—Multi-Annual Roadmap for the Contractual PPP under Horizon 2020.
Roadmap.pdf>http://www.effra.eu/attachments/article/129/Factories%20of%20the%20Future%202020%20
Roadmap.pdf - 10. Reimann, M. and Rückriegel, C. (2017) Priorities and Recommendations for Research and Innovation in Cyber-Physical Systems. Steinbeis-Edition, Stuttgart.
- 11. Taisch, M., Tavola, G. and Carolis, A.D. (2016) European Roadmap for Cyber-Physical Systems in Manufacturing.
http://scorpius-project.eu/ - 12. openMOS Consortium (2016) openMOS—Open Dynamic Manufacturing Operating System for Smart Plug-and-Produce Automation Components.
http://cordis.europa.eu/project/rcn/198382_de.html - 13. SAFIRE Consortium (2017) Cloud-Based Situational Analysis for Factories Providing Real-Time Reconfiguration Services.
http://www.safire-factories.org/ - 14. TOREADOR Consortium (2016) TOREADOR—TrustwOrthy Model-awaRE Analytics Data platfORm.
http://cordis.europa.eu/project/rcn/200253_en.html - 15. LeanBigData Consortium (2016) LeanBigData—Ultra-Scalable and Ultra-Efficient Integrated and Visual Big Data Analytics.
http://cordis.europa.eu/project/rcn/191643_en.html - 16. CADENT Consortium (2016) CADENT—Competitive Advantage for the Data-Driven ENTerprise.
http://cordis.europa.eu/project/rcn/202864_en.html - 17. Jam Consortium (2016) Jam—Enhancing Fuel Efficiency and Reducing Vehicle Maintenance and Downtime Costs, Using Real-Time Data from Vehicle Sensors (IoT) and a Machine Learning Algorithm for Big Data Analysis.
http://cordis.europa.eu/project/rcn/200341_en.html - 18. GDC Consortium (2016) GDC—A Genetic Data CUBE—An Innovative Business Model Applied to Predictive and Prescriptive Analytics, Exploring Big Data and Empowering Cloud-Services and Urgent Computation.
http://cordis.europa.eu/project/rcn/198412_en.html - 19. Golden, B. (2014) As IDC Sees It, Tech’s “Third Platform” Disrupts Everyone.
http://www.cio.com/article/2377568/cloud-computing/as-idc-sees-it-tech-s-third-platform-disrupts-everyone.html - 20. Wang, Y. (2015) China Automotive Industry IT Application Market Forecast 2015-2019.
https://www.idc.com/getdoc.jsp?containerId=CHE40707015 - 21. Colombo, A.W. (2014) Industrial Cloud-based Cyber-physical Systems: The IMC-AESOP Approach: Springer, Berlin.
https://doi.org/10.1007/978-3-319-05624-1 - 22. Lukac, D. (2015) The Fourth ICT-Based Industrial Revolution “Industry 4.0”??? HMI and the case of CAE/CAD Innovation with EPLAN P8. 2015 23rd Telecommunications Forum Telfor (TELFOR), 835-838.
- 23. Rathwell, G. and Ing, P. (2004) Design of enterprise Architectures.
http://www.pera.net/Levels.html - 24. The Open Group (2016) Service Oriented Architecture: What Is SOA?
- 25. Kruchten, P.B. (1995) The 4+ 1 View Model of Architecture. IEEE Software, 12, 42-50.
https://doi.org/10.1109/52.469759 - 26. VDI (2015) Referenzarchitekturmodell Industrie 4.0 (RAMI 4.0).
- 27. Arrowhead Consortium (2016) The Arrowhead Project.
http://www.arrowhead.eu/ - 28. CyProS—Cyber-Physische Produktionssysteme (2013) CyProS—Cyber-Physische
Produktionssysteme. CyProS—Cyber-Physische Produktionssysteme.
http://www.projekt-cypros.de/ - 29. Ramparany, F., Marquez, F.G., Soriano, J. and Elsaleh, T. (2014) Handling Smart Environment Devices, Data and Services at the Semantic Level with the FI-WARE Core Platform. 2014 IEEE International Conference on Big Data (Big Data), 2014, 14-20.
https://doi.org/10.1109/BigData.2014.7004417 - 30. DIN SPEC 91345:2016-04 (2016) Reference Architecture Model Industrie 4.0 (RAMI4.0).
http://www.beuth.de/de/technische-regel/din-spec-91345/250940128 - 31. Wu, X., Zhu, X., Wu, G.-Q. and Ding, W. (2014) Data Mining with Big Data. IEEE Transactions on Knowledge and Data Engineering, 26, 97-107.
https://doi.org/10.1109/TKDE.2013.109 - 32. University Alliance. What Is Big Data?
http://www.villanovau.com/resources/bi/what-is-big-data/ - 33. ElMaraghy, H., Lee, J., Kao, H.-A. and Yang, S. (2014) Product Services Systems and Value Creation. Proceedings of the 6th CIRP Conference on Industrial Product-Service Systems Service Innovation and Smart Analytics for Industry 4.0 and Big Data Environment. Procedia CIRP, 16, 3-8.
https://doi.org/10.1016/j.procir.2014.02.001 - 34. Luckenbach, T., Stackowiak, R., Licht, A. and Mantha, V. (2015) ORACLE—Improving Manufacturing Performance with Big Data—Architect’s Guide and Reference Architecture Introduction.
http://www.oracle.com/us/technologies/big-data/big-data-manufacturing-2511058.pdf - 35. Weps, W. (2016) Webinar: Manufacturing Analytics in der Umsetzung.
https://www.bosch-si.com/de/newsroom/events/veranstaltungen-72384.html - 36. Bloem, J., Doorn, M.V., Duivestein, S., Excoffier, D., Maas, R. and Ommeren, E.V. (2014) The Fourth Industrial Revolution—Things to Tighten the Link between IT and OT. Sogeti VINT2014.
- 37. Labrou, Y. and Finin, T. (1999) Yahoo! As an Ontology: Using Yahoo! Categories to Describe Documents. Proceedings of the Eighth International Conference on Information and Knowledge Management, Kansas City, 2-6 November 1999, 180-187.
https://doi.org/10.1145/319950.319976 - 38. Ghemawat, S., Gobioff, H. and Leung, S.-T. (2003) The Google File System. Proceedings of the Nineteenth ACM Symposium on Operating Systems Principles, 29–43.
https://doi.org/10.1145/945445.945450 - 39. Dean, J. and Ghemawat, S. (2008) MapReduce: Simplified Data Processing on Large Clusters. Communications of the ACM, 51, 107-113.
https://doi.org/10.1145/1327452.1327492 - 40. Shearer, C. (2000) The CRISP-DM Model: The New Blueprint for Data Mining. Journal of Data Warehousing, 5, 13-22.
- 41. Manyika, J., Chui, M., Brown, B., Bughin, J., Dobbs, R., Roxburgh, C., et al. (2011) Big Data: The Next Frontier for Innovation, Competition, and Productivity.
- 42. Morik, K. (2008) Der CRISP-DM Prozess für Data Mining.
http://www-ai.cs.uni-dortmund.de/LEHRE/VORLESUNGEN/KDD/SS08/02_CRISP_4p.pdf - 43. Umair, S. and Haseeb, Q. (2014) A Comparative Study of Data Mining Process Models (KDD, CRISP-DM and SEMMA). International Journal of Innovation and Applied Studies, 12, 217-222.
- 44. Brath, R. and Jonker, D. (2015) Graph Analysis and Visualization: Discovering Business Opportunity in Linked Data. Wiley, Hoboken.
https://doi.org/10.1002/9781119183662 - 45. Oracle (2016) Oracle Big Data Spatial and Graph—Data Sheet.
http://download.oracle.com/otndocs/products/bigdata-spatialandgraph/bdsg-data-sheet.pdf - 46. Gupta, A. (2016) Graph Analytics for Big Data.
https://www.coursera.org/learn/big-data-graph-analytics - 47. Lohr, S. (2012) The Age of Big Data. The New York Times.
- 48. Beyer, M. (2011) Gartner Says Solving “Big Data” Challenge Involves More Than Just Managing Volumes of Data.
https://www.gartner.com/newsroom/id/1731916 - 49. Grossman, R.L., Kamath, C., Kegelmeyer, P., Kumar, V. and Namburu, R. (2013) Data Mining for Scientific and Engineering Applications. Springer, US.
- 50. Kambatla, K., Kollias, G., Kumar, V. and Grama, A. (2014) Trends in Big Data Analytics. Journal of Parallel and Distributed Computing, 74, 2561-2573.
https://doi.org/10.1016/j.jpdc.2014.01.003 - 51. Valiant, L.G. (1990) A Bridging Model for Parallel Computation. Communications of the ACM, 33, 103-111.
https://doi.org/10.1145/79173.79181 - 52. Malewicz, G., Austern, M.H., Bik, A.J.C., Dehnert, J.C., Horn, I., Leiser, N., et al. (2010) Pregel: A System for Large-Scale Graph Processing. Proceedings of the 2010 ACM SIGMOD International Conference on Management of Data, 135-146.
https://doi.org/10.1145/1807167.1807184 - 53. Martella, C. (2012) Apache Giraph: Distributed Graph Processing in the Cloud. FOSDEM.
- 54. Angles, R. (2012) A Comparison of Current Graph Database Models. 2012 IEEE 28th International Conference on Data Engineering Workshops (ICDEW), Arlington, 1-5 April 2012, 171-177.
https://doi.org/10.1109/ICDEW.2012.31 - 55. Maier, A. (2014) Online Passive Learning of Timed Automata for Cyber-Physical Production Systems. 2014 12th IEEE International Conference on Industrial Informatics (INDIN), July 2014, 60-66.
https://doi.org/10.1109/INDIN.2014.6945484 - 56. Stokic, D., Scholze, S. and Barata, J. (2011) Self-Learning Embedded Services for Integration of Complex, Flexible Production Systems. IECON 2011-37th Annual Conference on IEEE Industrial Electronics Society, Melbourne, 7-10 November 2011, 415-420.
https://doi.org/10.1109/IECON.2011.6119346 - 57. Wang, G., Su, X. and Pan, X. (2012) Computer Aided Visualized Fault Tree Analysis. 2012 Fifth International Symposium on Computational Intelligence and Design (ISCID), 28-29 October 2012, 265-268.
https://doi.org/10.1109/ISCID.2012.74 - 58. Rocha, A.D., Monteiro, P.L. and Barata, J. (2015) An Artificial Immune Systems Based Architecture to Support Diagnoses in Evolvable Production Systems Using Genetic Algorithms as an Evolution Enabler.
- 59. Brookshear, J.G. (1989) Theory of Computation: Formal Languages, Automata, and Complexity. Benjamin-Cummings Publishing Co., Inc., Redwood City.
- 60. Hua, X.L., Gondal, I. and Yaqub, F. (2013) Mobile Agent Based Artificial Immune System for Machine Condition Monitoring. 2013 IEEE 8th Conference on Industrial Electronics and Applications (ICIEA), Melbourne, 19-21 June 2013, 108-113.
- 61. Mohammadi, M., Akbari, A., Raahemi, B., Nassersharif, B. and Asgharian, H. (2013) A Fast Anomaly Detection System Using Probabilistic Artificial Immune Algorithm Capable of Learning New Attacks. Evolutionary Intelligence, 6, 135-156.
https://doi.org/10.1007/s12065-013-0101-3 - 62. Wu, X., Kumar, V., Quinlan, J.R., Ghosh, J., Yang, Q., Motoda, H., et al. (2008) Top 10 Algorithms in Data Mining. Knowledge and Information Systems, 14, 1-37.
https://doi.org/10.1007/s10115-007-0114-2 - 63. Garshol, L.M. (2012) Introduction to Machine Learning.
http://de.slideshare.net/larsga/introduction-to-big-datamachine-learning - 64. Marvuglia, A. and Messineo, A. (2012) Monitoring of Wind Farms’ Power Curves Using Machine Learning Techniques.Applied Energy, 98, 574-583.
https://doi.org/10.1016/j.apenergy.2012.04.037 - 65. Bange, C. and Grosser, T. (2012) Big Data—BI der nachsten Generation.
http://www.computerwoche.de/a/big-data-bi-der-naechsten-generation - 66. Ranjan, V. (2010) A Comparative Study between ETL (Extract, Transform, Load) and ELT (Extract, Load and Transform) Approach for Loading Data into Data Warehouse.
http://www.ecst.csuchico.edu/~juliano/csci693/Presentations/2009w/Materials/Ranjan/Ranjan.pdf - 67. Michalski, R.S., Carbonell, J.G. and Mitchell, T.M. (2013) Machine Learning: An Artificial Intelligence Approach. Springer Science & Business Media, Berlin.
- 68. Freitag, D. (2000) Machine Learning for Information Extraction in Informal Domains. Machine Learning, 39, 169-202.
https://doi.org/10.1023/A:1007601113994 - 69. Andrieu, C., Freitas, N.D., Doucet, A. and Jordan, M.I. (2003) An Introduction to MCMC for Machine Learning. Machine Learning, 50, 5-43.
https://doi.org/10.1023/A:1020281327116 - 70. Sebastiani, F. (2002) Machine Learning in Automated Text Categorization. ACM Computing Surveys, 34, 1-47.
https://doi.org/10.1145/505282.505283 - 71. Vora, M.N. (2011) Hadoop-HBase for Large-Scale Data. 2011 International Conference on Computer Science and Network Technology (ICCSNT), Harbin, 24 December 2011, 601-605.
https://doi.org/10.1109/ICCSNT.2011.6182030 - 72. Jung, M.G., Youn, S.A., Bae, J. and Choi, Y.L. (2015) A Study on Data Input and Output Performance Comparison of MongoDB and PostgreSQL in the Big Data Environment. 2015 8th International Conference on Database Theory and Application (DTA), 25-28 November 2015, 14-17.
https://doi.org/10.1109/DTA.2015.14 - 73. Moniruzzaman, A.B.M. and Hossain, S.A. (2013) NoSQL Database: New Era of Databases for Big Data Analytics—Classification, Characteristics and Comparison. arXiv:1307.0191 [cs]
- 74. Chodorow, K. (2013) MongoDB: The Definitive Guide. O’Reilly Media, Inc.
- 75. Wang, G. and Tang, J. (2012) The NoSQL Principles and Basic Application of Cassandra Model. 2012 International Conference on Computer Science Service System (CSSS), 2012, 1332-1335.
https://doi.org/10.1109/CSSS.2012.336 - 76. George, L. (2011) HBase: The Definitive Guide. O'Reilly Media, Inc.
- 77. Lima-Monteiro, P., Parreira-Rocha, M., Rocha, A.D. and Oliveira, J.B. (2017) Big Data Analysis to Ease Interconnectivity in Industry 4.0—A Smart Factory Perspective. In: Service Orientation in Holonic and Multi-Agent Manufacturing, Springer, Berlin, 237-245.
https://doi.org/10.1007/978-3-319-51100-9_21 - 78. Ristoski, P., Bizer, C. and Paulheim, H. (2015) Mining the Web of Linked Data with RapidMiner. Web Semantics: Science, Services and Agents on the World Wide Web, 35, 142-151.
https://doi.org/10.1016/j.websem.2015.06.004 - 79. Kart, L., Herschel, G., Linden, A. and Hare, J. (2016) Magic Quadrant for Advanced Analytics Platforms.
https://www.gartner.com/doc/reprints?id=1-2YEIILW&ct=160210&st=sb - 80. Berthold, M.R., Cebron, N., Dill, F., Gabriel, T.R., Kotter, T., Meinl, T., et al. (2009), KNIME—The Konstanz Information Miner: Version 2.0 and Beyond. SIGKDD Explorations Newsletter, 11, 26-31.
https://doi.org/10.1145/1656274.1656280 - 81. Demsar, J., Curk, T., Erjavec, A., Gorup, C., Hocevar, T., Milutinovic, M., et al., (2013) Orange: Data Mining Toolbox in Python. Journal of Machine Learning Research, 14, 2349-2353.
- 82. Hall, M., Frank, E., Holmes, G., Pfahringer, B., Reutemann, P. and Witten, I.H. (2009) The WEKA Data Mining Software: An Update. ACM SIGKDD Explorations Newsletter, 11, 10-18.
https://doi.org/10.1145/1656274.1656278 - 83. Tuimala, D.J. and Kallio, A. (2013) R, Programming Language. In: Dubitzky, W., Wolkenhauer, O., Cho, K.-H. and Yokota, H., Eds., Encyclopedia of Systems Biology, Springer, New York, 1809-1811.
https://doi.org/10.1007/978-1-4419-9863-7_619 - 84. Williams, G.J., et al. (2009) Rattle: A Data Mining GUI for R. The R Journal, 1, 45-55.
- 85. Shanahan, J.G. and Dai, L. (2015) Large Scale Distributed Data Science Using Apache Spark. 2323–2324.
https://doi.org/10.1145/2783258.2789993 - 86. The Apache Software Foundation (2016) Apache Flink.
https://flink.apache.org/ - 87. Alexandrov, A., Bergmann, R., Ewen, S., Freytag, J.-C., Hueske, F., Heise, A., et al., (2014) The Stratosphere Platform for Big Data Analytics. The VLDB Journal, 23, 939-964.
https://doi.org/10.1007/s00778-014-0357-y - 88. Marz, N. (2014) History of Apache Storm and Lessons Learned. Thoughts from the Red Planet.
- 89. Zaharia, M., Chowdhury, M., Franklin, M.J., Shenker, S. and Stoica, I. (2010) Spark: Cluster Computing with Working Sets. HotCloud, 10, 10.
- 90. Jovanovic, Z., Bacevic, R., Markovic, R. and Randjic, S. (2015) Android Application for Observing Data Streams from Built-In Sensors Using RxJava. Telecommunications Forum Telfor (℡FOR), 918-921.
https://doi.org/10.1109/telfor.2015.7377615 - 91. Rocha, A.D., Peres, R. and Barata, J. (2015) An Agent Based Monitoring Architecture for Plug and Produce Based Manufacturing Systems. 2015 IEEE 13th International Conference on Industrial Informatics (INDIN), Cambridge, 22-24 July 2015, 1318-1323.
https://doi.org/10.1109/INDIN.2015.7281926 - 92. Landset, S., Khoshgoftaar, T.M., Richter, A.N. and Hasanin, T. (2015) A Survey of Open Source Tools for Machine Learning with Big Data in the Hadoop Ecosystem. Journal of Big Data, 2, 1-36.
https://doi.org/10.1186/s40537-015-0032-1 - 93. Nasser, T. and Tariq, R. (2015) Big Data Challenges. Journal of Computer Engineering & Information Technology, 9307, 2.
- 94. Eluri, V.R., Ramesh, M., Al-Jabri, A.S.M. and Jane, M. (2016) A Comparative Study of Various Clustering Techniques on Big Data Sets Using Apache Mahout. 2016 3rd MEC International Conference on Big Data and Smart City (ICBDSC), Muscat, 15-16 March 2016, 1-4.
https://doi.org/10.1109/ICBDSC.2016.7460397 - 95. De Francisci Morales, G. (2013) SAMOA: A Platform for Mining Big Data Streams. Proceedings of the 2013 International Workshop on Data-Intensive Scalable Computing Systems, Denver, 18 November 2013, 777-778.
https://doi.org/10.1145/2487788.2488042 - 96. Condie, T., Mineiro, P., Polyzotis, N. and Weimer, M. (2013) Machine Learning for Big Data. SIGMOD Conference, 2013, 939-942.
- 97. Nagorny, K., Scholze, S., Barata, J. and Colombo, A.W. (2016) An Approach for Implementing ISA 95-Compliant Big Data Observation, Analysis and Diagnosis Features in Industry 4.0 Vision Following Manufacturing Systems. Technological Innovation for Cyber-Physical Systems: 7th IFIP WG 5.5/SOCOLNET Advanced Doctoral Conference on Computing, Electrical and Industrial Systems, DoCEIS 2016, Costa de Caparica, Portugal, 11-13 April 2016, 116-123.