Int'l J. of Communications, Network and System Sciences
Vol.3 No.2(2010), Article ID:1263,9 pages DOI:10.4236/ijcns.2010.32016
The Downlink Adjacent Interference for Low Earth Orbiting (LEO) Search and Rescue Satellites
1Post and Telecommunication of Kosovo (PTK), Dardania, Prishtina, Kosovo
2Fulbright Scholar Researcher at NOAA, Maryland, USA
3National Oceanic and Atmospheric Administration (NOAA), NOAA Satellite Operational Facility (NSOF),Maryland, USA
Email: Shkelzen.cakaj@ptkonline.com, Shkelzen.cakaj@fulbrightmail.org, Mickey.Fitzmaurice@noaa.gov, Jesse.Reich@noaa.gov, Eric.Foster@noaa.gov
Received November 19, 2009; revised December 20, 2009; accepted January 12, 2010
Keywords: LEO, LUT, Beacon, Doppler, Satellite, Adjacent, Interference
Abstract
NOAA (National Oceanic and Atmospheric Administration) - LEO environmental satellites provide continuous coverage of Earth, supplying high-resolution global meteorological, oceanic and space observation data. In addition, these satellites are part of the international COSPAS – SARSAT program, which aides search and rescue teams worldwide. The USA segment, referred to as SARSAT (Search and Rescue Satellite Aided Tracking) system, is designed to provide distress alert and location data to assist on search and rescue operations. SARSAT locates distress beacons (406MHz) activated at distress locations. The system calculates a location of the distress event using Doppler processing techniques. Processed data is continuously retransmitted through the SARSAT downlink to Local User Terminals (LUT) when satellites are in view. The downlink adjacent interference is expected when two satellites operate in close proximity and share the same frequency. The downlinks of all SARSAT LEO satellites use the same 1544.5 MHz frequency. In cases where the satellites are within the main lobe of the local user terminal antenna, transmissions from adjacent satellites act as interference to one-another, effectively decreasing the signal-to-noise ratio of the desired downlink. This can result in missed distress beacon bursts or no stored solutions received at the LUT, consequently no data is provided about a distress location. Analysis on interference prediction, impacts on system operation and recommendations for mitigating interference periods where the duration may be significant, are presented in this paper.
1. Introduction
COSPAS-SARSAT is an international, humanitarian satellite based search and rescue system which operates continuously, detecting and locating transmissions from emergency beacons carried by ships, aircrafts and individuals. This system was originally sponsored by Canada, France, the former Soviet Union and the USA [1,2]. The success of the rescue operation depends crucially on accurate rapid determination of the distress location. The accuracy of location determination and the time required to alert rescue authorities depends on the communication reliability between the LUTs and the satellites [3,4]. The communication link is established when the satellite flies within a LUT’s visibility. This ‘fly-over’ is called a satellite pass. Communication reliability during a satellite pass may be degraded when satellites sharing the same downlink frequency are adjacent and interfere to each other, consequently degrading the received signal at the LUT [5,6].
A general overview of COSPAS-SARSAT search and rescue system is briefly presented. Since interference analysis relate to the SARSAT system, the space and ground segment are described in greater detail. Finally, consideration of the LUT antenna gain patternsatellite path geometry and separation distance between adjacent satellites are described in the prediction of significant periods of interference. Interference mitigation of significant duration, with attached measurement results is also presented.
2. COSPAS-SARSAT System Concept
The basic COSPAS - SARSAT concept is illustrated in Figure 1 [1,2]. The operation of this system is further described.
1) In situations of distress anywhere in the world, when and where lives are at risk, the emergency beacons are activated manually or automatically.
2) Emergency alerts received by the satellites are retransmitted to 45 automated (unstaffed) ground stations worldwide, with several more becoming operational each year [7,8]. These satellite ground stations are called Local User Terminals.
3) Alerts are routed to a Mission Control Center (MCC) in the country that operates LUT. Routed alerts include beacon location computed at the LUT received by one of the system Low - Earth - Orbiting (LEO) satellites.
4) After validation processing (based on Doppler Effect) alerts are relayed depending on beacon location or country of registration to either another MCC or to appropriate Rescue Coordination Center (RCC) [1,2].
3. SARSAT System
The USA portion of COSPAS-SARSAT system is operated by NOAA. NOAA’s environmental satellites carry SARSAT packages. The Mission Control Center (USMCC) is located in Suitland, Maryland [1]. US RCCs are operated by the US Coast Guard and the US Air Force [1,2]. The SARSAT system uses two different types of satellites: polar-orbiting satellites in low Earth orbit (LEO) and satellites in geosynchronous orbit (GEO). (Note: The downlinks for LEO and GEO are orthogonally polarized, LEO-Left Hand Circularly Polarized, GEO-Right Hand Circularly Polarized, providing about 16-20 dB of isolation.) It is shown that the supplemental use of both reduces the time delay and increases coverage area. Only LEOs adjacent interference is discussed [6].
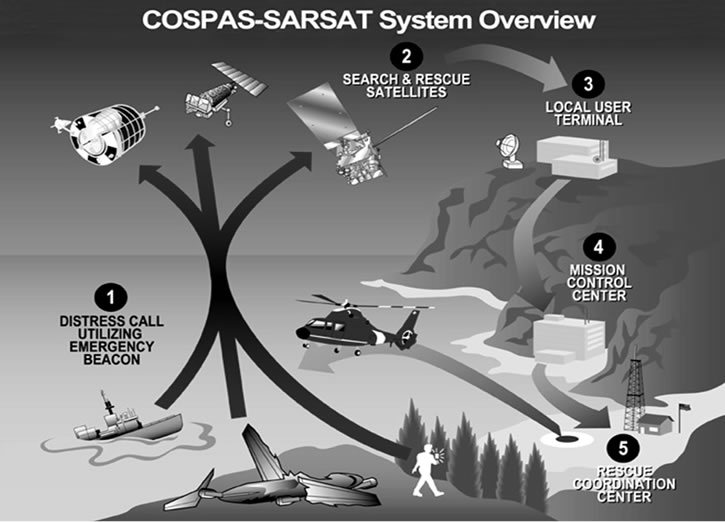
Figure 1. COPSAS-SARSAT concept.
3.1. Space Segment
The SARSAT satellite constellation is presented in Figure 2 [1]. While GEO satellites continually view large areas of the Earth, and can provide immediate alerting and identification of 406 MHz beacons, there is no Doppler shift of the received beacon carrier since the geostationary satellites are by definition stationary with respect to the Earth, [9–11]. Another issue is that GEOs can not cover the Polar Regions adequately since the antenna footprint is limited to latitudes of about 75º- 80º [12–14].
LEO satellites in polar orbits cover these potential distress regions and allow for Doppler shift processing to be applied in distress alert location determination. The polar-orbiting approach with on-board memory provided by the SARP (Search and Rescue Processor) enables each satellite to provide complete coverage of any point on the Earth twice a day. Polar-orbiting LEO satellites are in Sun synchronized orbits [15].
For search and rescue missions, LEO satellites use two modes of operation:
Repeater mode (Local)–Search and Rescue Repeater (SARR) immediately retransmits received beacon signals to any LUT in the satellite’s footprint. This mode is possible when the spacecraft is visible to both the beacon
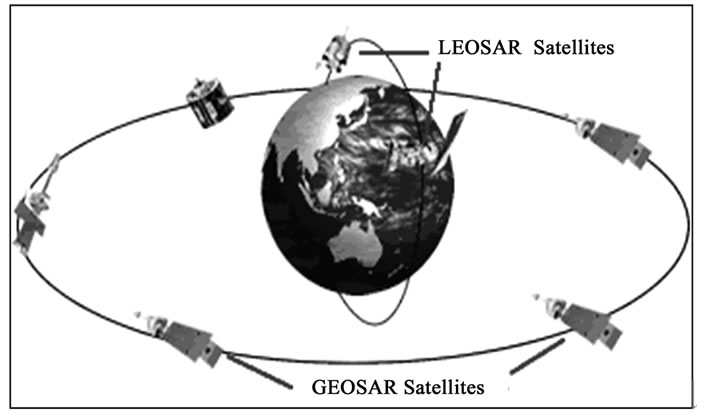
Figure 2. SARSAT system.
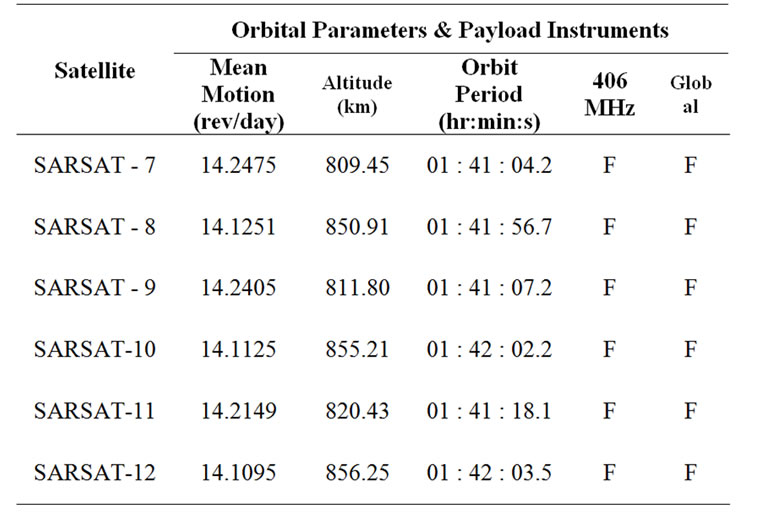
Table 1. SARSAT LEOSAR status.
and ground station simultaneously.
Store and forward mode (Global)–is applied when the spacecraft does not see the beacon and ground station simultaneously. The on board Search and Rescue Processor (SARP) receives and records search and rescue beacon transmissions and repeatedly retransmits them as part of a 3 minute continuously cyclical memory dump to LUTs when they are visible as the satellite orbits the Earth. This provides true global coverage [1,2].
Both modes, utilize a satellite downlink carrier frequency of 1544.5 MHz transmit LHCP (Left Hand Circular Polarization) to transmit to any LUT in view. Table 1 presents the orbital parameters and the status of SARSAT LEOSAR payload instruments as of October 2009. Global is related to global coverage, and F means Fully Operational [9–11].
3.2. Ground Segment
Receive-only ground stations, specifically designed to track the search and rescue satellites as they pass across the sky are called Local User Terminals. The LUTs are fully automated and completely unmanned at all times [8]. There are two-types of LUTs: Low Earth Orbiting LUTs (LEOLUT) and Geostationary LUTs (GEOLUT). These LUTs and their corresponding MCC (Mission Control Center) to whom these LUTs are interconnected, creates the US SARSAT ground segment. The distress signal is received on the satellite uplink and then it is transmitted to LEOLUTs by downlink. The beacon location is random and LUT locations are fixed and known. The main functions of a LEOLUT are:
• Track the SARSAT satellites
• Recover beacon signals
• Perform error checking
• Perform Doppler processing
• Send alert to Mission Control Center The LEOLUT system consists of a satellite receive antenna, a digital processing system, an operator display and the software which implements all of the control, monitoring and processing functions. Since LEOLUTs track satellites in low orbits which move quickly relative to a fixed point on Earth, the antenna includes an Antenna Control Unit (ACU) and a tracking mount mechanism with azimuth range of 360º and elevation up to 90º. The appropriate antenna software controls the pointing of the antenna. This ensures that antenna tracks the satellite as it passes over the LEOLUT.
When a satellite receives a beacon signal from a distress location, the Search and Rescue Processor (SARP) on board the LEO satellite performs Doppler processing and generates an entry into the 2.4 kb/s Processed Data Stream (pds) that is continuously “dumped” on 3 minute intervals to any LUT in view of the satellite’s downlink footprint. LEOLUT software accepts the satellite’s downlink data stream, then decodes and extracts beacon data messages. From each satellite pass taken by the LEOLUT, software selects data from each detected beacon and validates time, frequency and message content. Data from each pass, and for each beacon identification number, is then passed to the solution processing software. The solution processing software determines an optimum location based on a Doppler frequency curve. The best curves are used to estimate the beacon location. If the curve cannot be determined, the solution is declared “unlocated”. Once a signal is processed at the LUT, then the data stream which provides solution and status data is transmitted through a fully automatic communication link to the mission control center (MCC) that operates that particular LUT.
A mission control center (MCC) serves as the hub to collect, store, and sort alert data from other LUTs and other MCCs. The main function of an MCC is to distribute alert data to RCCs and other MCCs. The United States Mission Control Center (USMCC) in Suitland, MD serves as the focal point of the U.S. SARSAT program. NOAA operates 11 LEOLUTs in six locations, as presented in Table 2. These multiple LEOLUTs provide total system redundancy and allow for a maximization of satellite tracking within US Areas of Responsibility (AOR). There are two LEOLUTs in each of the following locations, except for Maryland. Two independent functionally and physically identical systems manufactured by “EMS Technologies” (a Canadian company), are implemented in:
• Miami, Florida (FL1&FL2)
• Vandenberg, California (CA1&CA2)
• Fairbanks, Alaska (AL1&AL2)
• Wahiawa, Hawaii (HI1&HI2)
• Andersen, Guam (GU1&GU2)
• Suitland, Maryland (LEO Support Equipment)
Since each LUT operates independently, they are denoted as 1 and 2. The LEOLUT in Maryland is used as support equipment for tests, software and hardware upgrades and analysis.
4. Downlink Interference
The adjacent satellite interference manifests when two
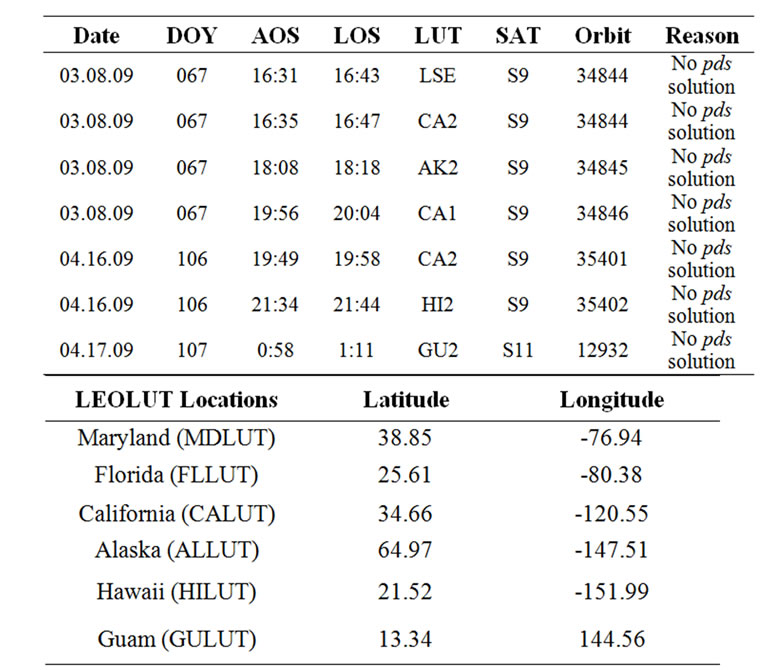
Table 2. LEOLUTs coordinates.
satellites sharing the same downlink frequency are located close to each other from the perspective of the receiving ground station antenna, as presented in Figure 3 for LUTs of U.S. SARSAT ground segment.
The downlink of all SARSAT LEO satellites uses the same 1544.5 MHz frequency. If the transmitted EIRP from each satellite is similar, for two satellites close to each other, the two signals will act as interference to each other, severely degrading the received signal [16].
Downlink interference between S11 and S9 was documented by France in March and April 2009, when S9 and S11 were close to each other. The 8 March 2009 occurrence of interference between these two satellites caused four passes, over a period of three orbits, which produced no pds solutions. The 16 April 2009 occurrence of interference caused three passes with no pds solutions over a period of three orbits, presented in Table 3. But, the number of no pds solutions alone cannot accurately gauge the amount of interference in the downlink. It is a significant variability in the number pds bursts received by the satellite during each orbit depending on the path.
The received carrier frequency provides a useful measure of the interference level. The carrier frequency of the transmitter is 1544.5 MHz, but the relative velocity between the satellite and LUT causes a Doppler shift in the received frequency, and a plot over time shows the char-
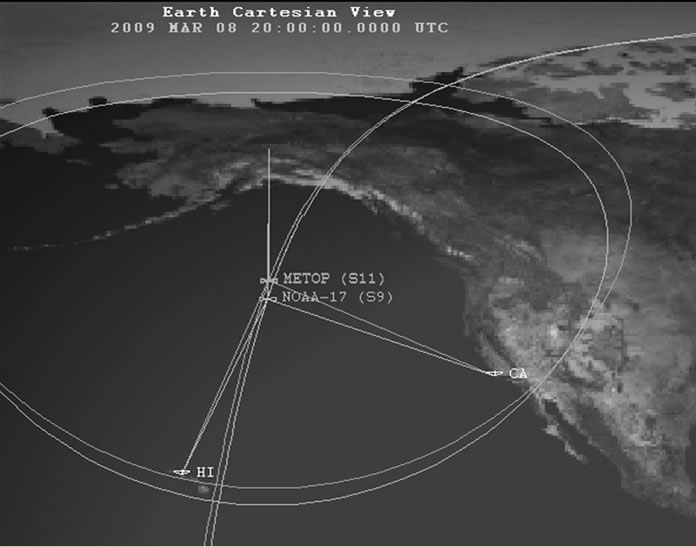
Figure 3. Adjacent satellites seen from the ground station.
Table 3. Passes affected by interference.
acteristic Doppler curve of a LEO satellite. As the orbital positions of the two satellites converge, so do their relative velocities to the LUT and Doppler curves [11].
The implemented software enables prediction of Doppler curves, as presented in Figure 4 for satellites S9 and S11 having interference conflict with each other. Slight differences in relative velocity between the two interfering satellites cause two distinct curves of carrier frequency. When the difference in relative velocity and angular separation is minimal, the Doppler curves of the carrier frequency become almost identical. In Figure 4, the angular separation of satellites viewed from LUT’s antenna is presented on the right axis. Figure 5 shows the real time received carrier frequency for Florida-1 and Florida-2 LEOLUTs. Florida-1 is tracking S9 and Florida-2 is tracking S11. When receiver locks on the interfering signal, a jump in the received carrier frequency is seen. These interruptions in carrier lock results in loss of downlink capability and can visually show when interference has occurred. Figure 5 shows that for the most of the pass, each LUT is successfully locked on its desired signal. Two vertical lines show the period of interference. This can result in missed bursts or no solutions received at all. The similarity of predicted and real time recorded curves is obvious.
4.1. Adjacent Satellites
Visual inspection shows pairs of satellites with similar
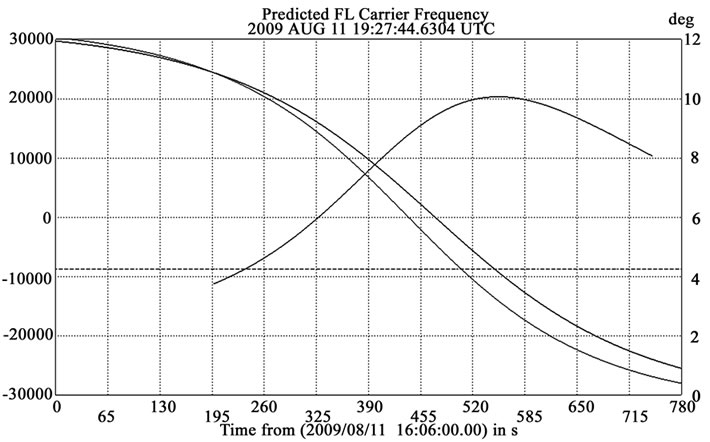
Figure 4. Predicted doppler curves.
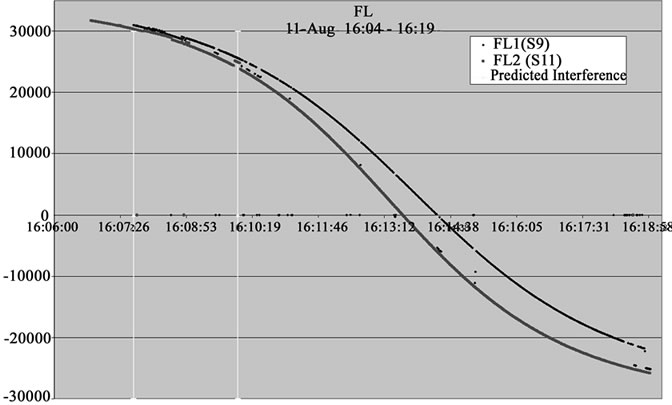
Figure 5. Real time doppler curves.
ground tracks. Kepler elements or the two line orbital elements can be used to analyze the in-track separation. The nearly identical orbital periods and ground tracks will result in long durations where the satellites are in close proximity of each other. In the case where the satellites are in close proximity within the main lobe of the receiving ground station antenna, long periods of interference between the two satellites can manifest itself. During these periods, the downlink of the adjacent satellites may be severely impaired [6]. Three pairs of operational SARSAT satellites are susceptible to this interference condition: S10/S12, S9/S11, and S7/S8 are identified and presented in Table 4 with their respective orbital periods and differences between them.
The small difference in orbital periods of the S10/S12 pair is particularly concerning. The Orbit repeat cycle indicates the number of orbits that satellite should pass through to achieve the same position relative to the adjacent satellite and to the fixed ground station. Mathe
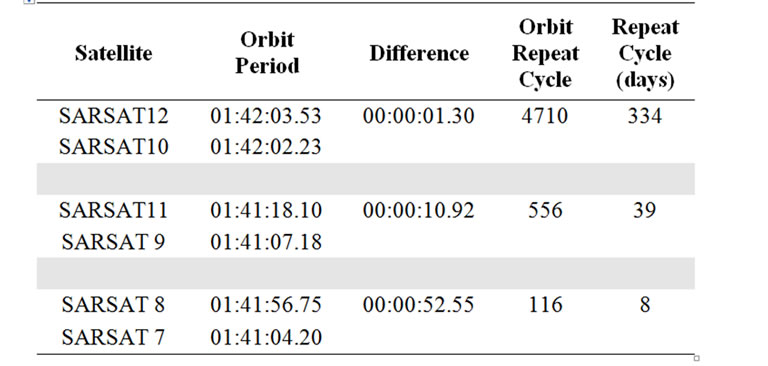
Table 4. SARSAT adjacent satellites.
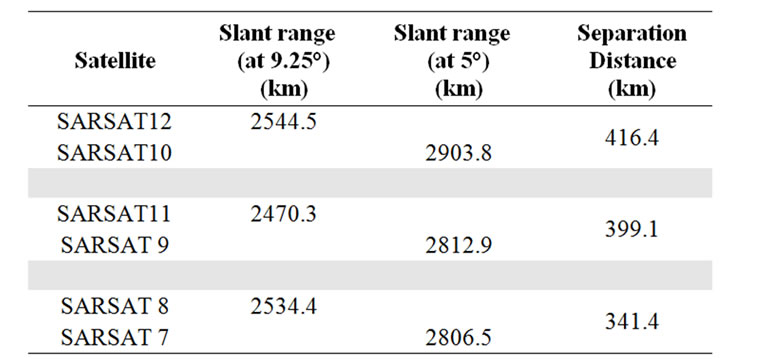
Table 5. SARSAT adjacent satellites.
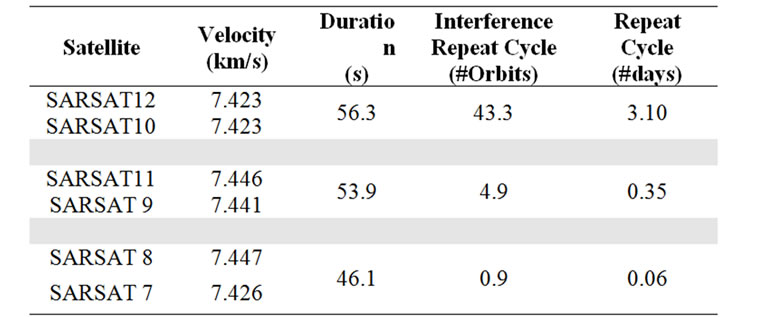
Table 6. SARSAT adjacent satellites.
matically, Orbit repeat cycle is the ratio of orbit period and orbital difference, as calculated and presented in Table 4. Further, for this cycle to be expressed in days, it should be divided by the mean motion from Table 1. The USA documented that the launch of S12 (NOAA-19) into an orbital plane similar to S10 (NOAA-18), and with nearly identical orbital periods, created long periods of adjacent interference. The first period of extended interference occurred from 15 September 2009 to 20 September 2009.
4.2. Duration of Interference
To determine the duration of the interference periods, one must find the minimal angular separation between satellites as seen from the ground station, when interference occurs. This is highly dependent on the gain pattern and pointing accuracy of the LUT antenna. For a typical LEOLUT antenna gain pattern, the -3dB (half power) beamwidth is found to be  4.25°. This beamwidth represents the necessary angular separation to prevent undesired signals from being highly amplified. As the angular separation increases, the gain of the interfering source decreases. Since the distance between the two satellites is relatively constant during a singular pass, it can be seen that the apparent angular separation is greatest when the satellites are at their maximum elevation (closest approach) [17]. Thus, minimum angular separation occurs when the satellites are at minimum elevation. Thus, the cases with low elevation are of interest from the interference aspect.
Let us consider a LUT with antenna aperture of  4.25. This antenna is tracking a satellite, which is moving ahead relative to another satellite which is seen at minimum elevation above the horizon (5°), as shown in Figure 6.
These adjacent satellites, seen at low elevation, and with a very low separation angle, have great potential to interfere each other. The slant range is calculated for elevations of 9.25° and 5° (5° horizon with 4.25° separa-
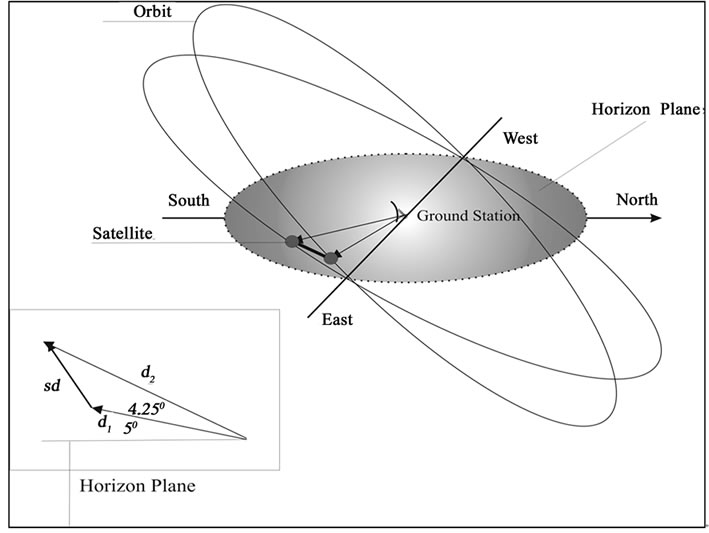
Figure 6. Adjacent satellites under beamwidth angle.
tion) from a ground station. Spatially the separation angle is the spherical angle from 0° to 4.25°. The 0° point is on the desired satellite, and 4.25° point is the -3dB interference point, consequently it is the largest possible distance for interference from another satellite. The general formula for the slant range  under elevation
  is [12–14]:
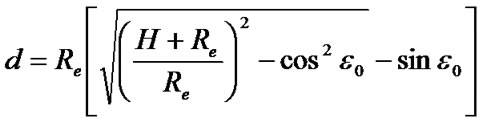 (1)
(1)
where,  km is Earth radius and H is orbital altitude. The separation distance
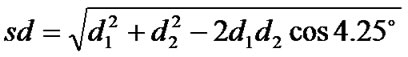
  can then be determined using a small angle approximation and applying cosines theorem, as:
 (2)
(2)
where  is the slant range of pointed satellite from the ground station and
  is the slant range of the adjacent satellite potential to interfere. Altitude H of each satellite is in Table 1. The slant ranges and separation distances are presented in Table 5. For more exact calculations these separation distances should be multiplied by cosines of separation angle (projection of separation distance in its own orbit), which for too low angles can be considered as 1. This separation distance when interference may occur, and the difference in orbital periods can then be used to find the duration of possible interference. Considering that these satellites are always moving with a particular velocity
 , the question is how long they can be together within a separation angle of 4.25°. This represents the Duration of possible interference. The frequency of these events and their duration relative to the fixed ground stations depend on the difference of orbital period times (Table 4). The ratio of interference time duration to time difference in orbital periods represents Interference repeat cycle per orbit. This cycle is expressed in days when divided by mean motion (Table 1). Considering separation distance, predictions for the interference repeat cycle of satellite pairs are listed in Table 6.
In general, the difference in orbital period between the two satellites will dictate the duration and repeatability of interference intervals. From Table 6 it is obvious that the S10/S12 pair experiences the highest interference repeat cycle, consequently the longest possible interference disturbance, because of too close orbital periods. The S7/S8 pair is the least experiences with interference.
5. Downlink Interference Mitigation
As another approach, and for results comparison, a satellite orbit analysis program using the known LUT antenna gain pattern is applied. Again, when the both satellites are within -3dB beamwidth (separation angle of 4.25°)
Table 7. Timeline of significant future interference events.
from the point of view of the LUT, it was determined that interference is possible.
5.1. Timelines and Events
Considering events on March and April from Table 3, a period from May to December is analyzed. The beginning of the period of possible interference was designated as the first pass at a USA LUT where S10 and S12 would be within 4.25° of each other at any point during the pass. The predicted periods of interference were generated by a satellite orbital analysis program. Table 7 shows the timeline of these significant events.
The duration of the S10/S12 interference is of particular concern, and has been verified through this secondary method to be about 3 days (See Table 6 and Table 7, approximately the same results from mathematical analysis and simulation results). The duration of S9/S11 interference periods decreases as predictions are made farther in the future. Periods of S8/S7 interference are approximately one orbit in duration repeating every 8 days, and therefore, are not listed.
Thus, considering antenna pattern and satellite pass geometry, analytical models can be built to predict the time and duration of interference based on the angular separation between the two satellites [18]. The interference mitigation efforts should be performed if operational impacts become severe. Mitigation efforts must be relatively benign. Canada developed a procedure to interrupt RF transmission from the satellite with a minimal chance of irrecoverable failure. The USA executed this procedure when the operational impacts of interference became evident. The USA analyzed the downlink characteristics during the periods both before and after the mitigation actions were taken. This process is further described.
5.2. Interference Records
Satellite pair S10/S12, as the worst case of adjacent interference is further analyzed. The Canadian procedure to interrupt the downlink RF transmission from the satellite is considered to be applied as a method to mitigate adjacent satellite interference. The turnoff transmission was planned for S10. Further plots presented in Figure 7, Figure 8, Figure 9 and Figure 10 show various passes, in chronological order, before the turnoff of the downlink of S10. The received carrier frequency is shown on the left axis, and modulation index mean and RMS (Route Mean Square) on the right axis. Modulation index indicates the quantity by how much the modulated variable varies around its unmodulated level. Considering downlink phase modulation, this index relates to the variations in the phase of the carrier signal.
Figure 7 shows the case with relatively high maximal elevation of 76º and Figure 8, the case with medium maximal elevation of 36º. Figure 7 shows the interference during AOS (Acquisition of Satellite), as bit and frame sync is being established. Frequency jumps in the downlink carrier can be seen in the upper left corner of Figure 7, and are reflected by a high mean modulation index at the same time. Further, as the satellite moves toward higher elevation there is no interference (medium part of figure) and then again there is interference near LOS (Loss of Satellite). In Figure 8 it is very expressive modulation index and frequency jump during the loss of satellite. Figure 9 and Figure 10; show the cases with low maximal elevation, respectively of 12º and 9º respectively. The jump in frequency is present in both, particularly under 9º.
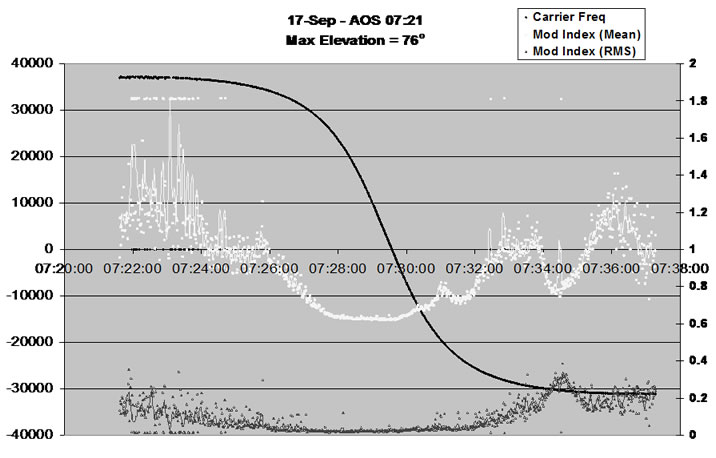
Figure 7. Doppler curve for maximal elevation of 76 º.
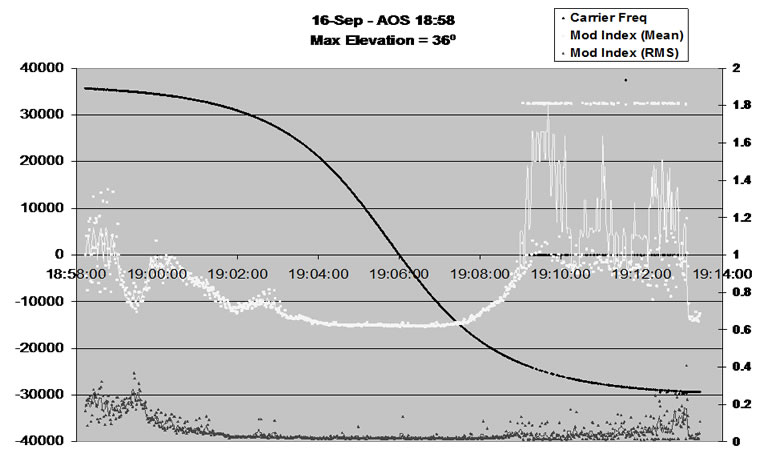
Figure 8. Doppler curve for maximal elevation of 36 º.
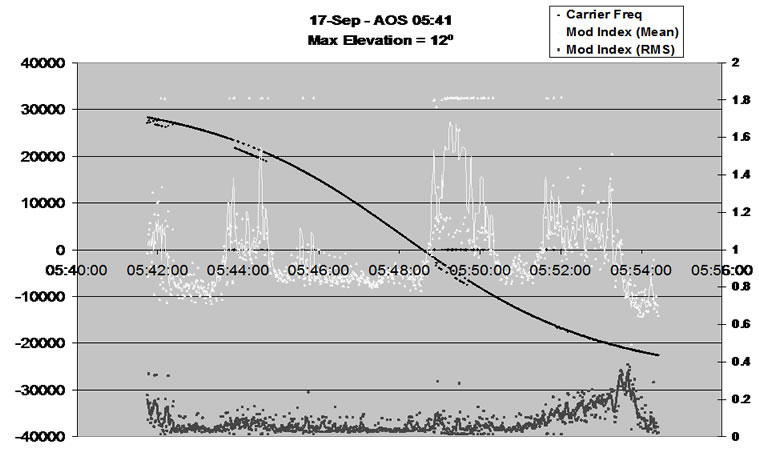
Figure 9. Doppler curve for maximal elevation of 12 º.
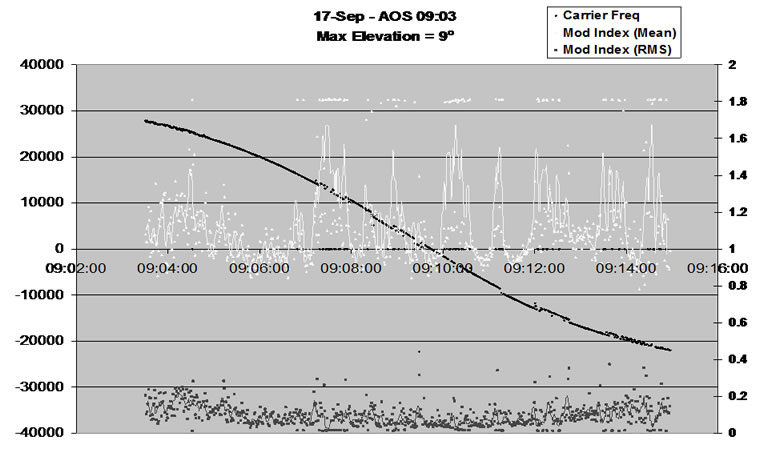
Figure 10. Doppler curve for maximal elevation of 9º.
In all figures before the turnoff of the S10 downlink, the received carrier frequency can be seen jumping from one satellite’s downlink to the other one, causing the degradation of downlink capabilities. The modulation indices are higher during these times since the receiver cannot lock on only one carrier. The modulation indices are typically lower (less interference) during the middle of the pass when the apparent separation of the satellites is greatest. The total magnitude of interference is greater for low elevation passes, and it becomes even greater as the peak period of interference approaches (from one pass to the next).
Figure 11 and Figure 12 show the same plots after the downlink of S10 had been turned off. They show that the only increase of the modulation indices occurs near AOS and LOS, when the signal is the weakest. Figure 11 and Figure 12 are typical of what you would see during a nominal pass with no interference. The procedures developed by Canada and executed by the USA were successful in interference mitigation. The worst of the inter ference was completely mitigated through the coordinated efforts of the ground and space segment providers.
6. Conclusions
U.S. SARSAT is data communication system dedicated to search and rescue purposes oriented on determination of distress locations worldwide, thus the performance of
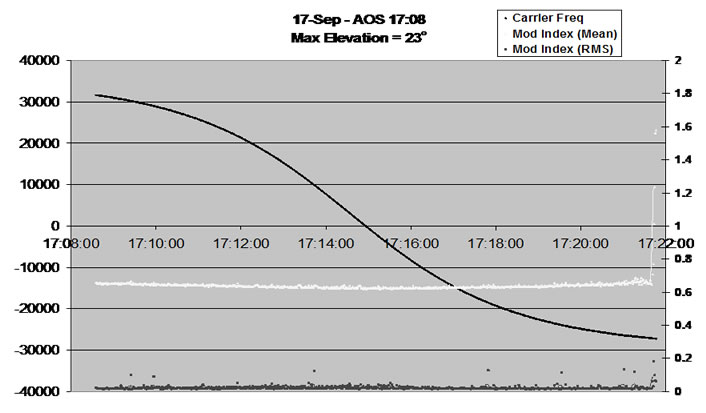
Figure 11. No interference doppler curve for Max. El. 23º.
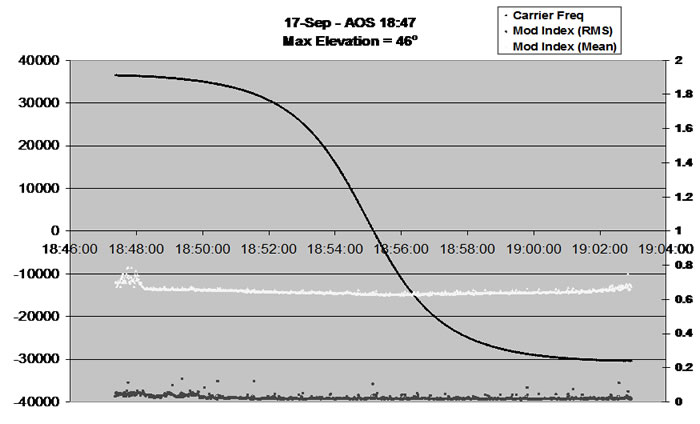
Figure 12. No interference doppler curve for Max. El. 48º.
the ground station is of high importance to this process.
It is confirmed that adjacent SARSAT satellites with short differences in orbital period interfere with each other. During these interference periods, significant degradation of downlink occurs.
The procedure to interrupt the downlink RF transmission from the “undesired” satellite is applied as a method to mitigate adjacent satellite interference. It has been confirmed that the interference was mitigated using this method. For newly built terminals though, larger antennas with a narrower beamwidth may also reduce the adjacent interference issue and impacts.
The DASS (Distress Alert Satellite System) is a newly developed & future approach intended to enhance the international COSPAS-SARSAT program. In this effort the satellite-aided search and rescue (SAR) system will install 406 MHz SAR instruments on the Medium Earth Orbit (MEO) navigational satellites [GPS (US), Galileo (EU), and Glonass (Russian Federation)]. With an expected 80 satellites expected once fully operational, new processing algorithms and interference mitigation strategies should also be considered. Because of the much higher altitudes of MEO satellites, a larger separation distance exists, and the adjacent interference will be less pronounced. This is just one more significant factor in favour of DASS approach.
7. References
[1] http://www.sarsat.noaa.gov/
[2] http://www.cospas-sarsat.org/
[3] D. Ludwig, R. Wallace, and Y. Kaminsky, “Proposed new concept for an advanced search and rescue satellite system,” IAF, International Astronautical Congress, 36th, Stockholm, Sweden, pp. 18, October 1985.
[4] I. W. Taylor and M. O. Vigneault, “A neural network application to search and rescue satellite aided tracking (SARSAT),” in Proceedings of the Symposium/ Workshop on Applications of Experts Systems in DND, pp. 189–201, Royal Military College of Canada, 1992.
[5] S. Cakaj and K. Malaric, “Rigorous analysis on performance of LEO satellite ground station in urban environment,” International Journal of Satellite Communications and Networking, UK, Vol. 25, No. 6, pp. 619–643, November/December 2007.
[6] F. Vataralo, G. Emanuele, C. Caini and C. Ferrarelli, “Analysis of LEO, MEO and GEO global mobile satellite systems in the presence of interference and fading,” IEEE Journal on Selected Areas in Communications, Vol. 13, No. 2, pp. 291–299, February 1995.
[7] J. S. Landis and J. E. Mulldolland, “Low cost satellite ground control facility design,” IEEE, Aerospace & Electronic Systems, Vol. 2, No. 6, pp. 35–49, 1993.
[8] L. Losik, “Final report for a low–cost autonomous, unmanned ground station operations concept and network design for EUVE and other NASA Earth orbiting satellites,” Technology Innovation Series, Publication 666, Center for EUVE Astrophysics, University of California, Berkeley, California, July 1995.
[9] “Specification for COSPAS” – SARSAT406MHz Distress Beacons, C/T T.001, No. 3 – Revision 9, October 2008.
[10] COSPAS –SARSAT System Monitoring and Reporting, C/S A.003, No. 1, Revision 15, October 2008.
[11] COSPAS – SARSAT 406MHz Frequency Management Plan, C/T T.012, No. 1 – Revision 5, Probability of Successful Doppler Processing and LEOSAR System Capacity, October 2008.
[12] G. Maral and M. Bousquet, “Satellite communication systems,” John Willey & Sons, Ltd, Chichester, England, 2002.
[13] D. Roddy, “Satellite communications” McGraw Hill, New York, 2006.
[14] M. Richharia, “Satellite communication systems” McGraw Hill, New York, 1999.
[15] Sh. Cakaj, M. Fischer, and A. L. Schotlz, “Sun synchronization of Low Earth Orbits (LEO) through inclination angle,” in Proceedings of 28th IASTED International Conference on Modelling, Identification and Control, MIC 2009, Innsbruck, Austria, pp. 155–161, Feruary16– 18, 2009.
[16] J. D. Kanellopoulos, T. D. Kritikos, and A. D. Panagopoulos, “Adjacent satellite interference effects on the outage performance of a dual polarized triple site diversity scheme”, IEEE Transaction on Antennas, Vol. 55, Issue 7, pp. 2043–2055, July 2007.
[17] S. Cakaj, “Practical horizon plane and communication duration for Low Earth Orbiting (LEO) satellite ground stations”, WSEAS Journal Transactions on Communications, Vol. 8, No. 4, pp. 373–383, April 2009.
[18] S. Cakaj, K. Malaric, and A. L. Schotlz, “Modelling of interference caused by uplink signal for Low Earth Orbiting satellite ground stations,” in Proceedings of 17th IASTED International Conference on Applied Simulation and Modelling, ASM 2008, Corfu, Greece, pp. 187–191, June 23–25, 2008.