Wireless Sensor Network
Vol.10 No.06(2018), Article ID:87270,12 pages
10.4236/wsn.2018.106007
Wireless Low Cost CO2 Monitoring System Design and Evaluation Using Non Dispersive Infrared Sensor
C. Delebarre1*, T. Pujolle1, G. Cousin1, A. Domon1, J. Froux1, J. Jourdan2
1IEMN-ENSIAME, Université de Valenciennes, Valenciennes, France
2SOBEN SAS Village Artisanale de Regourd, Cahors, France
![]()
Copyright © 2018 by authors and Scientific Research Publishing Inc.
This work is licensed under the Creative Commons Attribution International License (CC BY 4.0).
http://creativecommons.org/licenses/by/4.0/


Received: June 1, 2018; Accepted: June 27, 2018; Published: June 30, 2018
ABSTRACT
This paper presents a new wireless system for the measurement of CO2 gas concentration for indoor and outdoor purposes based on low cost Non Dispersive Infrared sensors. The system has been implemented on a printed circuit board in order to obtain different aspects of the air pollution. Some experiments were achieved to evaluate the total system combined with an android application on a smartphone. Different tests were realized in a closed room nearly filled with students and also directly while driving on the road. Good results were obtained allowing a future use for air pollution mapping using numerous amounts of sensors inside vehicles.
Keywords:
Pollution, Infrared Spectrometry Sensor, Gas Concentration, Air Quality

1. Introduction
The continuous human activities on the globe always have had an impact on the environment but only since the recent years they have become crucial to be able to measure (see Figure 1), and on a more global scale to quantify air quality in various environments. A common way to do it is by measuring gas emission coming from means of transportation, agriculture and farming such as carbon dioxide (CO2), methane (CH4), carbon monoxide (CO) or even ozone (O3). CO2 and CH4 have been the focus of intensive research at different sites in an effort to gain insights into their evolution, given their link to climate change [1] . Small changes in the trends of greenhouse gases can have a major impact on the Earth, and thus may be of great significance for climate change [2] . On another hand, it

Figure 1. Atmospheric CO2 at Mauna Loa Observatory (source internet).
could be very interesting to determine the level of CO2 gas concentration in different closed areas such as rooms, amphitheaters or transportation vehicles [3] [4] [5] . Because automotive industry has released the entry of carbon dioxide air-conditioning systems in cars for the next years, one of the objectives to reach is the development of a sensor that detects possible leakages of the CO2 coolant in the cooling equipment [6] . Note that governmental recommendations have been taken by many countries to fix the admissible level of indoor CO2 concentration.
Other compounds such as NH3 or NO2 as well as volatile organic components also have a strong impact on air quality and are also directly linked to human activities. This paper then proposes a new way of measuring the concentration of these gases through a wireless Non Dispersive Infrared (NDIR) low cost sensor. Regardless the method of acquisition, the obtained data can ultimately be used to monitor pollution, either outdoors on a defined territory or indoor as to define air quality and its impact on office workers and people working in a closed environment.
Because the system gets wireless and low cost properties, it could be a part of automotive vehicles. In this case the number of measuring nodes should increase and real time cartography of the polluting gases may be obtained using the wireless connection to a server site.
So in this paper, after a theoretical description of the Non Dispersive Infra-Red (NDIR) principle, the authors present the prototype design and evaluation of a CO2 measurement system.
2. Non Dispersive Infrared Sensor
In this study an Alphasense Non-Dispersive Infra-Red (NDIR) sensor was used to determine the CO2 gas concentration.
A NDIR sensor (Non Dispersive Infrared), as indicated by its name is a spectroscopic type of sensor that uses infrared sources. It is mainly composed of an infrared lamp, an optical cavity and a dual channel detector.
Light from the infrared source passes through the optical cavity where it interacts with the gas before affecting the active channel. This channel is fitted with a band-pass filter that allows only 4.26 µm wavelength to pass, where CO2 has a strong absorbance and the reference channel is fitted with a cut-band filter that allow everything but 4.26 µm wavelength to pass.
Alphasense IRC-AT (carbon dioxide), and IRM-AT (methane) thermopile, NDIR sensors consist of an infrared source, an optical cavity, a dual channel thermopile detector and an internal thermistor. The infrared source may be switched at a low frequency with a 50% duty cycle. A switching frequency of 1 to 3 Hz, derived from a crystal oscillator source is recommended. The source should be driven from a constant voltage source and care should be taken to ensure the supply does not contain low frequency ripple that would otherwise modulate the output. The nominal resistance of the source is approximately 9 to 10 Ohms at ambient temperatures and will draw approximately 50 to 60 mA at 5 V.
The average current will be half of this value (Figure 2) when driven at 50% duty cycle.
The NDIR sensor is based on a dual channel detector with two filter windows. The active filter is centred on an infrared absorption peak of the target molecule and the reference window is located in a part of the infrared spectrum where no absorption appears [7] .
So, each measurement I corresponds to the acquisition of the two available signals coming from the active channel ACT and coming from the reference one REF of the sensor (see Figure 3), with:
I = ACT/REF (1)
Although the active filter is centered on an absorption band, some wavelengths cannot be absorbed due to a slight mis-match between the filter bandwidth and the absorption band. So a calibration phase is necessary for a good detection of gas concentration.
For sensor calibration two parameters must be recorded I0 and SPAN in the
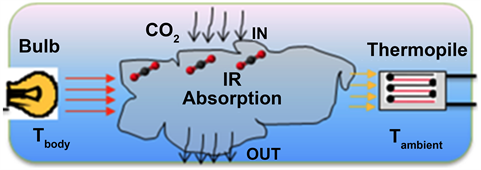
Figure 2. IR absorption inside a NDIR sensor.

Figure 3. Electric scheme of the NDIR sensor and conditioning circuit.
absence of the target gas. These two parameters have been measured using a small cell filled with nitrogen gas (see Figure 4). I0 is the ratio of the active to reference signals in absence of CO2 gas. SPAN is the proportion of radiation that impinges on the active element of the detector that has the ability to be absorbed by the target gas. Due to filter bandwidth and fine structure in absorption spectra, there are radiations that cannot be absorbed by the target gas. SPAN can be determined as follows:
(2)
where: ABS0 is the absorbance at the calibration concentration, x is the calibration concentration, b and c are linearization coefficients (see Table 1 and Application Note AAN 203).
The absorbance is defined as follow:
ABS = 1 − (I/I0) (3)
So, given Beer-Lambert law, the concentration of CO2 will be directly linked to the absorption, or the ratio of light intensity of the active channel (ACT) and the reference channel (REF), given by the following relation:
(4)
where ZERO refers to the absorption value measured during the calibration process where the sensor was placed in a gas hood enclosure filled with nitrogen.
In order to amplify and shape the signals coming from the NDIR sensor a signal conditioning stack was used and rather than using a conventional set of OP amps an all in one solution was picked under the form of the LMP91051 [8]

Figure 4. Waveform coming from the AFE.

Table 1. Absorption value table.
Analog Front End (AFE) chip from Texas instrument. It allows for common mode generation, various gain settings as well as the ability to toggle between both the active and reference channel of the sensor which are connected to it. Toggling between these at a sufficient rate like 40 Hz allows then to reconstruct both channels properly. The infrared lamp is not always on and also toggles at a 0.57 Hz frequency.
Below is the output of the AFE (see Figure 4). The RC looking waves corresponds to the lamp toggles while the small squares correspond to the channel toggle.
The two red stars are the points of interest and fit the delta which should be measured (ACT signal). One concentration sample at the lamp toggling frequency is thus obtained. It is also important to note that since the zoomed part represents about a sixth of the amplitude of the signal, the impact of the noise will be increased. Two ways of filtering the signal are then proposed here as to reduce its impact, one with a 20 samples moving average filter and one with a low pass filter. Both are used in this application (see Figure 5).

Figure 5. Zoom of the AFE waveform.
From this point in order to calculate the absorption we just need to calculate the amplitude difference of these two red stars. The absorption then leads to the concentration
(5)
Note here that the sensor can be calibrated for various detection range, from [0 - 5000 ppm] to [0% - 100%] and that b and c are universal linearization coefficients given by the constructor that matches the range, in our case [0 - 5000 ppm]. SPAN is also calculated thanks to constructor documents [7] and the table and relation below:
(6)
The effects of temperature on a NDIR sensor are very important and a temperature compensation treatment must be developed to ensure a good effective use of the sensor. Modifications in temperature affect the absorbance, SPAN and gas concentration. Simple linear temperature compensation algorithm could be applied to the data in order to increase the accuracy. For sensors with high full scale values it is sufficient to treat only the SPAN value using the following equation:
(7)
where: SPANT is the SPAN value at temperature T, SPANcal is the SPAN determined during the calibration process, µ0 is a correction coefficient provide by the constructor, Tcal is the calibration temperature.
3. Prototype Design
Two NDIR sensors for CO2 and CH4have been implanted on a PCB board and a Silicon lab C8051F990 core microcontroller was picked as to digitalize signals coming from both AFEs.
As showed on Figure 6, three different interfaces have been used in this application, both are wireless and the last one is a CAN interface because the system should be able to communicate with the car ECU. A Low Energy 4.0 Bluetooth module is in charge of sending out data to a mobile ANDROID application. Another wireless interface has been implemented on the board in order to decrease the energy consumption based on an Ultra-Wide Band (UWB) technology. However, this technology is not available on smartphone.
Due to the small computational power of the 8 bits non floating point microcontroller, the fixed point 16 bits data are sending to the smartphone which provide a huge computational capability compare to the microcontroller one (see Figure 7).
4. Experimental Evaluation
In order to evaluate the setup and put results into perspective a couple of experiments were made. First we checked the response of the system for a quick perturbation like someone blowing on the sensor. Note that the CO2 concentration in the exhaled air could reach about 30,000 ppm. The gas concentration at the origin of the curve is near 400 ppm value which is a classical indoor level for a room with a well maintaining air-conditioning system.
One may note that two temperature sensors are available onboard. The first one is located inside the NDIR sensor and is used to compute the compensation
![]()
Figure 6. Prototype description.
![]()
Figure 7. Fully assembled NDIR card.
previously described. The second one is located inside the microcontroller and it is more closed to the room temperature. We can see that the peak concentration only presents a 4000 ppm pulse which is much less than the expected 30,000 ppm (see Figure 8). This phenomenon is due to the fact that the sensor’s response time is about 40 seconds hence preventing a full rise to the amplitude of the input perturbation. This response time ultimately prevents the sensor from fully detect rapidly changing gas concentration and thus will make it not adequate for certain outdoor uses unless it is to measure tendencies in the CO2 concentration in the air rather than brief pulses.
It is also important to mention that a very high sensitivity to air flow variations has been experienced and resulted in noise on the output signal as visible in Figure 4 in blue. Such fast variations have had a mild to severe impact on calculated concentration which had to be filtered in order to limit noise impact and erratic results.
Then a second indoor experiment was made. The sensor was placed in a 120 seats amphitheater filled to about a third of its capacity for one hour and a half.
We can clearly see that the concentration is rising at a slow rate (see Figure 9) matching the student’s consumption of available Oxygen in the room. The noise on the computed values is here also clearly visible and a low pass filter was used with a cutoff frequency at 0.24 Hz to obtain the blue curve following the noise. The offset between the temperature of the sensor and the microcontroller is due to the constant toggling of the infrared lamp in its metal enclosure which causes extra heat to accumulate.
Then another long duration test has been realized. The sensor was localized in a 65 cubic meter room with 30 persons inside during a three hours measurement period (see Figure 10).
Two different periods should be isolated, the first 90 minutes one corresponds to a conference which has been made with an open door. The second 90 minutes one has been realized with a close door. One can notice that the CO2 gas concentration is much more higher during the second period. This is due to the
![]()
Figure 8. Sensor response to a quick perturbation.
![]()
Figure 9. 1 h 30 measurement in closed room nearly filled with students.
absence of air-conditioning in the room. A critical CO2 level of 2500 ppm is reach in this case.
Then outside tests were performed using a car. The sensor has been placed inside a car driving on the road and with open windows in order to determine the sensibility of the system to the exhaust gas in traffic jam (Figure 11).
As expected during the experiment the air flow generated by moving cars
![]()
Figure 10. CO2 gas accumulation during long duration measurement.
![]()
Figure 11. Measurements on the road.
drove the measurements a little bit off and it increased the noise on the concentration. Even if the outside air was also more filled with CO2 it is not possible to tell exactly what caused the pulses on the curve in red, the concentration or the noise itself, thus confirming the fact that NDIR measurements are less able to provide accurate measurements in windy environments.
5. Conclusions
A new wireless low cost CO2 concentration measurement prototype was developed and tested in several conditions. The first one is embedded in NDIR sensors and although it could deliver accurate values in ppm, many disadvantages were found such as noise and air flow sensitivity. On top of the response time of such sensors these factors in the end reduce the range of practical uses for them. A way of reducing noise and air flow sensitivity could be the mean of protective foams like the ones used with barometric sensor in order to reduce air flow on them, thus increasing accuracy and making the data even more valuable.
Despite the airflow sensibility of the system, using good filtering conditions, is possible to perform a punctual measurement and a long duration acquisition which may be sent to a server using GSM communications. As the cost of the system is lower than 50 euros, it could be spread in a large amount of vehicles in order to realize cloud measurement of the CO2 concentration more particularly downtown during traffic rush hours. So this work presents an innovative way to measure environmental pollution using a low cost sensor network which could be embedded inside automotive vehicles. This is the key difference between this work and existing related studies.
Acknowledgements
The authors would like to thank Bernard Piton for his technical support on electronic card realization. Moreover they also want to express their gratitude to B. Talon, and A. Gobinet from the Soben company for suggesting and sponsoring the subject.
Conflicts of Interest
The authors declare no conflicts of interest regarding the publication of this paper.
Cite this paper
Delebarre, C., Pujolle, T., Cousin, G., Domon, A., Froux, J. and Jourdan, J. (2018) Wireless Low Cost CO2 Monitoring System Design and Evaluation Using Non Dispersive Infrared Sensor. Wireless Sensor Network, 10, 119-130. https://doi.org/10.4236/wsn.2018.106007
References
- 1. Pérez, I.A., Sánchez, M.L., García, M.á. and Pardo, N. (2013) Carbon Dioxide at an Unpolluted Site Analysed with the Smoothing Kernel Method and Skewed Distributions. Science of the Total Environment, 456, 239-245.
>http://www.alphasense.com/index.php/products/ndir-air/
https://doi.org/10.1016/j.scitotenv.2013.03.075 - 2. Pickers, P.A. and Manning, A.C. (2015) Investigating Bias in the Application of Curve Fitting Programs to Atmospherictime Series. Atmospheric Measurement Techniques, 8, 1469-1489.
https://doi.org/10.5194/amt-8-1469-2015 - 3. Zampetti, E., Papa, P., Di Flaviano, F., Paciucci, L., Petracchini, F., Pirrone, N., Bearzotti, A. and Macagnano, A. (2016) Remotely Controlled Terrestrial Vehicle integrated Sensors System for Environmental Monitoring. Sensors: Proceedings of the Third National Conference on Sensors, 23-25 February 2016, Rome.
- 4. Antolín, D., Medrano, N., Calvo, B. and Pérez, F. (2017) A Wearable Wireless Sensor Network for Indoor Smart Environment Monitoring in Safety Applications. Sensors, 17, 365.
https://doi.org/10.3390/s17020365 - 5. Gibson, D. and MacGregor, C. (2013) A Novel Solid State Non-Dispersive Infrared CO2 Gas Sensor Compatible with Wireless and Portable Deployment. Sensors, 13, 7079-7103.
https://doi.org/10.3390/s130607079 - 6. Huber, J., Weber, C., Eberhardt, A. and W?llenstein, J. (2016) Photoacoustic CO2-Sensor for Automotive Applications. Procedia Engineering, 168, 3-6.
https://doi.org/10.1016/j.proeng.2016.11.111 - 7. Alphasense Limited (2014) NDIR: Gas Concentration Calculation Overview. Alphasense Application Note AAN 201-06, New York.
- 8. Seitz, J. and Tong, C. (2013) LMP91051 NDIR CO2 Gas Detection System. Texas Instruments, Dallas.