Wireless Sensor Network
Vol.6 No.3(2014), Article ID:44364,8 pages DOI:10.4236/wsn.2014.63005
M-ary FSK Modulation Using Short Packet without a Preamble and Error Detection Codes for Low Power Wireless Communication
Hironao Okada, Toshihiro Itoh
National Institute of Advanced Industrial Science and Technology, 1-2-1, Namiki, Tsukuba, Ibaraki, Japan
Email: hironao.okada@aist.go.jp
Copyright © 2014 by authors and Scientific Research Publishing Inc.
This work is licensed under the Creative Commons Attribution International License (CC BY).
http://creativecommons.org/licenses/by/4.0/


Received 16 February 2014; revised 16 March 2014; accepted 23 March 2014
ABSTRACT
Since power of a wireless sensor node is limited, low power communication technology has been required. M-ary frequency shift keying (MFSK) modulation with orthogonal signals is one of the methods to decrease the power. However, if the amount of transmitted data including such as an identification number (ID) of a node and measured data is small, a ratio of the data length to the total packet length, which means transmission efficiency, becomes quite low. Because a preamble and error check codes are generally added to a packet for synchronization between a transmitter and a receiver and for decrease in reception errors, respectively. In this research, we have developed a method with digital filters which eliminates the other signals from time series frequency spectra not to use a preamble and error check codes. Although estimated synchronization loss of the method was less than 1.6 dB, it was found that the loss of the method on error packet rate was almost 0 dB at more than 0.001 of packet error rate by a simulation made by BASIC. These results indicate a possibility to realize that a packet which consists of only two symbols can be received with no error if the transmitted data is less than 14 bits using 128-FSK.
Keywords:Low Power; Wireless Communication; Sensor Network System; MFSK

1. Introduction
Ubiquitous sensor networks which consist of a lot of wireless sensor nodes distributed in our surrounding and linked together are expected to be used for health [1] and security [2] monitoring applications as well as environmental monitoring [3] . One of the common issues of wireless sensor network is decrease in power at the wireless communication [4] . That is important especially in the case of using a small button battery or an energy harvester as the driving power.
The resources of wireless communication systems are received power and available transmission bandwidth [5] . We must decide the balance of the resources to meet the different demands in each application such as communication speed, reliability, and multiple accesses. Our group has been developed systems which help to decrease electrical power by monitoring of temperature, humidity, density of CO2 [6] , and electrical power [7] in offices, factories and shops. In this system, necessary communication distance is about 30 m. Thus multi hop communication is not needed. In addition, since 100% of communication reliability is not required for these data, a uni-directional communication system is applied to these applications. Thus the sensor nodes and receiver form a star topology.
In these systems where sensor nodes are not moved again after installing them, it is important to eliminate works of the battery replacement. Because we have to newly create an opportunity to replace. Especially in the case that a huge amount of nodes are placed, the time and cost for the battery replacement are not negligible and the spread of this system could be prevented. Thus, we intend to use a solar power cell which can generate enough power by indoor lighting in our systems. In this case, since the power is strictly limited, it is desirable to utilize the transmission bandwidth to decrease the power.
The suitable modulation for the power-limited system is M-ary frequency shit keying (MFSK) with orthogonal signals [5] . In the case of MFSK using all available bandwidth, frequency division multiple access (FDMA) cannot be used. In addition, if transmission data is small, the efficiency of data transmission becomes low. For instance, in the case that 6 bits of an identification number (ID) of a node and 8 bits of measured data are transmitted with 128-FSK, the number of transmitted symbols is only two. A transmitted packet generally includes a preamble and error check codes such as cyclic redundancy check (CRC). Since the preamble is used for synchronization of frequency or symbol timing, more than 8 symbols are commonly used. More than 8 bits of CRC are also utilized. In this case, since the ratio of data, including ID and measured data, length to the total packet length is 2/(8 + 2 + 2), it is obvious that this ratio is quite low.
In this paper, we propose MFSK using a packet without a preamble and error check cords for power limited system where transmission date is small. First, it is made clear that the relationship between the number of nodes and packet collision probability in a proposed system, and then the necessity of FDMA is examined. Next we explain a method not to use a preamble and CRC and show the effects on reception sensitivity and relationship between packet error rate and bit energy per noise power spectral density  by a simulation made by BASIC.
2. Design
2.1. Specification of This System
Table 1 shows an example of our system specification. The type of modulation is 128-FSK in 12.8 MHz bandwidth from 307.2 MHz to 320 MHz. Sixty four wireless sensor noses with 40 ksps of communication speed are used in this system. The nodes transmit 6 bits of ID and 8 bits of measured data one time per a minute. In this case, since this system does not use a preamble and error detection codes, the number of transmitted symbols is only two. Figure 1 shows a block diagram of a receiver. The frequency of the local oscillator is 307 MHz and the cut-off frequency of the low pass filter is 15 MHz. Digital data is generated by the analog to digital converter (ADC) with 25.4 MHz of sampling frequency. Time series frequency spectra are obtained by Fast FourierTransform (FFT) performed in a device such as a field-programmable gate array (FPGA) or a digital signal processor (DSP). Based on the frequency spectra, a received packet is demodulated.
2.2. Multiple Accesses
First, necessity of FDMA in our system is examined. In the case that the nodes transmit data with intervals which are every time randomly configured but the maximum interval is tint, the packet collision probability (Pcol) can be estimated by the following equation.
 (1)
(1)

Table 1. Specification of this system.
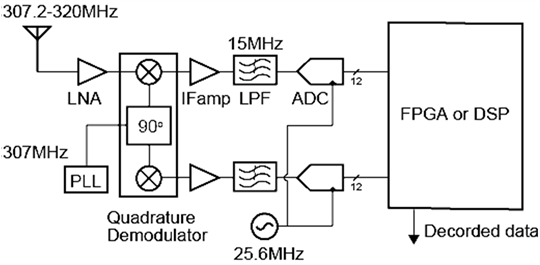
Figure 1. A block diagram of the receiver.
N is the number of wireless sensor nodes and ttrans is the necessary time for a transmission. If the communication specifications are Table 1, tint equals 60 s, N equals 64, ttrans equals 50 μs and Pcol is 0.005%. This probability is low enough to obtain required data in this system. Even if 1000 nodes are used, the probability is 0.08%. Thus it was found that the FDMA was not necessary in this system.
2.3. Preamble and CRC Code
In this section, we examine the necessity of a preamble and CRC codes. The CRC codes are used to decrease error reception. There are two cases of error reception. One case is that transmitted packets deteriorated by noises or multi pass fading are not received correctly. The other case is that the system receives packets transmitted from the other systems. In the former case, there are burst errors and random errors. Burst errors means that continuous symbols cannot be received. In many cases, the cause is multi pass fading. If the burst errors occur in our system, all symbols cannot be received. Because a packet transmitted by our system includes only two symbols. Thus, to add the CRC codes are not necessary to prevent the burst error. Random error is caused by thermal noise and creates bit error randomly in a packet. Since CRC codes cannot detect all error in a packet, errors caused by stationary noise like thermal noise are generally prevented using a signal threshold (TH1sp). If the signal threshold is enough higher than the stationary noise level, the random error can be eliminated. Thus, we concluded that the CRC codes were not necessary in this system. The latter case is important issue because our receiver receives only two symbols. The method to eliminate the error is mentioned later.
Next, we examine the necessity of a preamble which helps to synchronize frequency and symbol timing. In this system, although the frequency synchronization cannot be performed, the maximum loss caused by a frequency offset error can be estimated. The frequency offset affects a result of FFT. In this system, the frequency resolution of the FFT is 50 kHz. If the frequency of transmitted signal down converted to intermediate frequency (IF) is integer multiple of 50 kHz, there is no loss. However, if the frequency offset is 25 kHz, the intensity of the spectrum decreases by 3 dB because the intensity is divided into two spectra. Frequency tolerance of a crystal used in wireless sensor nodes is generally from ±10 to ±20 ppm. If a signal with 315 MHz is generated using a crystal with 20 ppm of frequency tolerance, maximum ±6.3 kHz of frequency offset can occur. On the other hand, if a receiver with a temperature compensated crystal oscillator (TCXO) with ±0.1 ppm of frequency tolerance is used, the maximum frequency offset is ±31.5 Hz at 315 MHz. Thus, the maximum frequency offset between the transmitter and the receiver is about ±6.3315 kHz. In this case, the maximum loss is about 0.6 dB.
In this system, both symbol synchronization and elimination of signal generated by the other systems are performed at the same time. This method excludes packets except for packets generated by this system with specification of Table 1 using digital filters applied to time series frequency spectra. However, it is assumed that multiple packets are not received if the multiple packets arrive at a receiver at the same time. Figure 2 shows an image of the filters applied to time series frequency spectra including a packet. If there are high values of the strength of frequency spectrum on the area of Figures 2(a) and (b), the packet is excluded. Because the receiver makes a judgment that the packet is longer than the specified packet length by the filters of Figure 2(a) and the packet does not have specified two symbols by the filters of Figure 2(b). In this paper, these conditions of Figures 2(a) and (b) are called criterion (A) and (B), respectively.
It must be confirmed that there is no symbol at the other frequency at the same time and the symbol length is not shorter than the specified length by the filter of Figure 2(b). To confirm the former state, the frequency resolution of the FFT must be high. The more points which constitute a wave in the FFT points (NFFT) there are, the higher frequency resolution becomes. Figure 3 indicates the image. The frequency resolutions of Figures 3(a) and (b) are high and low, respectively. In this way, to increase the resolution, the following condition needs to be met.
 (2)
(2)
where SFFT and Ssymbol are a set of FFT points and a set of AD converted points of a symbol, respectively. It can be confirmed that there is no symbol at the other frequency including the next frequency bands to the signal frequency if SFFT and Ssymbol satisfy Equation (2).
Next, we explain the judgment whether a length of received symbol is not shorter than the specified length. Figure 3(c) indicates that the frequency resolution also becomes low in the case that Ssymbol2 is fewer than SFFT. In other words, the strengths of frequency spectra at next frequency bands to the signal frequency become high. Thus it can be confirmed that there is no symbol at the other frequency at the same time and the symbol length is not shorter than the specified length by criterion (B) if the condition of Equation (2) is satisfied.
Actually, Equation (2) must be satisfied at any arrival timing of a packet. To that end, the following equation must be satisfied.
 (3)
(3)
where Nupdate is the number of points updated before each FFT calculation. To maximize the signal to noise ratio (SNR), it is desirable that Nsymbol is equal to NFFT. The loss affected by Nupdate can be calculated using following equation.
 (4)
(4)
This loss is the loss caused by a defect of the symbol synchronization in this system. If NFFT is 512 and Nsymbol is 640, the loss is about 1 dB.
Figure 4 shows the timing of the FFT and symbols. It is assumed that NFFT is 512 and Nupdate is 128. In this case the FFT is performed whenever 1/4 of PFFT are updated. In Figure 4, FFT1 and FFT6 meet the condition of Equation (2).
3. Simulation and Results
In this section, it is made clear that the influence of the method on a packet error rate with a simulation. The all simulation was carried out by software which was made by BASIC. As previously mentioned, the transmitted packet has only two symbols. In this simulation, the frequency of symbol 1 and 2 were fixed and they were 308 MHz and 310 MHz, respectively. The other conditions are shown in Table 1. If 307 MHz of local oscillator is used, intermediate frequencies of the symbols become 1 MHz and 3 MHz. This simulation starts from the intermediate frequencies. The symbol entered into the FFT was sinusoidal wave added white Gaussian noise (AWGN). Since thermal noise is present in all communication systems and is the prominent noise source for

Figure 2. An image of the filtering applied to time series frequency spectra including a packet. The filter of (a) and (b) exclude longer and shorter packets than the specific packet, respectively.
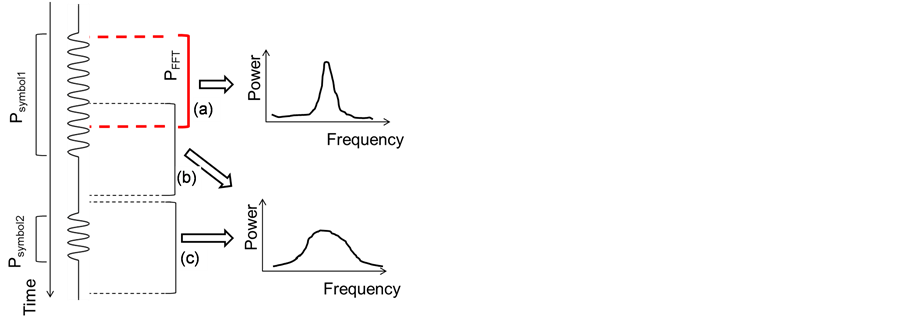
Figure 3. Relationship between frequency resolution and data used by FFT. In the case of (a), the resolution is high. In the case of (b) and (c), since Psymbol is smaller than PFFT, the resolution becomes low.
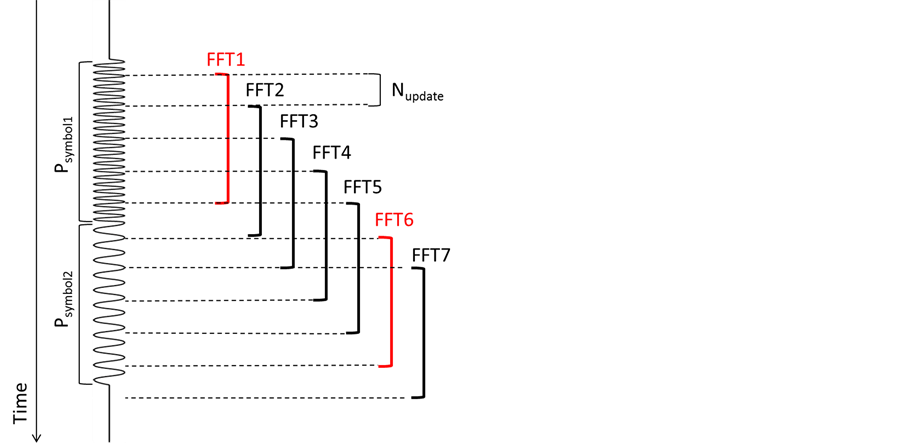
Figure 4. Image of the timing between FFT and symbols.
most systems, AWGN is most often used to model the noise in communication systems [5] . The Gaussian noise was added by the Box-Muller method [8] .
Figure 5 indicates the algorism of the reception. First, frequency spectra (Framet) obtained by the FFT at time t are saved in a memory. Next, spectra (Sp1 and Sp2) which have maximum strength in each Framet-5 and Framet-10 are extracted. Then, it is confirmed that the each strength (St1 and St2) exceeds a threshold value (TH1sp). This condition is called criterion (C). Next, it is also confirmed that there is no spectra with more than a threshold of the strength (StTH)
 (5)
(5)
This condition means the criterion (A). In addition, it is confirmed that there are no spectra with more than StTH except for Sp1 in Framet-5 and Sp2 in Framet-10. This condition means the criterion (B). Next, the following condition is confirmed.
 (6)
(6)
This condition (criterion (D)) means that the difference between St1 and St2 must not be so big if the Sp1 and Sp2 are the symbols which compose a packet transmitted in this system. Finally, it is confirmed that there is no combination of Sp1 and Sp2 from Framet to Framet-10. This condition (criterion (E)) prevents the receiver to detect fault packets which consist of a symbol including a correct packet and noise. If a packet meets all criteria, the packet is received as a correct packet. In this simulation, a trial is repeated 10,000 times per an Eb/N0 and then, packet error rates were calculated.
First, an optimum TH1sp which maximizes reception sensitivity and eliminates the number of error reception in AWGN channel was decided. In the simulation for this decision, the criteria (A, B, D, E) could not be used because these criteria are for preventing reception of packets from the other systems. Table 2 shows the number of error received packets of 10,000 times simulation. From this result, we decided that the optimum TH1sp was 8.
Figure 6 indicates the effects of the TH2sp on the relationship between  and packet error rates at 3 dB of TH3sp. The
  was calculated by the following equation.
 (7)
(7)
where  is strength of a symbol, Nave is average of strength of noise spectra, which were calculated ten times by FFT of the white Gaussian noise, in all frequency bandwidth, W is 50 kHz of FFT resolution and R is 280 kbps of bit rate. Since the modulation is 128 (=27)-FSK, the bit rate becomes 280 (=40 ksps × 7) kbps. It was found that TH2sp should be less than 3 dB. Figure 7 indicates the effects of the TH3sp on the relationship between
  and packet error rates at 3 dB of TH2sp. It was found that TH2sp should be more than 2 dB. If the effect of the elimination increases the suitable TH2sp and TH3sp are 3 dB and 2 dB, respectively.
The theoretical formula of symbol error rate PE (M) of MFSK with coherently detection can be expressed [5] as
 (8)
(8)
where  is the energy per symbol and Q(x) is the complementary error function. The packet error rates obtained by the simulation equal to symbol error rate, because the packet has no error-correction codes. If
  is 2.4 dB, PE (128) is 0.025. If the same error rate is realized by the proposed method, about 3.6 dB of
  is required. This simulation had the 1 dB loss of symbol synchronization. Thus, it was found that the loss caused by the proposed method is almost 0 dB.
4. Conclusion
To increase the transmission efficiency, we developed the method with digital filters which eliminate the other signals from time series frequency spectra. Although the estimated synchronization loss of the method was less than 1.6 dB, this can be decreased by using a crystal oscillator with small frequency tolerance or decreasing of
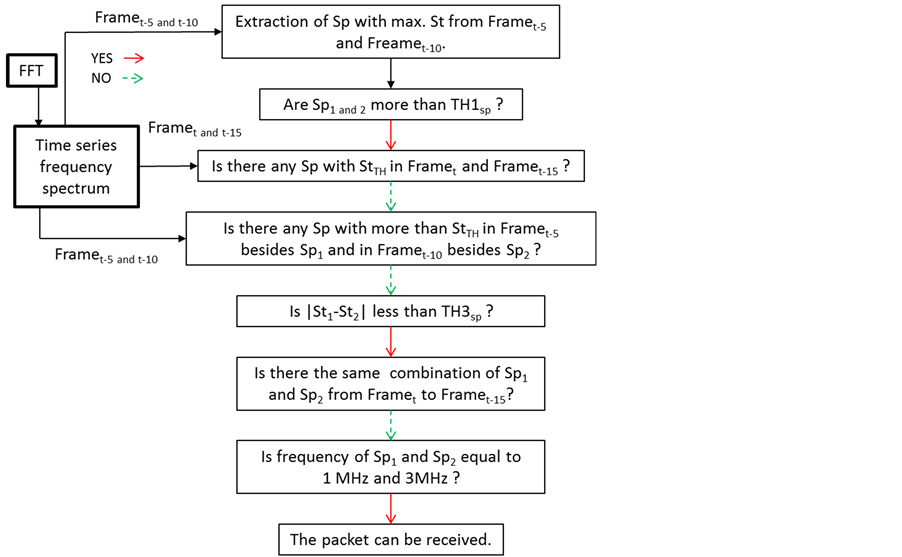
Figure 5. Algorism of the reception. “Framet” means frequency spectra calculated by FFT at time t. Sp and St mean a frequency spectrum and strength of the Sp, respectively.
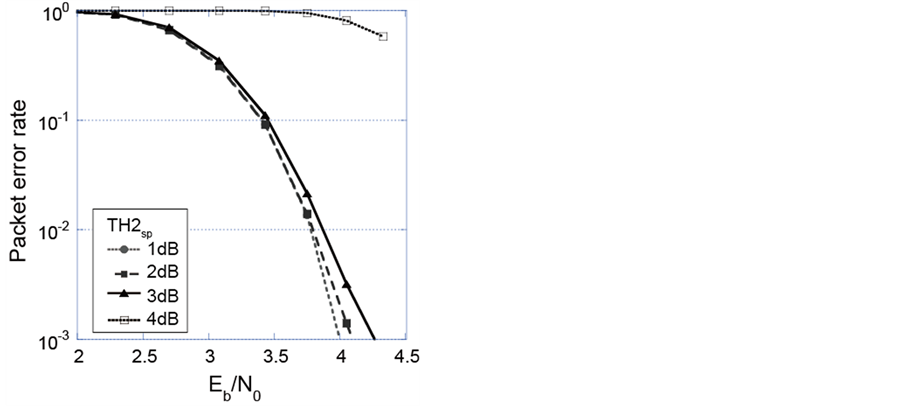
Figure 6. The effects of the TH2sp to the relationship between Eb/N0 and packet error rate at 3 dB of TH3sp.
Table 2. Number of error received packets of 10,000 times simulation.
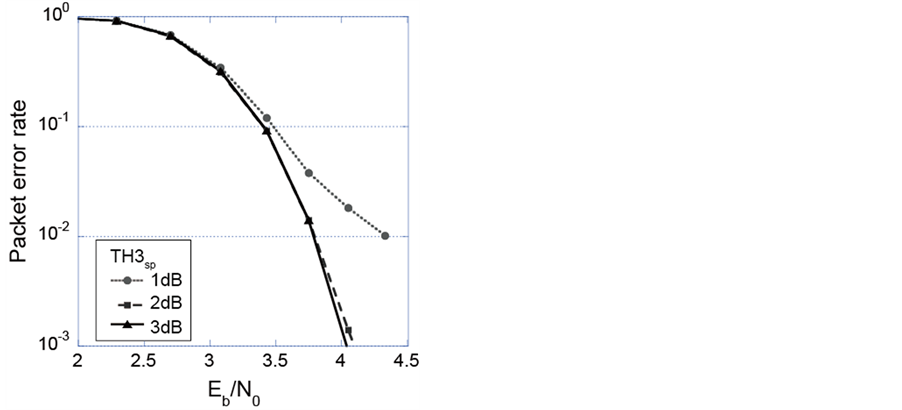
Figure 7. The effects of the TH3sp to the relationship between Eb/N0 and packet error rate at 3 dB of TH2sp.
Nupdate. From the simulation results, it was found that the effects of 3 dB of TH2sp and 2 dB of TH3sp on more than 0.001 of error packet rates are almost 0 dB. This means that signals from the other systems can be eliminated by these thresholds. In next research, we will make the prototype of a receiver which realizes the proposed method by a FPGA and examine the effect of the method.
Acknowledgements
This work was supported by the New Energy and Industrial Technology Development Organization (NEDO).
References
- van de Ven, P., Feld, R., Bourke, A., Nelson, J. and Laighin, G.O. (2008) An Integrated Fall and Mobility Sensor and Wireless Health Signs Monitoring System. Proceedings of IEEE SENSORS 2008, Lecce Italy, 26-29 October 2008, 625-628.
- Taylor, S.G., Farinholt, K.M., Flynn, E.B., Figueiredo, E., Mascarenas, D.L., Moro, E.A., Park, G., Todd, M.D. and Farrar, C.R. (2009) A Mobile-Agent-Based Wireless Sensing Network for Structural Monitoring Applications. Measurement Science & Technology, 20, 1-14. http://dx.doi.org/10.1088/0957-0233/20/4/045201
- Hayes, J., Beirne, S., King-Tong, L. and Diamond, D. (2008) Evaluation of a Low Cost Wireless Chemical Sensor Network for Environmental Monitoring. Proceedings of IEEE SENSORS 2008, Lecce Italy, 26-29 October 2008, 530-538.
- Brian, O. and Jan, R. (2007) Ultra-Low Power Wireless Technologies for Sensor Networks. Springer.
- Bernard, S. (2013) Digital Communications Fundamentals and Applications. Prentice Hall.
- Honda, M., Takei, Y., Ishizu, K., Imamoto, H., Itoh, T., Maeda, R., Matsumoto, K. and Shimoyama, I. (2012) LowPower-Consumption CO2 Gas Sensor Using Ionic Liquids for Green Energy Management. Proceedings of IEEE Sensors 2012, Taipei, 28-31 October 2012, 745-748.
- Fujimoto, J., Furusawa, S. and Suzuki, A. (2012) Power Monitoring Using Wireless Sensor Nodes as an Effective Contribution to Power Saving in Convenience Stores. Proceedings of Electronics Goes Green 2012, Berlin, 9-12 September 2012, 1-6.
- Box, G.E.P. and Muller, M.E. (1958) A Note on the Generation of Random Normal Deviates. The Annals of Mathematical Statistics, 29, 610-611. http://dx.doi.org/10.1214/aoms/1177706645