Journal of Water Resource and Protection
Vol.6 No.9(2014), Article ID:47378,8 pages
DOI:10.4236/jwarp.2014.69076
Energy Balance in a Patch of the Atlantic Forest in São Paulo City, Brazil
Frederico Luiz Funari, Augusto José Pereira Filho
Hydrometeorology Laboratory, Institute of Astronomy, Geophysics and Atmospheric Sciences, University of São Paulo, São Paulo, Brazil
Email: ffunari@uol.com.br
Copyright © 2014 by authors and Scientific Research Publishing Inc.
This work is licensed under the Creative Commons Attribution International License (CC BY).
http://creativecommons.org/licenses/by/4.0/


Received 12 February 2014; revised 11 March 2014; accepted 8 April 2014
Abstract
The aim of this work was to characterize and to bring into relationship of the net radiation with the latent heat flux equivalent to water (mm) in a patch of Atlantic Forest within the metropolitan area of São Paulo (RMSP). The estimation of the latent heat flux (LE) was made by the energy balance equation with the Bowen ratio. Measurements of net radiation and psychometrics gradients were made. Soil heat flux (G) was measured by temperature sensors in two depths. Measurements were made at Park of Science and Technology of São Paulo University (CIENTEC), São Paulo, Brazil, between 2011 and 2013. Results indicated that evapotranspiration varies seasonally and the amount of water evaporated exceeds 3.0 mm·day−1 in spring/summer and in autumn/winter the amount is approximately 1.0 mm·day−1. The evapotranspiration is increased under RMSP urban climate conditions with higher air temperature and lower moisture especially in summer season.
Keywords: Evaporation, Evapotranspiration, Solar Energy, Bowen Ratio

1. Introduction
The purposes of this work is the measurement and to analyze inedited net radiation data to estimate latent heat, sensible heat and soil heating at the State Park and Ipiranga’s Springs (PEFI), located at southern part of city Sao Paulo. There is a gap of such studies for areas of Atlantic Forest inserted in a complex metropolitan area (Figure 1). Pereira Filho et al. [1] analyzed significant micro climate changes in the past seven decades such as an increase in air temperature of 2.17˚C, a decrease in relative humid of 7%, and 400 mm increase in the yearly precipitation caused by anthropic impacts in soil usage and coverage, movement and the breeze from sea in the late afternoon, local produce storms and severe floods and other major impacts in the metropolitan area. PEFI is
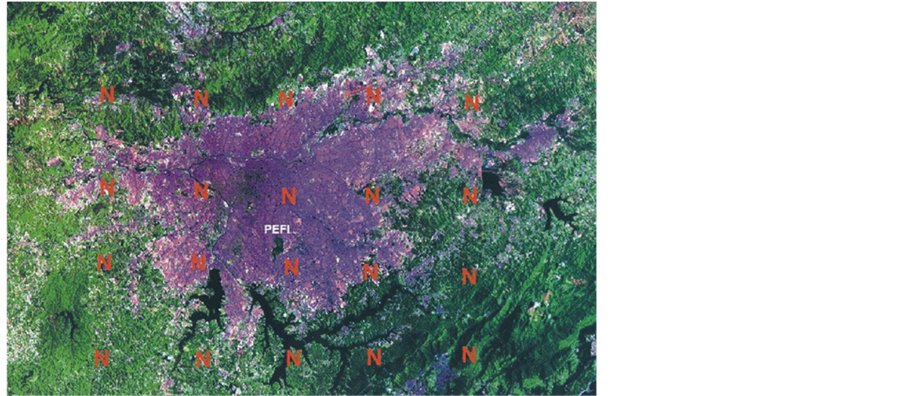
Figure 1. Landsat-14 image of the metropolitan area of São Paulo. The location of the State Park and Ipiranga’s Springs (PEFI) is shown. Source: Pereira Filho et al. [1] .
a patch of reminiscent Atlantic Forest within the MASP and it is also affected by its local climate changes. The aim of the present work is to study heat flux and the energy balance in PEFI under such urban humid temperature stresses.
The process of transferring water to the atmosphere through evaporation of water and liquid from the soil surface and transpiration of the vegetables becomes evapotranspiration (Thornthwaite et al. [2] [3] ). The main weather variables considered in the study of evapotranspiration are: solar irradiance, insulation, air temperature, relative humidity, precipitation and wind speed and direction. As the direct measurement of evapotranspiration is quite difficult, costly, it requires special facilities and equipment at high cost (lysimeters, evapotranspirometers, tanks, etc.) justifying only in experimental conditions. There are countless methods of estimating evapotranspiration (Berlato & Molion, [4] ), and they can be grouped into several categories: empirical, aerodynamic and energy balance (Berlato & Molion, [4] ). In this work, we emphasize the method of energy balance. In the large cities there are so-called “heat islands” that are caused by intense urbanization, industrialization, heavy traffic, which significantly after the environment, produce changes in weather elements. A study on the metropolis was done by Lombardo [5] . An analysis on the measurements on the meteorological variables observed in Sao Paulo was performed by Pereira Filho et al. [1] , and then it observed a decrease of about 7% in relative humidity, and an increase of 2.2 degrees Celsius in the average temperature and also an increase in the rate of precipitation. In January 2010, a monthly total rainfall of 653.2 mm occurred, approximately three times as the normal (219.2 mm), with a major impact of change in urban space as flooding, floods, landslides etc. A survey of the maximum intensities of rainfall and its probability of occurrence was conducted by two researches of IAG-USP, with the use of rain gauge data (Garcia Occhipinti and Marques dos Santos [6] ). This work has been used for planning urban drainages and prevention of extreme rainfall events. Air pollution existing in large conurbations, enables its condensation nuclei in the formation of a large amount of cloudiness, consequently altering the amount of solar radiation that reaches the surface of the metropolitan area.
Thornthwaite et al. [2] [3] introduced the concept of potential evapotranspiration to express evapotranspiration that normally occurs in a fully vegetated terrain, freely exposed to the atmosphere and the place never lacking moisture in the soil for use by plants. Thornthwaite and Mather [7] , emphasized that evapotranspiration is in the final analysis of the normal evaporation from the natural surface well supplied with moisture and the atmosphere that occurs when vegetation does not suffer restrictions moisture. Penman [8] [9] studied the evaporation and evapotranspiration by associating the equilibrium water vapor pressure (es) with the existing vapor pressure (ea). The Penman method takes into account the net energy availability. But since the Penman’s formulation was laborious, Bavel [10] proposed a simplification through an abacus to consider insulation.
Blaney and Criddle [11] introduced a method similar to Thornthwaite, but used the average temperature and a day light length factor. The energy balance method has its development after the work that Bowen [12] entitled “The ratio of heat losses by conduction and evaporation from any water surface”. Many researchers used this method to retrieve data from evaporation and evapotranspiration, especially with agro-meteorological purposes. Fritschen [13] studied different vegetation cultures using the Bowen ratio. Specifically in Brazil, many contributions have been given by Camargo [14] -[16] , Villa Nova [17] to energy budget in rice cultivation. Sá et al. [18] evaluated the energy flux in Central Amazonia Forest. Gielow et al. [19] used the Bowen ratio in researching advection from tropical forests. Paiva et al. [20] determined the evapotranspiration of a wheat crop using the method of energy balance.
The estimation of latent heat flux from a culture of chili using the method of energy balance (Bowen ratio) was performed by Cunha et al. [21] . Boueri [22] estimated the crop evapotranspiration of Tagetes patula (a flower called “marigold” in greenhouse and field). The estimated evapotranspiration in cerrado by the Bowen ratio method was performed by Biudes et al. [23] . Silva et al. [24] investigated the flow energies to farmland and forest in eastern Amazonia. An important contribution was made by Oliveira [25] , who compared Penman [8] [9] with an evaporating pan with measurements of net radiation. Measurements of temperature and humidity to determine the Bowen ratio can be costly. Armani [26] [27] and Armani and Galvani [28] developed a low-cost system termed abc that is used with a shelter in this research with compatible results when compared to a WMO certified weather station [29] (Funari and Pereira Filho [30] ). Under normal atmospheric conditions, the main energy supplied to the surface is given by the solar short wave radiation which is partially reflected (albedo) as the characteristics surface, establishing a shortwave balance (SWB). On the other hand, the surface also radiates long-wave radiation to the atmosphere depending on the temperature that results in long waves balance (LWB). Both SWB and LWB establish the so-called net radiation (Rn) balance. The consumptive use of the energy used in the processes is the following form:
 (1)
(1)
where, Rn = net radiation (W∙m−2); LE = latent heat (W∙m−2), used in evapotranspiration; H = sensible heat (W∙m−2), air and surface heating; G = soil heating (W∙m−2), heat flow in the soil; F = photosynthetic heat (W∙m−2), by biological processes.
Obtaining evaporation or evapotranspiration through energy balance is an alternative that has been considered promising (Berlato and Molion, [4] ), whenever variables can be measured or estimated with sufficient accuracy for energy balance studies. Evapotranspiration can be determined with good accuracy as well (Villa Nova, [17] ). Additionally, this is a method that allows estimation of evaporation or evapotranspiration for short periods such as a day for example (Berlato and Molion, [4] ). Early studies of the energy balance were made by Bowen [12] over liquid surfaces, determining the ratio between the fluxes of sensible and latent heat as a function of temperature and vapor pressure gradients called “Bowen ratio”.
2. Materials and Methods
The meteorological variables data used in this manuscript were measured by an Automatic Weather Station installed in a weather enclosure together with an existing conventional WMO meteorological station (WMO 83004), located on the premises of the USP Science and Technology Park (CIENTEC). The latter is in patch of Atlantic Forest (Parque Estadual das Fontes do Ipiranga) inserted in the southern region of Sao Paulo-SP Brazil. The geographic coordinates are: Latitude = 23˚39'04"S − Longitude = 46˚37'21"W − Altitude = 802.0 m. The instruments used in the table below (Table 1). The measurements with the instruments of Automatic Weather Station (AWS), were compared with those of the conventional Weather Station (WMO 83004) by Funari and Pereira Filho [30] .
2.1. Criteria for Selecting Data
To obtain satisfactory results some criteria are needed Funari, [31] : 1) days without rain in the day and the previous days; 2) remove days with negative Rn at sun rise and setting (here from 08:00 to 16:00 LT); 3) insulation greater than 70%; 4) identified predominant weather system over the region (air mass), discriminated by the Naval Meteorological Service of the Brazil Navy at 00 UTC and 1200 UTC [29] and; 5) select data discriminated by season (spring, summer, fall and winter). All days were selected with the above criteria between May 2011 and June 2013.

Table 1. Measurements and instruments required.
(*) Installed in particular shelter (“abc”) under 0.8 m above the ground.
2.2. Bowen Ratio Energy Balance Method
With measurements of net radiometer (Rn), Equation (1) can be modified to estimate the energy balance:
 (2)
(2)
where, F + M = heat flux by photosynthesis and other heating processes.
The term (F + M), are very small, about 1%, and may be disregarded. The value of G is also small and can be determined by measurements with flow meters instruments, or from measurements of soil temperature and physical characteristics of the same (Funari and Pereira Filho, [32] ). The most important components of net energy budget are the sensible heat flux and latent heat. Both the net radiation and soil heat flux can be measured. The laws governing the flow of heat in the gases cannot be applied to predict the flow of sensible heat in the atmosphere, as this is an open system. The flow of air above the surface of the soil causes it to be continually renewed and mix with the air from the higher layers (Mota, [33] ). The sensible heat (H) can only be determined estimate in practice. The latent heat flux (LE) is the most important and of the order of more than half of net energy available. The heat to evaporate 1 mm of water is called latent heat of evaporation. It varies slightly with temperature; being approximately 59 calories evaporate 1 mm of water. To resolve for H, it is used the Bowen ratio, that also allows the calculation of the latent heat (LE). To determine the Bowen ratio, is necessary two psychrometers (set of dry and wet thermometers) installed in two different height levels. Given the existence of the Automatic Weather Station measurements of air temperature and relative humidity in the standard height of 1.5 m, sensors were installed to measure air temperature and relative humidity at the height of 0.80 m (HT-500) (Funari and Pereira Filho, [34] ). In summary Rn and G were measured and H and LE were determined using the Bowen ratio. Bowen [12] , listed the sensible heat flux (H) and latent (LE):
 (3)
(3)
where, B = Bowen ratio; ΔT = temperature gradient (˚C) at two levels (0.8 m to 1.5 m) with psychrometers; Δea = gradient of vapor pressure (mmHg) at two levels considered; γ = psychometric constant (0.47 mmHg/˚C).
According to Villa Nova [17] , Equation (3) can be simplified:
 (4)
(4)
where, s = tangential to saturation curve of water vapor in the moist point average
temperature (MTU). The term
 are calculated from table (Villa Nova, [17]
and Ferreira, [35] );
are calculated from table (Villa Nova, [17]
and Ferreira, [35] );
![]() is the humid difference measured at two levels Z2 (1.5 m)
and Z1 (0.8 m);
is the humid difference measured at two levels Z2 (1.5 m)
and Z1 (0.8 m);
![]() is the dry temperature difference measured at Z2 and Z1.
is the dry temperature difference measured at Z2 and Z1.
The equation used to calculate the latent heat flux (LE), which is the fraction of energy used for evaporation and evapotranspiration is the following:
 (5)
(5)
In Equation (5), Rn and G are derived from measurements and B of Equation (4).
In Equation (5) to obtain the value of LE have the value of G (ground heat flux), it may be obtained by measuring soil temperature selected in two levels (the soil surface and 20 cm depth), knowing the type and soil physical properties, which are determined in the laboratory. At springs of the Ipiranga State Park, Sao Paulo Brazil, the soils are predominantly Oxisol and Clay type, Funari and Pereira Filho [32] . The term G is obtained from:
 (6)
(6)
where, G = heat flow in soil (cal∙cm−2·min−1);
A = area through which to study the variation in flow (= 1 cm2); dT =
temperature difference between two levels (0 cm and 20 cm); dZ = difference between
two levels (0 cm and 20 cm);
 (cal∙cm−2·s−1),
where, μ = (0 cm - 20 cm) = 8.27 (wt% moisture); ρ = (0 cm - 20 cm) = 1.14 g/cm3
(density).
(cal∙cm−2·s−1),
where, μ = (0 cm - 20 cm) = 8.27 (wt% moisture); ρ = (0 cm - 20 cm) = 1.14 g/cm3
(density).
The values of μ and ρ, are for the soil near the Automatic Meteorological Station, the value of K = 0.0459 cal∙cm−2·min−1.
Equation (6) becomes:
 (7)
(7)
With the use of Equations (5) and (7), one can write the equation to obtain the latent heat of evaporation (LE):
 (8)
(8)
3. Results
The results for selected days according to the criteria Section 2.2 are shown in Table2 An important factor that should be considered is the n/N ratio which indirectly indicates the amount of cloudiness that influences the incoming solar radiation and, consequently, the evapotranspiration. An example is Figure 2 for 19/12/2011 with
Table 2 . Selected days and results from meteorological variables measured. AMT is the air mass type. Qg is the global solar radiation (ly∙day−1); n/N id the ration of actual hours of sunshine (n) and maximum hours of sunshine (N); Rn is the net radiation (ly∙day−1); G is the = soil heat flux (ly∙day−1); B is the Bowen ratio (H/LE); LE/Rn is the percentage of latent heat flux in the total net radiation; LE is latent heat flux of evaporation (ly∙day−1); EV is the evaporation (mm∙day−1).
1 W∙m−2 = 2.06 ly; 1 ly = 0.485 W∙m−2.
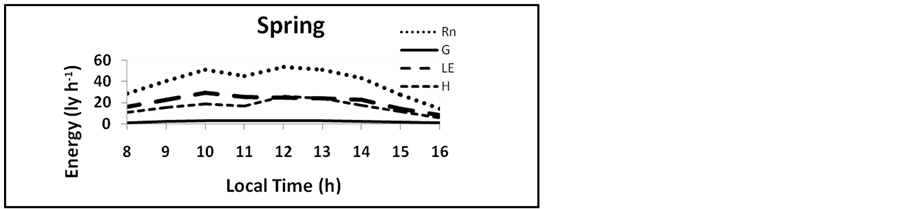
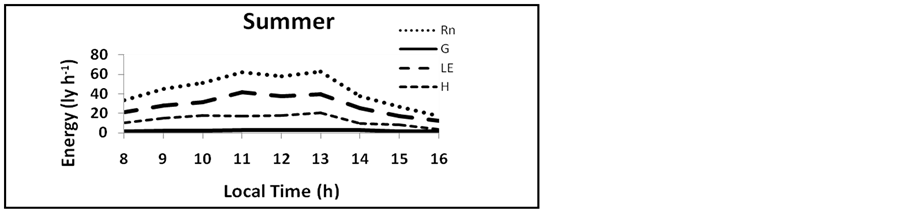
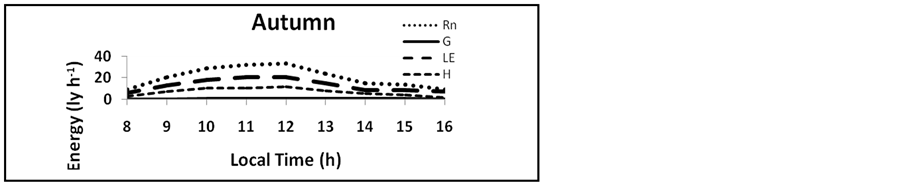
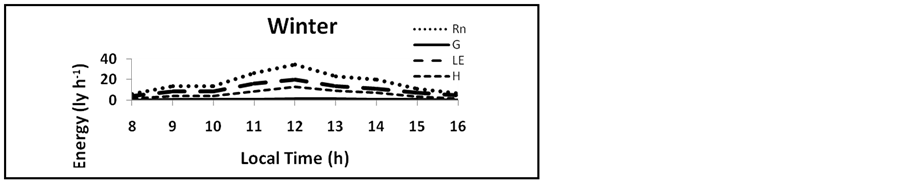
Figure 2. Net radiation (Rn), latent heat (LE), sensible heat (H) and soil heat (G) for selected days of spring (21/10/2011); summer (19/12/ 2011); autumn (26/05/2012) and winter (08/06/2013).
n/N = 0.840 under a continental tropical air mass (hot and dry) when the evaporation was 4.3 mm. On the order hand, in winter on 08/06/2013 (Figure 2), there was an evapotranspiration of 0.8 mm at lower n/N = 0.614 with more cloudiness and under a polar air mass. The Bowen ratio indicates that evapotranspiration varies seasonally. It is higher in spring and summer due to higher solar energy. The global solar radiation reaching 400 to 500 ly∙day−1 and LE greater than 100 ly∙day−1, and even to 200 day−1. As a consequence, water evaporation exceeds 3.0 mm∙day−1 easily. In autumn and winter, due to the smaller solar radiation given the lowed altitude of the sun, the global radiation is less than 300 ly∙day−1. The latent heat flux is generally below 100 ly∙day−1. The evaporation is about 1.0 mm∙day−1. On a water balance work at Springs of the Ipiranga State Park (PEFI), Pereira Filho et al. [36] determined by measurements of precipitation and stream flow in IAG’s watershed, the evapotranspiration in the period of 396 days (June 1999 to June 2000), was 1004.9 mm or 2.54 mm∙day−1. Using data from measurements of meteorological variables from the same period by calculating the radiation balance, the evapotranspiration was 1021.7 mm (2.58 mm∙day−1).
Figure 2 shows the daily level and time flows Rn, G, H and LE, numerically and graphically on representative days of the seasons, spring, summer, autumn and winter. In the graphs we can see the time change (ly∙h−1) of multiple streams. We can notice the difference between the values of flows from one station to another. The soil heat flux is always small barely exceeding 50 ly∙day−1. The LE/Rn ratio varied between 50% and 65%. The LE flux presented in Figure 1 shows it is higher for higher Sun elevation from 10 A.M. to 2 P.M. or with higher net energy. The Bowen ratio (B) ranged from 0.441 to 0.771 with an average of 0.565 that is higher than the one observer in the Amazon rainforest where the average is about 0.3 (Molion, [37] ), and slightly higher than the one found for the Pantanal region (below 0.5) according to Souza et al. [38] .
4. Conclusions
The Energy Balance using the Bowen ratio for the determination of evapotranspiration is quite satisfactory and continues to be widely used for various agricultural crops and natural vegetation areas. The methodology shows the practicability and economy of time and maintenance costs, and the employment of evapotranspirometers, lysimeters and evaporation pans. The advantage is the possibility of obtaining the evaporation at shorter time intervals such as a day. The necessary instrumentation and technique involved in the measurements, however, have limited the use of the method in research.
The selected days studied by season (autumn-winter and spring-summer) and synoptic maps showed that the dominant weather system over the study area was not very significant to determine the evapotranspiration. The selection of days with enough sunshine and no precipitation was the key to consistency in comparing results. Evapotranspiration on selected days showed values that show the seasonal effect: autumn-winter evapotranspiration average of 1.45 mm∙day−1, while spring-summer of 3.15 mm∙day−1. The Bowen ratio was on average of 0.565 higher than that in the Amazon (~0.3). However it can be explained by greater solar radiation, higher altitude and less vegetated than that in the Amazon.
Acknowledgements
The authors are thankful to FAPESP (grant 01/13952-2), CNPq (granted 304978/2011-6) and FUNDESPA for providing funds to this research.
References
- Pereira Filho, A.J., Marques dos Santos, P. and Xavier, T.M.B.S. (2007) Evolucao do Tempo e do Clima na Regiao Metropolitana de Sao Paulo. IAG-USP, Sao Paulo, 282.
- Thornthwaite, C.W., Wilm, H.G., et al. (1994) Report of the Committee on Evaporation and Transpiration from 1943 to 1944. Transactions—American Geophysical Union, 5, 687.
- Thornthwaite, C.W. (1948) On the Approach toward a Rational Classification of Climate. Geographical Review, 38, 55-94. http://dx.doi.org/10.2307/210739
- Berlato, M. and Molion, L.C.B. (1981) Evaporation and Evapotranspiracao. Bulletin IPAGRO, 7, 3-96.
- Lombardo, M.A. (1985) Ilha de calor nas metropoles—O exemplo de Sao Paulo. Editora Hucitec com apoio de Lalekla S.A. Comercio e Industria, 244.
- Garcia Occhipinti, A. and Marques dos Santos, P. (1965) Analise das maximas intensidade de chuva na cidade de Sao Paulo. IAG-USP, Sao Paulo, 41.
- Thornthwaite, C.W. and Mather, J.R. (1955) The Water Balance. Laboratory of Climatology, Centerton.
- Penman, H.L. (1948) Natural Evaporation from Open Water, Bare Soil and Grass. Proceedings of the Royal Society A, London, 193, 120-145. http://dx.doi.org/10.1098/rspa.1948.0037
- Penman, H.L. (1956) Evaporation an Introductory Survey. Netherlands Journal of Agricultural Science, 4, 9-29.
- Bavel, C.H.M. (1956) A Nomogram to Estimate Maximum Evapotranspiration. North Carolina State College, Raleigh.
- Blaney, H.F. and Criddle, W.D. (1950) Determining Requirements Water in Irrigated Areas from Climatological and Irrigation Data. Washington Soil Conservation Service, 48.
- Bowen, I.S. (1926) The Ratio of Heat Losses by Conduction and by Evaporation from Any Water Surface. Physical Review, 27, 779-787. http://dx.doi.org/10.1103/PhysRev.27.779
- Fritschen, L.J. (1966) Evapotranspiration Rates of Field Crops Determinated by Bowen Ratio Method. Agronomy Journal, 58, 339-342. http://dx.doi.org/10.2134/agronj1966.00021962005800030028x
- Camargo, A.P. (1961) Contribution to the Determination of Potential Evapotranspiration in the State of Sao Paulo. Doctoral Thesis, ESALQ-USP, Sao Paulo.
- Camargo, A.P. (1962) Contribution to the Determination of Evapotranspiration in the State of Sao Paulo. Bragantia, 21, 163-213. http://dx.doi.org/10.1590/S0006-87051962000100012
- Camargo, A.P. (1978) Water Balance in State of Sao Paulo. Bulletin, 116, Agricultural Institute—Campinas-SP, 28.
- Nova, N.A.V. (1973) Studies on the Energy Balance in Rice Culture. Thesis Habilitation, ESALQ-USP, Sao Paulo, 89.
- Sa, L.D.A., Manzi, A.O. and Viswanandham, Y. (1986) A Comparison of Bowen Ratio Estimates Obtained by Different Methods in the Amazon Rain Forest. IV Brazilian Congress of Meteorology—Rio de Janeiro-RJ, Proceedings II, 216-222.
- Gielow, R., Santos, R.C.S., Santos, J.M. and Viswanandham, Y. (1990) Bowen Ratio Condition for Advection on Rain Forest. VI Brasilian Congress of Meteorology, Salvador-BA, Annals, 383-387.
- Paiva, C.M., Liu, W.T.H. and France, G.B. (2000) Determination of Crop Evapotranspiration of Wheat by Energy Balance—Bowen Ratio Method to Londrina-PR. XI—Brazilian Congress of Meteorology, Rio de Janeiro-RJ, Annals, 159-164.
- Cunha, A.R., Escobedo, J.F. and Klosowski, E.S. (2002) Estimation of the Latent Heat Flux by the Energy Balance in Protected Pepper Cultivation. Brazilian Agricultural Research, 37, 735-747.
- Boueri, M.A. (2007) Estimation of Crop Evapotranspiration of Tagetes patula by the Bowen Ratio Method in Greenhouse and Field. Thesis, Universidade Estadual Paulista, Botucatu.
- Biudes, M.S., Valentini, C.M., Campelo Jr., A.J.H. and Nogueira, J.S. (2008) Estimation of Evapotranspiration in a Mixed Landscape of Savanna Conditions the Method of Bowen Ratio and Penman—Monteith. Science and Natura, UFSM, 30, 71-86.
- Silva, A.F., Pereira, R.I., Machado, W.B. and Silva, R. (2010) Energy Flows in Agriculture and f in the Amazon. 1st International Seminar on Science Environmental Sustainability of the Amazon, UFAM.
- Oliveira, A.S. (1971) Comparative Studies of Potential Evapotranspiration Estimated by Tanks and by Penman. Thesis Free-Teaching, Escola Superior de Agricultura Luiz de Queiroz, USP, Piracicaba, 90.
- Armani, G. (2004) Interactions between Atmosphere and Land Surface. Master’s Dissertation, DG-FFLCH-USP, 198.
- Armani, G. (2009) Analysis and Top Three-Dimensional Microclimate of a Watershed Humid Tropical Climate of Altitude. Doctoral Thesis, DG-FFLCH-USP.
- Armani, G. and Galvani, E. (2006) Performance Evaluation of a Weather Shelter Low Cost. Brazilian Journal of Agrometeorology, 14, 34-40.
- Meteorological Service Navy—Navy of Brazil (2011-2013) Synoptic Letters.
- Funari, F.L. and Filho, A.J.P. (2010) Comparative Analysis of Meteorological Variables Measurements Made by Conventional and Automatic Weather Stations in the Parque Estadual das Fontes do Ipiranga, Sao Paulo-SP. Brazilian Journal of Climatology, 7, 159-167.
- Funari, F.L. (2013) Research Report. LabHidro-IAG-USP, 41.
- Funari, F.L. and Filho, A.J.P. (2014) The Determination of the Heat Flux in the Soil, Using Data of Soil Temperature In the Parque Estadual das Fontes do Ipiranga, Sao Paulo-SP. (To Be Published)
- Mota, F.S. (1977) Meteorologia Agricola. Editora Nobel, 376.
- Funari, F.L. and Filho, A.J.P. (2014) Comparisons between Measurements of Temperature and Relative Humidity, Obtained in a Shelter for Low Cost Passive Ventilation and a Standard Weather Shelter. (In the Final Stage of Writing)
- Ferreira, W.A. (1972) Use of Evaporation Piche to Estimate the Potential Evapotranspiration. Doctoral Thesis, Universidade Estadual Paulista, Botucatu, 72.
- Filho, A.J.P., Massambani, O., Lobo, G.A. and Castilhano, L.L. (2002) Water Balance of the Hydrographical Basin of IAG. In: Bicudo, D.C., Forti, M.C. and Bicudo, C.E.M., Eds., Parque Estadual das Fontes do Ipiranga, Org. Secretaria do Meio Ambiente, Estado de Sao Paulo, 351.
- Molion, L.C.B. (1987) Micrometeorology of the Amazonian Rain Forest. In: Dickinson, R.E., Ed., Geophysiology of Amazonian: Vegetation and Climate Interactions, Wiley and Sons, Hoboken, 255-270.
- De Souza, R.L.M., Filho, E.P.M., Filho, O.C.R., Mesquita, F.L.L., Karam, H.A. and Sa, L.D.A. (2009) Estudo do balanco de energia superficial do Pantanal Sul Mato-grossense durante o periodo Seco e umido. 2nd Simposio de Geotecnologia no Pantanal, Corumba, 7-11 November 2009, 314-322.